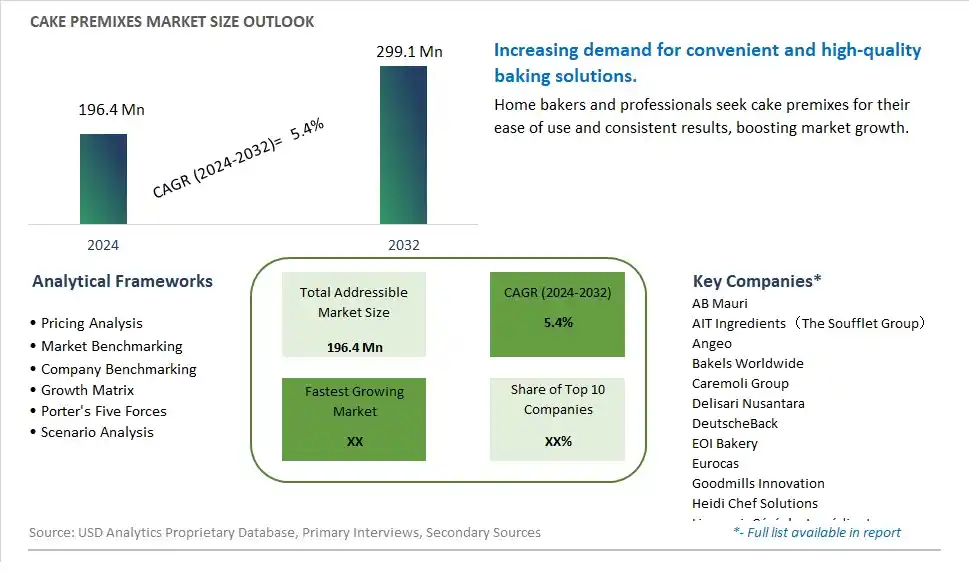
Global Cake Premixes Market Size is valued at $196.4 Million in 2024 and is forecast to register a growth rate (CAGR) of 5.4% to reach $299.1 Million by 2032.
The global Cake Premixes Market Comprehensive Study analyzes and forecasts the market size across 6 regions and 24 countries for diverse segments -By Type (Vanilla, Chocolate, Citrus, Mixed fruit, Others), By Application (Online, Offline)
An Introduction to Cake Premixes Market
The Cake Premixes market in 2024 is expanding rapidly, fueled by the increasing demand for convenient and high-quality baking solutions. Cake premixes, which include pre-measured ingredients for various cake recipes, are popular among home bakers and professional pastry chefs for their ease of use and consistent results. The market is supported by the growing trend towards home baking and the demand for easy-to-prepare products. Innovations in premix formulations are enhancing the flavor, texture, and nutritional profile of cakes. The market is also benefiting from the rise of specialty and health-focused premixes, including gluten-free, organic, and high-protein options, catering to diverse dietary needs and preferences.
Cake Premixes Competitive Landscape
The market report analyses the leading companies in the industry including AB Mauri, AIT Ingredients(The Soufflet Group), Angeo, Bakels Worldwide, Caremoli Group, Delisari Nusantara, DeutscheBack, EOI Bakery, Eurocas, Goodmills Innovation, Heidi Chef Solutions, LimagrainCéréalesIngrédients, Manildra Group, Master Martini, MILLBÄKERSAS, Mix Plant, Nisshin, PreGel, Puratos Group NV, Swiss Bake Ingredients, Theodor Rietmann, Zion International Food Ingredients, and Others.
Cake Premixes Market Dynamics
Cake Premixes Market Trend: Rising Demand for Convenience and Time-Saving Solutions
One prominent market trend for Cake Premixes is the rising demand for convenience and time-saving solutions in baking. As consumers lead increasingly busy lifestyles, they seek quick and easy ways to prepare homemade cakes without compromising on taste and quality. Cake Premixes offer a convenient solution by providing pre-measured ingredients and simplified baking instructions, catering to the needs of busy households and amateur bakers.
Cake Premixes Market Driver: Growing Popularity of Home Baking and DIY Culture
The market driver for Cake Premixes is the growing popularity of home baking and the do-it-yourself (DIY) culture. With more people exploring baking as a hobby or creative outlet, there is a significant demand for baking products that are user-friendly and beginner-friendly. Cake Premixes enable novice bakers to achieve professional-quality results with ease, driving the sales of these convenient baking solutions.
Cake Premixes Market Opportunity: Expansion into Health-Conscious and Specialty Varieties
An opportunity within the Cake Premixes market lies in the expansion into health-conscious and specialty varieties. As consumers become more health-conscious and mindful of their dietary choices, there is a demand for Cake Premixes that offer healthier alternatives, such as low-sugar, gluten-free, or organic options. Additionally, there is an opportunity to introduce specialty Cake Premixes with unique flavors, textures, and ingredients to cater to niche markets and differentiate from competitors. By tapping into these segments, manufacturers can capture a broader customer base and capitalize on evolving consumer preferences.
Cake Premixes Market Share Analysis: Vanilla Cake Premixes segment generated the highest revenue share in the industry
Among the Cake Premixes Market types, Vanilla cake premixes emerge as the largest segment, showcasing consistent growth and widespread popularity. The enduring appeal of vanilla flavoring in baked goods transcends generations and cultural boundaries, making it a timeless choice for consumers globally. Vanilla cake premixes offer a classic and versatile base for a wide range of cake variations, from simple sheet cakes to elaborate layered confections. The segment's prominence can be attributed to several factors. Firstly, vanilla's universal appeal makes it a preferred choice for various occasions, including birthdays, weddings, and celebrations, contributing significantly to its market share. Further, the adaptability of vanilla flavor complements a multitude of frosting, filling, and topping options, enhancing its versatility and consumer appeal. Additionally, the growing trend of home baking and the increasing demand for convenient yet high-quality baking solutions further bolster the dominance of vanilla cake premixes in the market.
Cake Premixes Market Share Analysis: Online Cake Premixes is the fastest growing segment over the forecast period to 2032
The Online Cake Premixes Market emerges as the fastest-growing segment in the Cake Premixes Market-By Application category, showcasing remarkable growth potential up to 2032. This segment's rapid ascent can be attributed to several key factors driving the shift towards online purchasing trends. With the increasing penetration of digital technologies and the widespread adoption of e-commerce platforms, consumers are increasingly turning to online channels for their baking needs. The convenience, accessibility, and wider product range offered by online platforms are enticing more consumers to explore and purchase cake premixes online. Additionally, the Past few yearshas further accelerated the digital transformation of the retail landscape, leading to a surge in online shopping for groceries, baking supplies, and ready-to-use baking products. As consumers seek convenience, time-saving solutions, and a diverse range of cake premix options, the Online Cake Premixes Market is poised for significant growth in the coming years.
Cake Premixes Market Segmentation
By Type
Vanilla
Chocolate
Citrus
Mixed fruit
Others
By Application
Online
Offline
Countries Analyzed
North America (US, Canada, Mexico)
Europe (Germany, UK, France, Spain, Italy, Russia, Rest of Europe)
Asia Pacific (China, India, Japan, South Korea, Australia, South East Asia, Rest of Asia)
South America (Brazil, Argentina, Rest of South America)
Middle East and Africa (Saudi Arabia, UAE, Rest of Middle East, South Africa, Egypt, Rest of Africa)
Cake Premixes Companies Profiled in the Study
AB Mauri
AIT Ingredients(The Soufflet Group)
Angeo
Bakels Worldwide
Caremoli Group
Delisari Nusantara
DeutscheBack
EOI Bakery
Eurocas
Goodmills Innovation
Heidi Chef Solutions
LimagrainCéréalesIngrédients
Manildra Group
Master Martini
MILLBÄKERSAS
Mix Plant
Nisshin
PreGel
Puratos Group NV
Swiss Bake Ingredients
Theodor Rietmann
Zion International Food Ingredients
*- List Not Exhaustive
Chapter 1. TABLE OF CONTENTS
Chapter 2. Introduction to Cake Premixes Market
2.1. Market Overview
2.2. Key Statistics and Report Highlights
2.3. Scope of the Comprehensive Study
2.3.1. Market Definition
2.3.2 Countries and Regions Covered
2.3.3 Research Objective
2.3.4 Units, Currency, and Conversions
2.3.5 Industry Value Chain
2.4. Key Market Segments
2.5. Key Companies
2.6. Study Period
Chapter 3. Strategic Analysis Review
3.1. Cake Premixes Pricing Analysis and Forecast
3.2. Porter’s Five Forces
3.3. Market Ecosystem
3.4. SWOT Analysis
3.5. Regulatory Scenario
3.3. Effects of Inflation, Russia-Ukraine War, moderating economic growth, and other macroeconomic factors
Chapter 4. Competitive Landscape
4.1. Market Share Analysis
4.1.1. Global Cake Premixes Market Share by Company, 2023
4.1.2. Product Offerings of Leading Cake Premixes Companies
4.2. Market Entropy
4.2.1. New Product Launches in the Industry
4.2.2. Mergers, Acquisitions, Joint ventures, and Partnerships
4.3. Key Strategies and Best Practices
Chapter 5. Global Market Projections: Best, Reference, and Low Case Scenarios
5.1. Growth Analysis- Case Scenario Definitions
5.2. Low Growth Case Scenario Forecasts
5.3. Reference Growth Case Scenario Forecasts
5.4. High Growth Case Scenario Forecasts
Chapter 6. Market Dynamics
6.1. Cake Premixes Market Drivers
6.2. Cake Premixes Market Challenges
6.6. Cake Premixes Market Opportunities
6.4. Cake Premixes Market Trends
Chapter 7. Global Cake Premixes Market Outlook Trends
7.1. Global Cake Premixes Revenue (USD Million) and CAGR (%) by Type (2021-2032)
7.2. Global Cake Premixes Revenue (USD Million) and CAGR (%) by Application (2021-2032)
7.3. Global Cake Premixes Revenue (USD Million) and CAGR (%) by Product (2021-2032)
By Type
Vanilla
Chocolate
Citrus
Mixed fruit
Others
By Application
Online
Offline
Chapter 8. Global Cake Premixes Regional Analysis and Outlook
8.1. Global Cake Premixes Revenue (USD Million) By Regions (2021- 2032)
8.2. North America Cake Premixes Revenue (USD Million) by Country (2021-2032)
8.2.1. United States Cake Premixes Regional Analysis and Outlook
8.2.2. Canada Cake Premixes Regional Analysis and Outlook
8.2.3. Mexico Cake Premixes Regional Analysis and Outlook
8.3. Europe Cake Premixes Revenue (USD Million), by Country (2021-2032)
8.3.1. Germany Cake Premixes Regional Analysis and Outlook
8.3.2. France Cake Premixes Regional Analysis and Outlook
8.3.3. United Kingdom Cake Premixes Regional Analysis and Outlook
8.3.4. Spain Cake Premixes Regional Analysis and Outlook
8.3.5. Italy Cake Premixes Regional Analysis and Outlook
8.3.6. Russia Cake Premixes Regional Analysis and Outlook
8.3.7. Rest of Europe Cake Premixes Regional Analysis and Outlook
8.4. Asia Pacific Cake Premixes Revenue (USD Million) by Country (2021-2032)
8.4.1. China Cake Premixes Regional Analysis and Outlook
8.4.2. Japan Cake Premixes Regional Analysis and Outlook
8.4.3. India Cake Premixes Regional Analysis and Outlook
8.4.4. South Korea Cake Premixes Regional Analysis and Outlook
8.4.5. Australia Cake Premixes Regional Analysis and Outlook
8.4.6. South East Asia Cake Premixes Regional Analysis and Outlook
8.4.7. Rest of Asia Pacific Cake Premixes Regional Analysis and Outlook
8.5. South America Cake Premixes Revenue (USD Million), by Country (2021-2032)
8.5.1. Brazil Cake Premixes Regional Analysis and Outlook
8.5.2. Argentina Cake Premixes Regional Analysis and Outlook
8.5.3. Rest of South America Cake Premixes Regional Analysis and Outlook
8.6. Middle East and Africa Cake Premixes Revenue (USD Million) by Country (2021-2032)
8.6.1. Middle East Cake Premixes Regional Analysis and Outlook
8.6.2. Africa Cake Premixes Regional Analysis and Outlook
Chapter 9. North America Cake Premixes Analysis and Outlook
9.1. North America Cake Premixes Revenue (USD Million) by Segments (2021-2032)
9.1.1. North America Cake Premixes Revenue (USD Million) by Type (2021-2032)
9.1.2. North America Cake Premixes Revenue (USD Million) by Application (2021-2032)
9.1.3. North America Cake Premixes Revenue (USD Million) by Product (2021-2032)
By Type
Vanilla
Chocolate
Citrus
Mixed fruit
Others
By Application
Online
Offline
Chapter 10. Europe Cake Premixes Analysis and Outlook
10.1. Europe Cake Premixes Revenue (USD Million), by Segments (USD Million) (2021-2032)
10.1.1. Europe Cake Premixes Revenue (USD Million) by Type (2021-2032)
10.1.2. Europe Cake Premixes Revenue (USD Million) by Application (2021-2032)
10.1.3. Europe Cake Premixes Revenue (USD Million) by Product (2021-2032)
By Type
Vanilla
Chocolate
Citrus
Mixed fruit
Others
By Application
Online
Offline
Chapter 11. Asia Pacific Cake Premixes Analysis and Outlook
11.1. Asia Pacific Cake Premixes Revenue (USD Million), and Revenue (USD Million) by Segments (2021-2032)
11.1.1. Asia Pacific Cake Premixes Revenue (USD Million) by Type (2021-2032)
11.1.2. Asia Pacific Cake Premixes Revenue (USD Million) by Application (2021-2032)
11.1.3. Asia Pacific Cake Premixes Revenue (USD Million) by Product (2021-2032)
By Type
Vanilla
Chocolate
Citrus
Mixed fruit
Others
By Application
Online
Offline
Chapter 12. South America Cake Premixes Analysis and Outlook
12.1. South America Cake Premixes Revenue (USD Million), by Segments (2021-2032)
12.1.1. South America Cake Premixes Revenue (USD Million) by Type (2021-2032)
12.1.2. South America Cake Premixes Revenue (USD Million) by Application (2021-2032)
12.1.3. South America Cake Premixes Revenue (USD Million) by Product (2021-2032)
By Type
Vanilla
Chocolate
Citrus
Mixed fruit
Others
By Application
Online
Offline
Chapter 13. Middle East and Africa Cake Premixes Analysis and Outlook
13.1. Middle East and Africa Cake Premixes Revenue (USD Million), by Segments (2021-2032)
13.1.1. Middle East and Africa Cake Premixes Revenue (USD Million) by Type (2021-2032)
13.1.2. Middle East and Africa Cake Premixes Revenue (USD Million) by Application (2021-2032)
13.1.3. Middle East and Africa Cake Premixes Revenue (USD Million) by Product (2021-2032)
By Type
Vanilla
Chocolate
Citrus
Mixed fruit
Others
By Application
Online
Offline
Chapter 14. Cake Premixes Company Profiles
14.1 Business Overview
14.2 Product Profiles
14.3 SWOT Profiles
14.5 Recent Developments
14.6 Financial Profile
List of Companies
AB Mauri
AIT Ingredients(The Soufflet Group)
Angeo
Bakels Worldwide
Caremoli Group
Delisari Nusantara
DeutscheBack
EOI Bakery
Eurocas
Goodmills Innovation
Heidi Chef Solutions
LimagrainCéréalesIngrédients
Manildra Group
Master Martini
MILLBÄKERSAS
Mix Plant
Nisshin
PreGel
Puratos Group NV
Swiss Bake Ingredients
Theodor Rietmann
Zion International Food Ingredients
15. Methodology and Data Sources
15.1 Customization Offerings
15.2 Subscription Services
15.3 Related Reports
15.4 Publisher Expertise
LIST OF TABLES
Table 1 Market Segmentation Analysis
Table 2 Global Cake Premixes Market Share of Leading Companies, 2023
Table 3 Product Offerings of Leading Companies
Table 4 Low Growth Scenario Forecasts
Table 5 Reference Case Growth Scenario
Table 6 High Growth Case Scenario
Table 7 Global Cake Premixes Revenue (USD Million) And CAGR (%) By Type (2021-2032)
Table 8 Global Cake Premixes Revenue (USD Million) And CAGR (%) By Application (2021-2032)
Table 9 Global Cake Premixes Revenue (USD Million) And CAGR (%) By Product (2021-2032)
Table 10 Global Cake Premixes Market Revenue (USD Million) By Regions (2021-2032)
Table 11 Global Cake Premixes Market Share (%) By Regions (2021-2032)
Table 12 North America Cake Premixes Revenue (USD Million) By Country (2021-2032)
Table 13 Europe Cake Premixes Revenue (USD Million) By Country (2021-2032)
Table 14 Asia Pacific Cake Premixes Revenue (USD Million) By Country (2021-2032)
Table 15 South America Cake Premixes Revenue (USD Million) By Country (2021-2032)
Table 16 Middle East and Africa Cake Premixes Revenue (USD Million) By Region (2021-2032)
Table 17 North America Cake Premixes Revenue (USD Million) By Type (2021-2032)
Table 18 North America Cake Premixes Revenue (USD Million) By Application (2021-2032)
Table 19 North America Cake Premixes Revenue (USD Million) By Product (2021-2032)
Table 20 Europe Cake Premixes Revenue (USD Million) By Type (2021-2032)
Table 21 Europe Cake Premixes Revenue (USD Million) By Application (2021-2032)
Table 22 Europe Cake Premixes Revenue (USD Million) By Product (2021-2032)
Table 23 Asia Pacific Cake Premixes Revenue (USD Million) By Type (2021-2032)
Table 24 Asia Pacific Cake Premixes Revenue (USD Million) By Application (2021-2032)
Table 25 Asia Pacific Cake Premixes Revenue (USD Million) By Product (2021-2032)
Table 26 South America Cake Premixes Revenue (USD Million) By Type (2021-2032)
Table 27 South America Cake Premixes Revenue (USD Million) By Application (2021-2032)
Table 28 South America Cake Premixes Revenue (USD Million) By Product (2021-2032)
Table 29 Middle East and Africa Cake Premixes Revenue (USD Million) By Type (2021-2032)
Table 30 Middle East and Africa Cake Premixes Revenue (USD Million) By Application (2021-2032)
Table 31 Middle East and Africa Cake Premixes Revenue (USD Million) By Product (2021-2032)
LIST OF FIGURES
Figure 1. Market Scope
Figure 2. Pricing Forecasts Per Unit, 2023- 2032
Figure 3. Porter’s Five Forces
Figure 4. Global Cake Premixes Market Revenue (USD Million) By Regions (2021-2032)
Figure 5. Global Cake Premixes Market Share (%) By Regions (2023)
Figure 6. North America Cake Premixes Revenue (USD Million) By Country (2021-2032)
Figure 7. United States Cake Premixes Revenue (USD Million) By Country (2021-2032)
Figure 8. Canada Cake Premixes Revenue (USD Million) By Country (2021-2032)
Figure 9. Mexico Cake Premixes Revenue (USD Million) By Country (2021-2032)
Figure 10. Europe Cake Premixes Revenue (USD Million) By Country (2021-2032)
Figure 11. Germany Cake Premixes Revenue (USD Million) By Country (2021-2032)
Figure 12. France Cake Premixes Revenue (USD Million) By Country (2021-2032)
Figure 13. United Kingdom Cake Premixes Revenue (USD Million) By Country (2021-2032)
Figure 14. Spain Cake Premixes Revenue (USD Million) By Country (2021-2032)
Figure 15. Italy Cake Premixes Revenue (USD Million) By Country (2021-2032)
Figure 16. Russia Cake Premixes Revenue (USD Million) By Country (2021-2032)
Figure 17. Rest of Europe Cake Premixes Revenue (USD Million) By Country (2021-2032)
Figure 11. Asia Pacific Cake Premixes Revenue (USD Million) By Country (2021-2032)
Figure 12. China Cake Premixes Revenue (USD Million) By Country (2021-2032)
Figure 13. Japan Cake Premixes Revenue (USD Million) By Country (2021-2032)
Figure 14. India Cake Premixes Revenue (USD Million) By Country (2021-2032)
Figure 15. South Korea Cake Premixes Revenue (USD Million) By Country (2021-2032)
Figure 16. Australia Cake Premixes Revenue (USD Million) By Country (2021-2032)
Figure 17. South East Asia Cake Premixes Revenue (USD Million) By Country (2021-2032)
Figure 18. South America Cake Premixes Revenue (USD Million) By Country (2021-2032)
Figure 19. Brazil Cake Premixes Revenue (USD Million) By Country (2021-2032)
Figure 20. Argentina Cake Premixes Revenue (USD Million) By Country (2021-2032)
Figure 21. Rest of Asia Pacific Cake Premixes Revenue (USD Million) By Country (2021-2032)
Figure 22. Middle East and Africa Cake Premixes Revenue (USD Million) By Region (2021-2032)
Figure 23. Saudi Arabia Cake Premixes Revenue (USD Million) By Region (2021-2032)
Figure 24. The UAE Cake Premixes Revenue (USD Million) By Region (2021-2032)
Figure 25. Rest of Middle East Cake Premixes Revenue (USD Million) By Region (2021-2032)
Figure 26. South Africa Cake Premixes Revenue (USD Million) By Region (2021-2032)
Figure 27. Africa Cake Premixes Revenue (USD Million) By Region (2021-2032)
Figure 28. North America Cake Premixes Revenue (USD Million) By Type (2021-2032)
Figure 29. North America Cake Premixes Revenue (USD Million) By Application (2021-2032)
Figure 30. North America Cake Premixes Revenue (USD Million) By Product (2021-2032)
Figure 31. Europe Cake Premixes Revenue (USD Million) By Type (2021-2032)
Figure 32. Europe Cake Premixes Revenue (USD Million) By Application (2021-2032)
Figure 33. Europe Cake Premixes Revenue (USD Million) By Product (2021-2032)
Figure 34. Asia Pacific Cake Premixes Revenue (USD Million) By Type (2021-2032)
Figure 35. Asia Pacific Cake Premixes Revenue (USD Million) By Application (2021-2032)
Figure 36. Asia Pacific Cake Premixes Revenue (USD Million) By Product (2021-2032)
Figure 37. South America Cake Premixes Revenue (USD Million) By Type (2021-2032)
Figure 38. South America Cake Premixes Revenue (USD Million) By Application (2021-2032)
Figure 39. South America Cake Premixes Revenue (USD Million) By Product (2021-2032)
Figure 40. Middle East and Africa Cake Premixes Revenue (USD Million) By Type (2021-2032)
Figure 41. Middle East and Africa Cake Premixes Revenue (USD Million) By Application (2021-2032)
Figure 42. Middle East and Africa Cake Premixes Revenue (USD Million) By Product (2021-2032)
By Type
Vanilla
Chocolate
Citrus
Mixed fruit
Others
By Application
Online
Offline
Countries Analyzed
North America (US, Canada, Mexico)
Europe (Germany, UK, France, Spain, Italy, Russia, Rest of Europe)
Asia Pacific (China, India, Japan, South Korea, Australia, South East Asia, Rest of Asia)
South America (Brazil, Argentina, Rest of South America)
Middle East and Africa (Saudi Arabia, UAE, Rest of Middle East, South Africa, Egypt, Rest of Africa)
