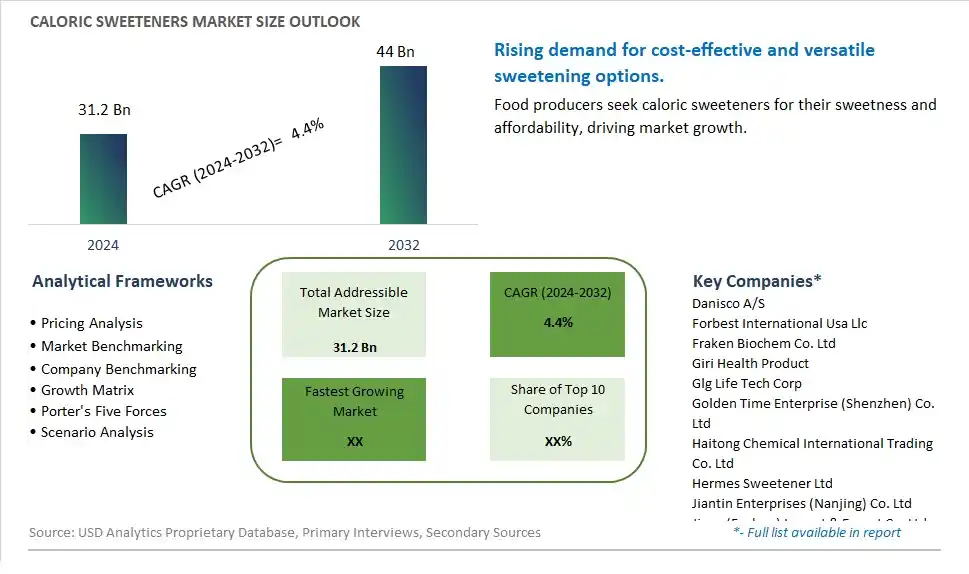
Global Caloric Sweeteners Market Size is valued at $31.2 Billion in 2024 and is forecast to register a growth rate (CAGR) of 4.4% to reach $44 Billion by 2032.
The global Caloric Sweeteners Market Comprehensive Study analyzes and forecasts the market size across 6 regions and 24 countries for diverse segments -By Type (Sorbitol, Mannitol, Others), By Application (Food & Beverage, Industrial, Medical, Others)
An Introduction to Caloric Sweeteners Market
The Caloric Sweeteners market in 2024 is expanding steadily, driven by the sustained demand for traditional sweeteners in the food and beverage industry. Caloric sweeteners, including sugar, high fructose corn syrup, and honey, are essential for adding sweetness and enhancing the flavor and texture of various products. The market is supported by the growing consumption of processed and packaged foods. Advances in sweetener production and refining technologies are enhancing the quality and consistency of caloric sweeteners. The market is also benefiting from the trend towards natural and minimally processed sweeteners, appealing to consumers seeking high-quality and traditional sweetening options.
Caloric Sweeteners Competitive Landscape
The market report analyses the leading companies in the industry including Danisco A/S, Forbest International Usa Llc, Fraken Biochem Co. Ltd, Giri Health Product, Glg Life Tech Corp, Golden Time Enterprise (Shenzhen) Co. Ltd, Haitong Chemical International Trading Co. Ltd, Hermes Sweetener Ltd, Jiantin Enterprises (Nanjing) Co. Ltd, Jiaye (Fuzhou) Import & Export Co. Ltd, JK Sucralose Inc, Kerrywin International Trading Co. Ltd, King Way Corp, Mcneil Nutritionals Llc, Merisant Worldwide Inc, Nutrasweet Company, Purecircle, Shandong Tianli Pharmaceutical Co. Ltd, Shandong Xiangchi Jianyuan Bio-Tech Co. Ltd, Shanghai Honghao Chemicals Co. Ltd, and Others.
Caloric Sweeteners Market Dynamics
Caloric Sweeteners Market Trend: Shift Towards Natural and Low-Calorie Sweeteners
One prominent market trend for Caloric Sweeteners is the shift towards natural and low-calorie sweeteners driven by increasing health consciousness among consumers. There is a growing demand for sweeteners derived from natural sources such as stevia, monk fruit, and erythritol, as they offer sweetness without the calories associated with traditional sugars. This trend aligns with the rising preference for healthier food choices and sugar reduction strategies in the food and beverage industry.
Caloric Sweeteners Market Driver: Rising Demand for Sugar-Free and Low-Glycemic Index Products
The market driver for Caloric Sweeteners is the rising demand for sugar-free and low-glycemic index products, particularly among consumers managing diabetes or pursuing healthier lifestyles. Caloric Sweeteners provide a viable alternative to sugar, offering sweetness without causing spikes in blood sugar levels. This driver is fueled by the increasing awareness of the negative health effects of excessive sugar consumption, leading consumers to seek healthier sweetening options.
Caloric Sweeteners Market Opportunity: Development of Functional Sweeteners and Blends
An opportunity within the Caloric Sweeteners market lies in the development of functional sweeteners and blends that offer additional health benefits. Manufacturers can innovate by incorporating ingredients like prebiotics, vitamins, or antioxidants into sweeteners, creating products that not only provide sweetness but also support overall health and wellness. By tapping into this opportunity, companies can cater to the growing demand for functional foods and beverages while meeting consumer expectations for healthier sweetening solutions.
Caloric Sweeteners Market Share Analysis: Sorbitol segment generated the highest revenue share in the industry
The largest segment in the Caloric Sweeteners Market is Sorbitol. Sorbitol, a polyol or sugar alcohol, is widely used as a sweetener in various food and beverage applications. Its popularity stems from several factors, including its ability to provide sweetness without adding as many calories as traditional sugars. Sorbitol is commonly utilized in sugar-free and reduced-sugar products, such as sugar-free candies, chewing gums, diabetic-friendly foods, and oral care products like toothpaste and mouthwash. Its versatility and compatibility with a range of food formulations make it a preferred choice for manufacturers looking to create healthier alternatives or cater to specific dietary needs. Additionally, sorbitol offers functional benefits such as moisture retention and improved texture, further enhancing its appeal in the food industry. With increasing consumer awareness of health and wellness, the demand for sorbitol as a caloric sweetener is expected to continue growing steadily, making it the largest segment in the Caloric Sweeteners Market.
Caloric Sweeteners Market Share Analysis: Food & Beverage is the fastest growing segment over the forecast period to 2032
In the Caloric Sweeteners Market, the Food & Beverage segment is experiencing the fastest growth trajectory. This segment encompasses a wide range of products, including beverages, baked goods, confectionery, dairy products, and savory snacks, among others, where caloric sweeteners like sorbitol, mannitol, and others play a crucial role. The growth in this segment is primarily driven by shifting consumer preferences towards healthier food and beverage options, increasing awareness about sugar-related health concerns, and the rising demand for low-calorie and reduced-sugar products. Food manufacturers are responding to these trends by reformulating their products to incorporate caloric sweeteners, thereby offering consumers alternatives that align with their health and wellness goals. Additionally, the versatility of caloric sweeteners in terms of taste enhancement, texture improvement, and functional properties further contributes to their adoption in various food and beverage applications. As a result, the Food & Beverage segment is poised for significant growth, making it the fastest-growing segment in the Caloric Sweeteners Market.
Caloric Sweeteners Market Segmentation
By Type
Sorbitol
Mannitol
Others
By Application
Food & Beverage
Industrial
Medical
Others
Countries Analyzed
North America (US, Canada, Mexico)
Europe (Germany, UK, France, Spain, Italy, Russia, Rest of Europe)
Asia Pacific (China, India, Japan, South Korea, Australia, South East Asia, Rest of Asia)
South America (Brazil, Argentina, Rest of South America)
Middle East and Africa (Saudi Arabia, UAE, Rest of Middle East, South Africa, Egypt, Rest of Africa)
Caloric Sweeteners Companies Profiled in the Study
Danisco A/S
Forbest International Usa Llc
Fraken Biochem Co. Ltd
Giri Health Product
Glg Life Tech Corp
Golden Time Enterprise (Shenzhen) Co. Ltd
Haitong Chemical International Trading Co. Ltd
Hermes Sweetener Ltd
Jiantin Enterprises (Nanjing) Co. Ltd
Jiaye (Fuzhou) Import & Export Co. Ltd
JK Sucralose Inc
Kerrywin International Trading Co. Ltd
King Way Corp
Mcneil Nutritionals Llc
Merisant Worldwide Inc
Nutrasweet Company
Purecircle
Shandong Tianli Pharmaceutical Co. Ltd
Shandong Xiangchi Jianyuan Bio-Tech Co. Ltd
Shanghai Honghao Chemicals Co. Ltd
*- List Not Exhaustive
Chapter 1. TABLE OF CONTENTS
Chapter 2. Introduction to Caloric Sweeteners Market
2.1. Market Overview
2.2. Key Statistics and Report Highlights
2.3. Scope of the Comprehensive Study
2.3.1. Market Definition
2.3.2 Countries and Regions Covered
2.3.3 Research Objective
2.3.4 Units, Currency, and Conversions
2.3.5 Industry Value Chain
2.4. Key Market Segments
2.5. Key Companies
2.6. Study Period
Chapter 3. Strategic Analysis Review
3.1. Caloric Sweeteners Pricing Analysis and Forecast
3.2. Porter’s Five Forces
3.3. Market Ecosystem
3.4. SWOT Analysis
3.5. Regulatory Scenario
3.3. Effects of Inflation, Russia-Ukraine War, moderating economic growth, and other macroeconomic factors
Chapter 4. Competitive Landscape
4.1. Market Share Analysis
4.1.1. Global Caloric Sweeteners Market Share by Company, 2023
4.1.2. Product Offerings of Leading Caloric Sweeteners Companies
4.2. Market Entropy
4.2.1. New Product Launches in the Industry
4.2.2. Mergers, Acquisitions, Joint ventures, and Partnerships
4.3. Key Strategies and Best Practices
Chapter 5. Global Market Projections: Best, Reference, and Low Case Scenarios
5.1. Growth Analysis- Case Scenario Definitions
5.2. Low Growth Case Scenario Forecasts
5.3. Reference Growth Case Scenario Forecasts
5.4. High Growth Case Scenario Forecasts
Chapter 6. Market Dynamics
6.1. Caloric Sweeteners Market Drivers
6.2. Caloric Sweeteners Market Challenges
6.6. Caloric Sweeteners Market Opportunities
6.4. Caloric Sweeteners Market Trends
Chapter 7. Global Caloric Sweeteners Market Outlook Trends
7.1. Global Caloric Sweeteners Revenue (USD Million) and CAGR (%) by Type (2021-2032)
7.2. Global Caloric Sweeteners Revenue (USD Million) and CAGR (%) by Application (2021-2032)
7.3. Global Caloric Sweeteners Revenue (USD Million) and CAGR (%) by Product (2021-2032)
By Type
Sorbitol
Mannitol
Others
By Application
Food & Beverage
Industrial
Medical
Others
Chapter 8. Global Caloric Sweeteners Regional Analysis and Outlook
8.1. Global Caloric Sweeteners Revenue (USD Million) By Regions (2021- 2032)
8.2. North America Caloric Sweeteners Revenue (USD Million) by Country (2021-2032)
8.2.1. United States Caloric Sweeteners Regional Analysis and Outlook
8.2.2. Canada Caloric Sweeteners Regional Analysis and Outlook
8.2.3. Mexico Caloric Sweeteners Regional Analysis and Outlook
8.3. Europe Caloric Sweeteners Revenue (USD Million), by Country (2021-2032)
8.3.1. Germany Caloric Sweeteners Regional Analysis and Outlook
8.3.2. France Caloric Sweeteners Regional Analysis and Outlook
8.3.3. United Kingdom Caloric Sweeteners Regional Analysis and Outlook
8.3.4. Spain Caloric Sweeteners Regional Analysis and Outlook
8.3.5. Italy Caloric Sweeteners Regional Analysis and Outlook
8.3.6. Russia Caloric Sweeteners Regional Analysis and Outlook
8.3.7. Rest of Europe Caloric Sweeteners Regional Analysis and Outlook
8.4. Asia Pacific Caloric Sweeteners Revenue (USD Million) by Country (2021-2032)
8.4.1. China Caloric Sweeteners Regional Analysis and Outlook
8.4.2. Japan Caloric Sweeteners Regional Analysis and Outlook
8.4.3. India Caloric Sweeteners Regional Analysis and Outlook
8.4.4. South Korea Caloric Sweeteners Regional Analysis and Outlook
8.4.5. Australia Caloric Sweeteners Regional Analysis and Outlook
8.4.6. South East Asia Caloric Sweeteners Regional Analysis and Outlook
8.4.7. Rest of Asia Pacific Caloric Sweeteners Regional Analysis and Outlook
8.5. South America Caloric Sweeteners Revenue (USD Million), by Country (2021-2032)
8.5.1. Brazil Caloric Sweeteners Regional Analysis and Outlook
8.5.2. Argentina Caloric Sweeteners Regional Analysis and Outlook
8.5.3. Rest of South America Caloric Sweeteners Regional Analysis and Outlook
8.6. Middle East and Africa Caloric Sweeteners Revenue (USD Million) by Country (2021-2032)
8.6.1. Middle East Caloric Sweeteners Regional Analysis and Outlook
8.6.2. Africa Caloric Sweeteners Regional Analysis and Outlook
Chapter 9. North America Caloric Sweeteners Analysis and Outlook
9.1. North America Caloric Sweeteners Revenue (USD Million) by Segments (2021-2032)
9.1.1. North America Caloric Sweeteners Revenue (USD Million) by Type (2021-2032)
9.1.2. North America Caloric Sweeteners Revenue (USD Million) by Application (2021-2032)
9.1.3. North America Caloric Sweeteners Revenue (USD Million) by Product (2021-2032)
By Type
Sorbitol
Mannitol
Others
By Application
Food & Beverage
Industrial
Medical
Others
Chapter 10. Europe Caloric Sweeteners Analysis and Outlook
10.1. Europe Caloric Sweeteners Revenue (USD Million), by Segments (USD Million) (2021-2032)
10.1.1. Europe Caloric Sweeteners Revenue (USD Million) by Type (2021-2032)
10.1.2. Europe Caloric Sweeteners Revenue (USD Million) by Application (2021-2032)
10.1.3. Europe Caloric Sweeteners Revenue (USD Million) by Product (2021-2032)
By Type
Sorbitol
Mannitol
Others
By Application
Food & Beverage
Industrial
Medical
Others
Chapter 11. Asia Pacific Caloric Sweeteners Analysis and Outlook
11.1. Asia Pacific Caloric Sweeteners Revenue (USD Million), and Revenue (USD Million) by Segments (2021-2032)
11.1.1. Asia Pacific Caloric Sweeteners Revenue (USD Million) by Type (2021-2032)
11.1.2. Asia Pacific Caloric Sweeteners Revenue (USD Million) by Application (2021-2032)
11.1.3. Asia Pacific Caloric Sweeteners Revenue (USD Million) by Product (2021-2032)
By Type
Sorbitol
Mannitol
Others
By Application
Food & Beverage
Industrial
Medical
Others
Chapter 12. South America Caloric Sweeteners Analysis and Outlook
12.1. South America Caloric Sweeteners Revenue (USD Million), by Segments (2021-2032)
12.1.1. South America Caloric Sweeteners Revenue (USD Million) by Type (2021-2032)
12.1.2. South America Caloric Sweeteners Revenue (USD Million) by Application (2021-2032)
12.1.3. South America Caloric Sweeteners Revenue (USD Million) by Product (2021-2032)
By Type
Sorbitol
Mannitol
Others
By Application
Food & Beverage
Industrial
Medical
Others
Chapter 13. Middle East and Africa Caloric Sweeteners Analysis and Outlook
13.1. Middle East and Africa Caloric Sweeteners Revenue (USD Million), by Segments (2021-2032)
13.1.1. Middle East and Africa Caloric Sweeteners Revenue (USD Million) by Type (2021-2032)
13.1.2. Middle East and Africa Caloric Sweeteners Revenue (USD Million) by Application (2021-2032)
13.1.3. Middle East and Africa Caloric Sweeteners Revenue (USD Million) by Product (2021-2032)
By Type
Sorbitol
Mannitol
Others
By Application
Food & Beverage
Industrial
Medical
Others
Chapter 14. Caloric Sweeteners Company Profiles
14.1 Business Overview
14.2 Product Profiles
14.3 SWOT Profiles
14.5 Recent Developments
14.6 Financial Profile
List of Companies
Danisco A/S
Forbest International Usa Llc
Fraken Biochem Co. Ltd
Giri Health Product
Glg Life Tech Corp
Golden Time Enterprise (Shenzhen) Co. Ltd
Haitong Chemical International Trading Co. Ltd
Hermes Sweetener Ltd
Jiantin Enterprises (Nanjing) Co. Ltd
Jiaye (Fuzhou) Import & Export Co. Ltd
JK Sucralose Inc
Kerrywin International Trading Co. Ltd
King Way Corp
Mcneil Nutritionals Llc
Merisant Worldwide Inc
Nutrasweet Company
Purecircle
Shandong Tianli Pharmaceutical Co. Ltd
Shandong Xiangchi Jianyuan Bio-Tech Co. Ltd
Shanghai Honghao Chemicals Co. Ltd
15. Methodology and Data Sources
15.1 Customization Offerings
15.2 Subscription Services
15.3 Related Reports
15.4 Publisher Expertise
LIST OF TABLES
Table 1 Market Segmentation Analysis
Table 2 Global Caloric Sweeteners Market Share of Leading Companies, 2023
Table 3 Product Offerings of Leading Companies
Table 4 Low Growth Scenario Forecasts
Table 5 Reference Case Growth Scenario
Table 6 High Growth Case Scenario
Table 7 Global Caloric Sweeteners Revenue (USD Million) And CAGR (%) By Type (2021-2032)
Table 8 Global Caloric Sweeteners Revenue (USD Million) And CAGR (%) By Application (2021-2032)
Table 9 Global Caloric Sweeteners Revenue (USD Million) And CAGR (%) By Product (2021-2032)
Table 10 Global Caloric Sweeteners Market Revenue (USD Million) By Regions (2021-2032)
Table 11 Global Caloric Sweeteners Market Share (%) By Regions (2021-2032)
Table 12 North America Caloric Sweeteners Revenue (USD Million) By Country (2021-2032)
Table 13 Europe Caloric Sweeteners Revenue (USD Million) By Country (2021-2032)
Table 14 Asia Pacific Caloric Sweeteners Revenue (USD Million) By Country (2021-2032)
Table 15 South America Caloric Sweeteners Revenue (USD Million) By Country (2021-2032)
Table 16 Middle East and Africa Caloric Sweeteners Revenue (USD Million) By Region (2021-2032)
Table 17 North America Caloric Sweeteners Revenue (USD Million) By Type (2021-2032)
Table 18 North America Caloric Sweeteners Revenue (USD Million) By Application (2021-2032)
Table 19 North America Caloric Sweeteners Revenue (USD Million) By Product (2021-2032)
Table 20 Europe Caloric Sweeteners Revenue (USD Million) By Type (2021-2032)
Table 21 Europe Caloric Sweeteners Revenue (USD Million) By Application (2021-2032)
Table 22 Europe Caloric Sweeteners Revenue (USD Million) By Product (2021-2032)
Table 23 Asia Pacific Caloric Sweeteners Revenue (USD Million) By Type (2021-2032)
Table 24 Asia Pacific Caloric Sweeteners Revenue (USD Million) By Application (2021-2032)
Table 25 Asia Pacific Caloric Sweeteners Revenue (USD Million) By Product (2021-2032)
Table 26 South America Caloric Sweeteners Revenue (USD Million) By Type (2021-2032)
Table 27 South America Caloric Sweeteners Revenue (USD Million) By Application (2021-2032)
Table 28 South America Caloric Sweeteners Revenue (USD Million) By Product (2021-2032)
Table 29 Middle East and Africa Caloric Sweeteners Revenue (USD Million) By Type (2021-2032)
Table 30 Middle East and Africa Caloric Sweeteners Revenue (USD Million) By Application (2021-2032)
Table 31 Middle East and Africa Caloric Sweeteners Revenue (USD Million) By Product (2021-2032)
LIST OF FIGURES
Figure 1. Market Scope
Figure 2. Pricing Forecasts Per Unit, 2023- 2032
Figure 3. Porter’s Five Forces
Figure 4. Global Caloric Sweeteners Market Revenue (USD Million) By Regions (2021-2032)
Figure 5. Global Caloric Sweeteners Market Share (%) By Regions (2023)
Figure 6. North America Caloric Sweeteners Revenue (USD Million) By Country (2021-2032)
Figure 7. United States Caloric Sweeteners Revenue (USD Million) By Country (2021-2032)
Figure 8. Canada Caloric Sweeteners Revenue (USD Million) By Country (2021-2032)
Figure 9. Mexico Caloric Sweeteners Revenue (USD Million) By Country (2021-2032)
Figure 10. Europe Caloric Sweeteners Revenue (USD Million) By Country (2021-2032)
Figure 11. Germany Caloric Sweeteners Revenue (USD Million) By Country (2021-2032)
Figure 12. France Caloric Sweeteners Revenue (USD Million) By Country (2021-2032)
Figure 13. United Kingdom Caloric Sweeteners Revenue (USD Million) By Country (2021-2032)
Figure 14. Spain Caloric Sweeteners Revenue (USD Million) By Country (2021-2032)
Figure 15. Italy Caloric Sweeteners Revenue (USD Million) By Country (2021-2032)
Figure 16. Russia Caloric Sweeteners Revenue (USD Million) By Country (2021-2032)
Figure 17. Rest of Europe Caloric Sweeteners Revenue (USD Million) By Country (2021-2032)
Figure 11. Asia Pacific Caloric Sweeteners Revenue (USD Million) By Country (2021-2032)
Figure 12. China Caloric Sweeteners Revenue (USD Million) By Country (2021-2032)
Figure 13. Japan Caloric Sweeteners Revenue (USD Million) By Country (2021-2032)
Figure 14. India Caloric Sweeteners Revenue (USD Million) By Country (2021-2032)
Figure 15. South Korea Caloric Sweeteners Revenue (USD Million) By Country (2021-2032)
Figure 16. Australia Caloric Sweeteners Revenue (USD Million) By Country (2021-2032)
Figure 17. South East Asia Caloric Sweeteners Revenue (USD Million) By Country (2021-2032)
Figure 18. South America Caloric Sweeteners Revenue (USD Million) By Country (2021-2032)
Figure 19. Brazil Caloric Sweeteners Revenue (USD Million) By Country (2021-2032)
Figure 20. Argentina Caloric Sweeteners Revenue (USD Million) By Country (2021-2032)
Figure 21. Rest of Asia Pacific Caloric Sweeteners Revenue (USD Million) By Country (2021-2032)
Figure 22. Middle East and Africa Caloric Sweeteners Revenue (USD Million) By Region (2021-2032)
Figure 23. Saudi Arabia Caloric Sweeteners Revenue (USD Million) By Region (2021-2032)
Figure 24. The UAE Caloric Sweeteners Revenue (USD Million) By Region (2021-2032)
Figure 25. Rest of Middle East Caloric Sweeteners Revenue (USD Million) By Region (2021-2032)
Figure 26. South Africa Caloric Sweeteners Revenue (USD Million) By Region (2021-2032)
Figure 27. Africa Caloric Sweeteners Revenue (USD Million) By Region (2021-2032)
Figure 28. North America Caloric Sweeteners Revenue (USD Million) By Type (2021-2032)
Figure 29. North America Caloric Sweeteners Revenue (USD Million) By Application (2021-2032)
Figure 30. North America Caloric Sweeteners Revenue (USD Million) By Product (2021-2032)
Figure 31. Europe Caloric Sweeteners Revenue (USD Million) By Type (2021-2032)
Figure 32. Europe Caloric Sweeteners Revenue (USD Million) By Application (2021-2032)
Figure 33. Europe Caloric Sweeteners Revenue (USD Million) By Product (2021-2032)
Figure 34. Asia Pacific Caloric Sweeteners Revenue (USD Million) By Type (2021-2032)
Figure 35. Asia Pacific Caloric Sweeteners Revenue (USD Million) By Application (2021-2032)
Figure 36. Asia Pacific Caloric Sweeteners Revenue (USD Million) By Product (2021-2032)
Figure 37. South America Caloric Sweeteners Revenue (USD Million) By Type (2021-2032)
Figure 38. South America Caloric Sweeteners Revenue (USD Million) By Application (2021-2032)
Figure 39. South America Caloric Sweeteners Revenue (USD Million) By Product (2021-2032)
Figure 40. Middle East and Africa Caloric Sweeteners Revenue (USD Million) By Type (2021-2032)
Figure 41. Middle East and Africa Caloric Sweeteners Revenue (USD Million) By Application (2021-2032)
Figure 42. Middle East and Africa Caloric Sweeteners Revenue (USD Million) By Product (2021-2032)
By Type
Sorbitol
Mannitol
Others
By Application
Food & Beverage
Industrial
Medical
Others
Countries Analyzed
North America (US, Canada, Mexico)
Europe (Germany, UK, France, Spain, Italy, Russia, Rest of Europe)
Asia Pacific (China, India, Japan, South Korea, Australia, South East Asia, Rest of Asia)
South America (Brazil, Argentina, Rest of South America)
Middle East and Africa (Saudi Arabia, UAE, Rest of Middle East, South Africa, Egypt, Rest of Africa)
