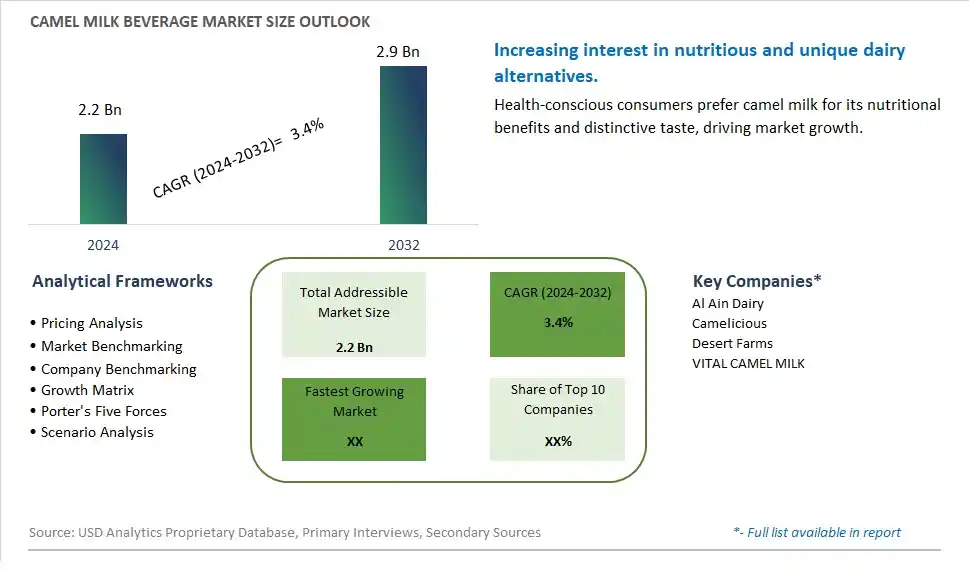
Global Camel Milk Beverage Market Size is valued at $2.2 Billion in 2024 and is forecast to register a growth rate (CAGR) of 3.4% to reach $2.9 Billion by 2032.
The global Camel Milk Beverage Market Comprehensive Study analyzes and forecasts the market size across 6 regions and 24 countries for diverse segments -By Type (Fresh, Processed), By Sales Channel (Online, Offline), By Product (Full Cream, Skimmed)
An Introduction to Camel Milk Beverage Market
In 2024, the Camel Milk Beverage market is witnessing significant growth, driven by the increasing awareness of the health benefits associated with camel milk. Camel milk, known for its high nutritional content and hypoallergenic properties, is gaining popularity as a dairy alternative. The market is supported by the growing trend towards functional and specialty beverages that offer unique health benefits. Advances in camel milk production and processing technologies are enhancing the quality, flavor, and shelf life of camel milk beverages. The market is also benefiting from the trend towards natural and organic products, appealing to health-conscious and lactose-intolerant consumers.
Camel Milk Beverage Competitive Landscape
The market report analyses the leading companies in the industry including Al Ain Dairy, Camelicious, Desert Farms, VITAL CAMEL MILK, and Others.
Camel Milk Beverage Market Dynamics
Camel Milk Beverage Market Trend: Growing Interest in Alternative Dairy Products
One prominent market trend for Camel Milk Beverage is the growing interest in alternative dairy products driven by consumer preferences for healthier and diverse options. With increased awareness of lactose intolerance, allergies to cow's milk, and the desire for functional foods, camel milk has gained traction as a nutritious and sustainable alternative. This trend reflects a shift towards exploring non-traditional sources of dairy that offer unique nutritional benefits.
Camel Milk Beverage Market Driver: Rising Health Consciousness and Functional Food Demand
The market driver for Camel Milk Beverage is the rising health consciousness among consumers and the growing demand for functional foods. Camel milk is perceived as a health-promoting beverage due to its rich nutritional profile, including high levels of vitamins, minerals, and immune-boosting compounds. As consumers prioritize wellness and seek out products with functional benefits, the demand for camel milk beverages is expected to increase.
Camel Milk Beverage Market Opportunity: Product Diversification and Innovation
An opportunity within the Camel Milk Beverage market lies in product diversification and innovation. Manufacturers can explore different flavors, formulations, and packaging options to appeal to a wider consumer base. Additionally, leveraging camel milk's functional properties, such as its potential anti-inflammatory and digestive health benefits, can create opportunities to position these beverages as premium health-focused products. By investing in R&D and marketing strategies that highlight the unique selling points of camel milk, companies can capitalize on the growing interest in alternative dairy beverages.
Camel Milk Beverage Market Share Analysis: Processed segment generated the highest revenue share in the industry
The largest segment in the Camel Milk Beverage Market is the Processed camel milk. Processed camel milk refers to milk that has undergone various treatments such as pasteurization, homogenization, and packaging to extend its shelf life and enhance its safety for consumption. This segment has gained significant traction due to several factors. Firstly, processed camel milk offers convenience and ease of storage compared to fresh camel milk, making it more accessible to consumers in both urban and rural areas. Further, processing techniques help maintain the nutritional quality of camel milk, including its high protein content, vitamins, and minerals, which are known for their health benefits. As consumer awareness regarding the nutritional value of camel milk grows, especially among health-conscious individuals, the demand for processed camel milk beverages is expected to surge. Furthermore, the versatility of processed camel milk allows for the development of various products such as flavored milk, yogurt, cheese, and ice cream, catering to diverse consumer preferences and expanding the market reach. Hence, the Processed camel milk segment holds a dominant position in the Camel Milk Beverage Market and is poised for continued growth in the coming years.
Camel Milk Beverage Market Share Analysis: Online Sales Channel is the fastest growing segment over the forecast period to 2032
The fastest-growing segment in the Camel Milk Beverage Market is the Online Sales Channel. With the rapid expansion of e-commerce platforms and the increasing preference for online shopping among consumers globally, the online sales channel for camel milk beverages has witnessed remarkable growth. Several factors contribute to the fast-paced growth of this segment. Firstly, online platforms offer convenience, accessibility, and a wide range of options for consumers to purchase camel milk beverages from the comfort of their homes. This convenience factor is particularly appealing to busy individuals and those residing in regions where physical access to camel milk products may be limited. Further, online channels provide a platform for niche and specialty products like camel milk beverages to reach a broader audience, including health-conscious consumers, individuals with lactose intolerance, and those seeking alternatives to traditional dairy products. Further, online marketing strategies, such as targeted advertisements, social media promotions, and influencer collaborations, play a significant role in driving consumer awareness and interest in camel milk beverages. As a result, the Online Sales Channel segment is experiencing rapid growth and is expected to continue expanding as e-commerce becomes increasingly prevalent in the food and beverage industry.
Camel Milk Beverage Market Share Analysis: Full Cream segment generated the highest revenue share in the industry
The largest segment in the Camel Milk Beverage Market is the Full Cream product category. Full cream camel milk refers to unaltered camel milk, retaining all its natural fats and nutrients without undergoing any fat removal processes. This segment's prominence stems from several factors. Firstly, full cream camel milk is prized for its rich taste and creamy texture, appealing to consumers looking for a wholesome and indulgent dairy alternative. Additionally, full cream camel milk contains essential nutrients like vitamins, minerals, and healthy fats, making it a nutritious choice for health-conscious individuals and those with specific dietary requirements. Further, the growing awareness of camel milk's potential health benefits, including its potential to boost immunity, aid digestion, and support overall well-being, has contributed to the increased demand for full cream camel milk beverages. As a result, the Full Cream segment has emerged as the largest segment in the Camel Milk Beverage Market, catering to a diverse range of consumers seeking a natural and nutritious dairy alternative.
Camel Milk Beverage Market Segmentation
By Type
Fresh
Processed
By Sales Channel
Online
Offline
By Product
Full Cream
Skimmed
Countries Analyzed
North America (US, Canada, Mexico)
Europe (Germany, UK, France, Spain, Italy, Russia, Rest of Europe)
Asia Pacific (China, India, Japan, South Korea, Australia, South East Asia, Rest of Asia)
South America (Brazil, Argentina, Rest of South America)
Middle East and Africa (Saudi Arabia, UAE, Rest of Middle East, South Africa, Egypt, Rest of Africa)
Camel Milk Beverage Companies Profiled in the Study
Al Ain Dairy
Camelicious
Desert Farms
VITAL CAMEL MILK
*- List Not Exhaustive
Chapter 1. TABLE OF CONTENTS
Chapter 2. Introduction to Camel Milk Beverage Market
2.1. Market Overview
2.2. Key Statistics and Report Highlights
2.3. Scope of the Comprehensive Study
2.3.1. Market Definition
2.3.2 Countries and Regions Covered
2.3.3 Research Objective
2.3.4 Units, Currency, and Conversions
2.3.5 Industry Value Chain
2.4. Key Market Segments
2.5. Key Companies
2.6. Study Period
Chapter 3. Strategic Analysis Review
3.1. Camel Milk Beverage Pricing Analysis and Forecast
3.2. Porter’s Five Forces
3.3. Market Ecosystem
3.4. SWOT Analysis
3.5. Regulatory Scenario
3.3. Effects of Inflation, Russia-Ukraine War, moderating economic growth, and other macroeconomic factors
Chapter 4. Competitive Landscape
4.1. Market Share Analysis
4.1.1. Global Camel Milk Beverage Market Share by Company, 2023
4.1.2. Product Offerings of Leading Camel Milk Beverage Companies
4.2. Market Entropy
4.2.1. New Product Launches in the Industry
4.2.2. Mergers, Acquisitions, Joint ventures, and Partnerships
4.3. Key Strategies and Best Practices
Chapter 5. Global Market Projections: Best, Reference, and Low Case Scenarios
5.1. Growth Analysis- Case Scenario Definitions
5.2. Low Growth Case Scenario Forecasts
5.3. Reference Growth Case Scenario Forecasts
5.4. High Growth Case Scenario Forecasts
Chapter 6. Market Dynamics
6.1. Camel Milk Beverage Market Drivers
6.2. Camel Milk Beverage Market Challenges
6.6. Camel Milk Beverage Market Opportunities
6.4. Camel Milk Beverage Market Trends
Chapter 7. Global Camel Milk Beverage Market Outlook Trends
7.1. Global Camel Milk Beverage Revenue (USD Million) and CAGR (%) by Type (2021-2032)
7.2. Global Camel Milk Beverage Revenue (USD Million) and CAGR (%) by Application (2021-2032)
7.3. Global Camel Milk Beverage Revenue (USD Million) and CAGR (%) by Product (2021-2032)
By Type
Fresh
Processed
By Sales Channel
Online
Offline
By Product
Full Cream
Skimmed
Chapter 8. Global Camel Milk Beverage Regional Analysis and Outlook
8.1. Global Camel Milk Beverage Revenue (USD Million) By Regions (2021- 2032)
8.2. North America Camel Milk Beverage Revenue (USD Million) by Country (2021-2032)
8.2.1. United States Camel Milk Beverage Regional Analysis and Outlook
8.2.2. Canada Camel Milk Beverage Regional Analysis and Outlook
8.2.3. Mexico Camel Milk Beverage Regional Analysis and Outlook
8.3. Europe Camel Milk Beverage Revenue (USD Million), by Country (2021-2032)
8.3.1. Germany Camel Milk Beverage Regional Analysis and Outlook
8.3.2. France Camel Milk Beverage Regional Analysis and Outlook
8.3.3. United Kingdom Camel Milk Beverage Regional Analysis and Outlook
8.3.4. Spain Camel Milk Beverage Regional Analysis and Outlook
8.3.5. Italy Camel Milk Beverage Regional Analysis and Outlook
8.3.6. Russia Camel Milk Beverage Regional Analysis and Outlook
8.3.7. Rest of Europe Camel Milk Beverage Regional Analysis and Outlook
8.4. Asia Pacific Camel Milk Beverage Revenue (USD Million) by Country (2021-2032)
8.4.1. China Camel Milk Beverage Regional Analysis and Outlook
8.4.2. Japan Camel Milk Beverage Regional Analysis and Outlook
8.4.3. India Camel Milk Beverage Regional Analysis and Outlook
8.4.4. South Korea Camel Milk Beverage Regional Analysis and Outlook
8.4.5. Australia Camel Milk Beverage Regional Analysis and Outlook
8.4.6. South East Asia Camel Milk Beverage Regional Analysis and Outlook
8.4.7. Rest of Asia Pacific Camel Milk Beverage Regional Analysis and Outlook
8.5. South America Camel Milk Beverage Revenue (USD Million), by Country (2021-2032)
8.5.1. Brazil Camel Milk Beverage Regional Analysis and Outlook
8.5.2. Argentina Camel Milk Beverage Regional Analysis and Outlook
8.5.3. Rest of South America Camel Milk Beverage Regional Analysis and Outlook
8.6. Middle East and Africa Camel Milk Beverage Revenue (USD Million) by Country (2021-2032)
8.6.1. Middle East Camel Milk Beverage Regional Analysis and Outlook
8.6.2. Africa Camel Milk Beverage Regional Analysis and Outlook
Chapter 9. North America Camel Milk Beverage Analysis and Outlook
9.1. North America Camel Milk Beverage Revenue (USD Million) by Segments (2021-2032)
9.1.1. North America Camel Milk Beverage Revenue (USD Million) by Type (2021-2032)
9.1.2. North America Camel Milk Beverage Revenue (USD Million) by Application (2021-2032)
9.1.3. North America Camel Milk Beverage Revenue (USD Million) by Product (2021-2032)
By Type
Fresh
Processed
By Sales Channel
Online
Offline
By Product
Full Cream
Skimmed
Chapter 10. Europe Camel Milk Beverage Analysis and Outlook
10.1. Europe Camel Milk Beverage Revenue (USD Million), by Segments (USD Million) (2021-2032)
10.1.1. Europe Camel Milk Beverage Revenue (USD Million) by Type (2021-2032)
10.1.2. Europe Camel Milk Beverage Revenue (USD Million) by Application (2021-2032)
10.1.3. Europe Camel Milk Beverage Revenue (USD Million) by Product (2021-2032)
By Type
Fresh
Processed
By Sales Channel
Online
Offline
By Product
Full Cream
Skimmed
Chapter 11. Asia Pacific Camel Milk Beverage Analysis and Outlook
11.1. Asia Pacific Camel Milk Beverage Revenue (USD Million), and Revenue (USD Million) by Segments (2021-2032)
11.1.1. Asia Pacific Camel Milk Beverage Revenue (USD Million) by Type (2021-2032)
11.1.2. Asia Pacific Camel Milk Beverage Revenue (USD Million) by Application (2021-2032)
11.1.3. Asia Pacific Camel Milk Beverage Revenue (USD Million) by Product (2021-2032)
By Type
Fresh
Processed
By Sales Channel
Online
Offline
By Product
Full Cream
Skimmed
Chapter 12. South America Camel Milk Beverage Analysis and Outlook
12.1. South America Camel Milk Beverage Revenue (USD Million), by Segments (2021-2032)
12.1.1. South America Camel Milk Beverage Revenue (USD Million) by Type (2021-2032)
12.1.2. South America Camel Milk Beverage Revenue (USD Million) by Application (2021-2032)
12.1.3. South America Camel Milk Beverage Revenue (USD Million) by Product (2021-2032)
By Type
Fresh
Processed
By Sales Channel
Online
Offline
By Product
Full Cream
Skimmed
Chapter 13. Middle East and Africa Camel Milk Beverage Analysis and Outlook
13.1. Middle East and Africa Camel Milk Beverage Revenue (USD Million), by Segments (2021-2032)
13.1.1. Middle East and Africa Camel Milk Beverage Revenue (USD Million) by Type (2021-2032)
13.1.2. Middle East and Africa Camel Milk Beverage Revenue (USD Million) by Application (2021-2032)
13.1.3. Middle East and Africa Camel Milk Beverage Revenue (USD Million) by Product (2021-2032)
By Type
Fresh
Processed
By Sales Channel
Online
Offline
By Product
Full Cream
Skimmed
Chapter 14. Camel Milk Beverage Company Profiles
14.1 Business Overview
14.2 Product Profiles
14.3 SWOT Profiles
14.5 Recent Developments
14.6 Financial Profile
List of Companies
Al Ain Dairy
Camelicious
Desert Farms
VITAL CAMEL MILK
15. Methodology and Data Sources
15.1 Customization Offerings
15.2 Subscription Services
15.3 Related Reports
15.4 Publisher Expertise
LIST OF TABLES
Table 1 Market Segmentation Analysis
Table 2 Global Camel Milk Beverage Market Share of Leading Companies, 2023
Table 3 Product Offerings of Leading Companies
Table 4 Low Growth Scenario Forecasts
Table 5 Reference Case Growth Scenario
Table 6 High Growth Case Scenario
Table 7 Global Camel Milk Beverage Revenue (USD Million) And CAGR (%) By Type (2021-2032)
Table 8 Global Camel Milk Beverage Revenue (USD Million) And CAGR (%) By Application (2021-2032)
Table 9 Global Camel Milk Beverage Revenue (USD Million) And CAGR (%) By Product (2021-2032)
Table 10 Global Camel Milk Beverage Market Revenue (USD Million) By Regions (2021-2032)
Table 11 Global Camel Milk Beverage Market Share (%) By Regions (2021-2032)
Table 12 North America Camel Milk Beverage Revenue (USD Million) By Country (2021-2032)
Table 13 Europe Camel Milk Beverage Revenue (USD Million) By Country (2021-2032)
Table 14 Asia Pacific Camel Milk Beverage Revenue (USD Million) By Country (2021-2032)
Table 15 South America Camel Milk Beverage Revenue (USD Million) By Country (2021-2032)
Table 16 Middle East and Africa Camel Milk Beverage Revenue (USD Million) By Region (2021-2032)
Table 17 North America Camel Milk Beverage Revenue (USD Million) By Type (2021-2032)
Table 18 North America Camel Milk Beverage Revenue (USD Million) By Application (2021-2032)
Table 19 North America Camel Milk Beverage Revenue (USD Million) By Product (2021-2032)
Table 20 Europe Camel Milk Beverage Revenue (USD Million) By Type (2021-2032)
Table 21 Europe Camel Milk Beverage Revenue (USD Million) By Application (2021-2032)
Table 22 Europe Camel Milk Beverage Revenue (USD Million) By Product (2021-2032)
Table 23 Asia Pacific Camel Milk Beverage Revenue (USD Million) By Type (2021-2032)
Table 24 Asia Pacific Camel Milk Beverage Revenue (USD Million) By Application (2021-2032)
Table 25 Asia Pacific Camel Milk Beverage Revenue (USD Million) By Product (2021-2032)
Table 26 South America Camel Milk Beverage Revenue (USD Million) By Type (2021-2032)
Table 27 South America Camel Milk Beverage Revenue (USD Million) By Application (2021-2032)
Table 28 South America Camel Milk Beverage Revenue (USD Million) By Product (2021-2032)
Table 29 Middle East and Africa Camel Milk Beverage Revenue (USD Million) By Type (2021-2032)
Table 30 Middle East and Africa Camel Milk Beverage Revenue (USD Million) By Application (2021-2032)
Table 31 Middle East and Africa Camel Milk Beverage Revenue (USD Million) By Product (2021-2032)
LIST OF FIGURES
Figure 1. Market Scope
Figure 2. Pricing Forecasts Per Unit, 2023- 2032
Figure 3. Porter’s Five Forces
Figure 4. Global Camel Milk Beverage Market Revenue (USD Million) By Regions (2021-2032)
Figure 5. Global Camel Milk Beverage Market Share (%) By Regions (2023)
Figure 6. North America Camel Milk Beverage Revenue (USD Million) By Country (2021-2032)
Figure 7. United States Camel Milk Beverage Revenue (USD Million) By Country (2021-2032)
Figure 8. Canada Camel Milk Beverage Revenue (USD Million) By Country (2021-2032)
Figure 9. Mexico Camel Milk Beverage Revenue (USD Million) By Country (2021-2032)
Figure 10. Europe Camel Milk Beverage Revenue (USD Million) By Country (2021-2032)
Figure 11. Germany Camel Milk Beverage Revenue (USD Million) By Country (2021-2032)
Figure 12. France Camel Milk Beverage Revenue (USD Million) By Country (2021-2032)
Figure 13. United Kingdom Camel Milk Beverage Revenue (USD Million) By Country (2021-2032)
Figure 14. Spain Camel Milk Beverage Revenue (USD Million) By Country (2021-2032)
Figure 15. Italy Camel Milk Beverage Revenue (USD Million) By Country (2021-2032)
Figure 16. Russia Camel Milk Beverage Revenue (USD Million) By Country (2021-2032)
Figure 17. Rest of Europe Camel Milk Beverage Revenue (USD Million) By Country (2021-2032)
Figure 11. Asia Pacific Camel Milk Beverage Revenue (USD Million) By Country (2021-2032)
Figure 12. China Camel Milk Beverage Revenue (USD Million) By Country (2021-2032)
Figure 13. Japan Camel Milk Beverage Revenue (USD Million) By Country (2021-2032)
Figure 14. India Camel Milk Beverage Revenue (USD Million) By Country (2021-2032)
Figure 15. South Korea Camel Milk Beverage Revenue (USD Million) By Country (2021-2032)
Figure 16. Australia Camel Milk Beverage Revenue (USD Million) By Country (2021-2032)
Figure 17. South East Asia Camel Milk Beverage Revenue (USD Million) By Country (2021-2032)
Figure 18. South America Camel Milk Beverage Revenue (USD Million) By Country (2021-2032)
Figure 19. Brazil Camel Milk Beverage Revenue (USD Million) By Country (2021-2032)
Figure 20. Argentina Camel Milk Beverage Revenue (USD Million) By Country (2021-2032)
Figure 21. Rest of Asia Pacific Camel Milk Beverage Revenue (USD Million) By Country (2021-2032)
Figure 22. Middle East and Africa Camel Milk Beverage Revenue (USD Million) By Region (2021-2032)
Figure 23. Saudi Arabia Camel Milk Beverage Revenue (USD Million) By Region (2021-2032)
Figure 24. The UAE Camel Milk Beverage Revenue (USD Million) By Region (2021-2032)
Figure 25. Rest of Middle East Camel Milk Beverage Revenue (USD Million) By Region (2021-2032)
Figure 26. South Africa Camel Milk Beverage Revenue (USD Million) By Region (2021-2032)
Figure 27. Africa Camel Milk Beverage Revenue (USD Million) By Region (2021-2032)
Figure 28. North America Camel Milk Beverage Revenue (USD Million) By Type (2021-2032)
Figure 29. North America Camel Milk Beverage Revenue (USD Million) By Application (2021-2032)
Figure 30. North America Camel Milk Beverage Revenue (USD Million) By Product (2021-2032)
Figure 31. Europe Camel Milk Beverage Revenue (USD Million) By Type (2021-2032)
Figure 32. Europe Camel Milk Beverage Revenue (USD Million) By Application (2021-2032)
Figure 33. Europe Camel Milk Beverage Revenue (USD Million) By Product (2021-2032)
Figure 34. Asia Pacific Camel Milk Beverage Revenue (USD Million) By Type (2021-2032)
Figure 35. Asia Pacific Camel Milk Beverage Revenue (USD Million) By Application (2021-2032)
Figure 36. Asia Pacific Camel Milk Beverage Revenue (USD Million) By Product (2021-2032)
Figure 37. South America Camel Milk Beverage Revenue (USD Million) By Type (2021-2032)
Figure 38. South America Camel Milk Beverage Revenue (USD Million) By Application (2021-2032)
Figure 39. South America Camel Milk Beverage Revenue (USD Million) By Product (2021-2032)
Figure 40. Middle East and Africa Camel Milk Beverage Revenue (USD Million) By Type (2021-2032)
Figure 41. Middle East and Africa Camel Milk Beverage Revenue (USD Million) By Application (2021-2032)
Figure 42. Middle East and Africa Camel Milk Beverage Revenue (USD Million) By Product (2021-2032)
By Type
Fresh
Processed
By Sales Channel
Online
Offline
By Product
Full Cream
Skimmed
Countries Analyzed
North America (US, Canada, Mexico)
Europe (Germany, UK, France, Spain, Italy, Russia, Rest of Europe)
Asia Pacific (China, India, Japan, South Korea, Australia, South East Asia, Rest of Asia)
South America (Brazil, Argentina, Rest of South America)
Middle East and Africa (Saudi Arabia, UAE, Rest of Middle East, South Africa, Egypt, Rest of Africa)
