The Global Camellia Oil Market Size is estimated to register 20.5% growth over the forecast period from 2023 to 2030.
The market growth is driven by the increasing looking for healthier cooking oil options. Camellia Oil is often perceived as a healthy choice due to its low saturated fat content and high levels of monounsaturated fats. The trend towards healthier eating can drive demand for Camellia Oil. Leading Companies that are focusing on Health and Wellness Continue to Drive Demand, Expanding Product Range, Organic and Specialty Varieties, Cosmetic and Skincare Applications, Packaging Innovation, Research and Innovation, and others to boost market shares in the industry.
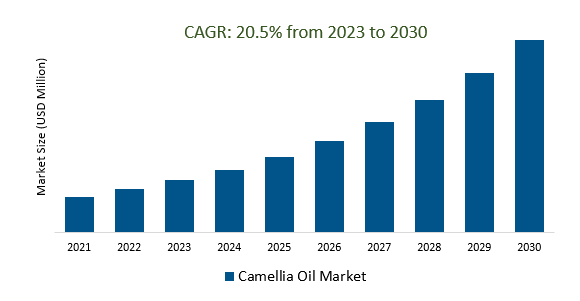
Market Overview
Camellia Oil is a versatile edible oil derived from tea plant seeds, known for its mild flavor, high nutritional value, and suitability for various culinary applications. The market has been driven by health-conscious consumers seeking healthier cooking oils, the global popularity of Asian cuisine, and the clean-label trend. Camellia Oil has also found applications in cosmetics and skincare due to its moisturizing properties. Challenges include competition from established oils and price volatility, while opportunities lie in expanding global markets and ongoing research into its health benefits.
Market Dynamics
Market Trends - A number of factors are contributing to the rising awareness of camellia oil, including its health benefits, versatility, and growing popularity in the skincare and cosmetics industries
Camellia oil has been gaining significant attention and recognition in recent years due to a multitude of factors. Its surge in popularity can be attributed to several key aspects. Firstly, camellia oil is celebrated for its numerous health benefits, such as its heart-healthy monounsaturated fats and rich antioxidants, which contribute to overall well-being. Additionally, its remarkable versatility in culinary applications, where it adds a delicate flavor and nutritional value to various dishes, has made it a kitchen staple. Moreover, camellia oil has emerged as a coveted ingredient in the skincare and cosmetics industries, thanks to its exceptional moisturizing properties and ability to promote skin and hair health.
Market Driver- Consumers and researchers are increasingly interested in the health benefits of camellia oil, driving demand for the market.
The growing curiosity surrounding camellia oil has sparked a significant surge in demand within both consumer and research circles. Consumers are increasingly drawn to this natural oil due to its perceived health benefits, including its heart-healthy monounsaturated fats and potent antioxidants, which are believed to contribute to overall well-being researchers are actively exploring the various potential health applications of camellia oil, further fueling interest in this versatile substance. This heightened awareness of camellia oil's health attributes not only underscores its expanding market appeal but also positions it as a subject of ongoing scientific investigation, promising even greater insights into its potential uses and benefits in the future.
Market Opportunity- The price and availability of alternative oils are important factors to consider when choosing a cooking oil
The cooking oil flavor and suitability for various culinary applications but also the price and availability of alternative options. These factors can significantly impact both the cost-effectiveness of your cooking endeavors and your ability to maintain a consistent supply of the chosen oil. In times of economic fluctuations or shortages, the cost of certain oils may rise, making less expensive alternatives a more practical choice for budget-conscious households or commercial kitchens.
Market Share Analysis- Extra Virgin camellia Oil the Camellia Oil Market will register the fastest growth
The Global Camellia Oil Market is analyzed across Pure Camellia Oil, Extra Virgin Camellia Oil, Pomace Camellia Oil, and others. Extra Virgin Camellia Oil is poised to register the fastest growth. Extra virgin camellia oil, extracted from the seeds of the Camellia oleifera plant, has gained popularity for its health benefits and culinary versatility. With a mild, nutty flavor and a high smoke point, it's ideal for cooking methods like stir-frying and sautéing, and it's also used in skincare products due to its moisturizing properties. To succeed in this market, focus on quality, sustainable sourcing, certifications, strong branding, and strategic distribution while staying attuned to evolving consumer preferences and industry trends.
Market Share Analysis- Cosmetics held a significant market share in 2023
The Global Camellia Oil Market is analyzed across various Installation Mode including Cosmetics, Pharmaceuticals, Food Industry, Chemical Industry, and others. Of these, Cosmetics held a significant market share in 2023. The cosmetics market for camellia oil focuses on using this natural oil in skincare and beauty products, known for its moisturizing properties. Success in this niche requires high-quality sourcing, effective product formulation, certifications, strong branding, and adept distribution. Staying attuned to beauty trends and consumer preferences is key to market success.
Camellia Oil Market Segmentation
By Type
- Pure camellia Oil
- Extra Virgin camellia Oil
- Pomace camellia Oil
By Application
- Cosmetics
- Pharmaceuticals
- Food Industry
- Chemical Industry
By Region
- North America (United States, Canada, Mexico)
- Europe (Germany, France, United Kingdom, Spain, Italy, Others)
- Asia Pacific (China, India, Japan, South Korea, Australia, Others)
- Latin America (Brazil, Argentina, Others)
- Middle East and Africa (Saudi Arabia, UAE, Kuwait, Other Middle East, South Africa, Nigeria, Other Africa)
Camellia Oil Market Companies
- Waltt Products Co Ltd (China)
- Laozhiqing (China)
- Wilmar International Limited (Singapore)
- Valera (United States)
- Jinhao (China)
- Shanrun (China)
- Sim Lang (China)
- Runxinoil (China)
- Guitaitai (China)
- Acemeliai (Spain)
*List not exhaustive
Camellia Oil Market Outlook 2023
1 Market Overview
1.1 Introduction to the Camellia Oil Market
1.2 Scope of the Study
1.3 Research Objective
1.3.1 Key Market Scope and Segments
1.3.2 Players Covered
1.3.3 Years Considered
2 Executive Summary
2.1 2023 Camellia Oil Industry- Market Statistics
3 Market Dynamics
3.1 Market Drivers
3.2 Market Challenges
3.3 Market Opportunities
3.4 Market Trends
4 Market Factor Analysis
4.1 Porter’s Five Forces
4.2 Market Entropy
4.2.1 Global Camellia Oil Market Companies with Area Served
4.2.2 Products Offerings Global Camellia Oil Market
5 COVID-19 Impact Analysis and Outlook Scenarios
5.1.1 Covid-19 Impact Analysis
5.1.2 post-COVID-19 Scenario- Low Growth Case
5.1.3 post-COVID-19 Scenario- Reference Growth Case
5.1.4 post-COVID-19 Scenario- Low Growth Case
6 Global Camellia Oil Market Trends
6.1 Global Camellia Oil Revenue (USD Million) and CAGR (%) by Type (2018-2030)
6.2 Global Camellia Oil Revenue (USD Million) and CAGR (%) by Applications (2018-2030)
6.3 Global Camellia Oil Revenue (USD Million) and CAGR (%) by regions (2018-2030)
7 Global Camellia Oil Market Revenue (USD Million) by Type, and Applications (2018-2022)
7.1 Global Camellia Oil Revenue (USD Million) by Type (2018-2022)
7.1.1 Global Camellia Oil Revenue (USD Million), Market Share (%) by Type (2018-2022)
7.2 Global Camellia Oil Revenue (USD Million) by Applications (2018-2022)
7.2.1 Global Camellia Oil Revenue (USD Million), Market Share (%) by Applications (2018-2022)
8 Global Camellia Oil Development Regional Status and Outlook
8.1 Global Camellia Oil Revenue (USD Million) By Regions (2018-2022)
8.2 North America Camellia Oil Revenue (USD Million) by Type, and Application (2018-2022)
8.2.1 North America Camellia Oil Revenue (USD Million) by Country (2018-2022)
8.2.2 North America Camellia Oil Revenue (USD Million) by Type (2018-2022)
8.2.3 North America Camellia Oil Revenue (USD Million) by Applications (2018-2022)
8.3 Europe Camellia Oil Revenue (USD Million), by Type, and Applications (USD Million) (2018-2022)
8.3.1 Europe Camellia Oil Revenue (USD Million), by Country (2018-2022)
8.3.2 Europe Camellia Oil Revenue (USD Million) by Type (2018-2022)
8.3.3 Europe Camellia Oil Revenue (USD Million) by Applications (2018-2022)
8.4 Asia Pacific Camellia Oil Revenue (USD Million), and Revenue (USD Million) by Type, and Applications (2018-2022)
8.4.1 Asia Pacific Camellia Oil Revenue (USD Million) by Country (2018-2022)
8.4.2 Asia Pacific Camellia Oil Revenue (USD Million) by Type (2018-2022)
8.4.3 Asia Pacific Camellia Oil Revenue (USD Million) by Applications (2018-2022)
8.5 South America Camellia Oil Revenue (USD Million), by Type, and Applications (2018-2022)
8.5.1 South America Camellia Oil Revenue (USD Million), by Country (2018-2022)
8.5.2 South America Camellia Oil Revenue (USD Million) by Type (2018-2022)
8.5.3 South America Camellia Oil Revenue (USD Million) by Applications (2018-2022)
8.6 Middle East and Africa Camellia Oil Revenue (USD Million), by Type, Technology, Application, Thickness (2018-2022)
8.6.1 Middle East and Africa Camellia Oil Revenue (USD Million) by Country (2018-2022)
8.6.2 Middle East and Africa Camellia Oil Revenue (USD Million) by Type (2018-2022)
8.6.3 Middle East and Africa Camellia Oil Revenue (USD Million) by Applications (2018-2022)
9 Company Profiles
10 Global Camellia Oil Market Revenue (USD Million), by Type, and Applications (2023-2030)
10.1 Global Camellia Oil Revenue (USD Million) and Market Share (%) by Type (2023-2030)
10.1.1 Global Camellia Oil Revenue (USD Million), and Market Share (%) by Type (2023-2030)
10.2 Global Camellia Oil Revenue (USD Million) and Market Share (%) by Applications (2023-2030)
10.2.1 Global Camellia Oil Revenue (USD Million), and Market Share (%) by Applications (2023-2030)
11 Global Camellia Oil Development Regional Status and Outlook Forecast
11.1 Global Camellia Oil Revenue (USD Million) By Regions (2023-2030)
11.2 North America Camellia Oil Revenue (USD Million) by Type, and Applications (2023-2030)
11.2.1 North America Camellia Oil Revenue (USD) Million by Country (2023-2030)
11.2.2 North America Camellia Oil Revenue (USD Million), by Type (2023-2030)
11.2.3 North America Camellia Oil Revenue (USD Million), Market Share (%) by Applications (2023-2030)
11.3 Europe Camellia Oil Revenue (USD Million), by Type, and Applications (2023-2030)
11.3.1 Europe Camellia Oil Revenue (USD Million), by Country (2023-2030)
11.3.2 Europe Camellia Oil Revenue (USD Million), by Type (2023-2030)
11.3.3 Europe Camellia Oil Revenue (USD Million), by Applications (2023-2030)
11.4 Asia Pacific Camellia Oil Revenue (USD Million) by Type, and Applications (2023-2030)
11.4.1 Asia Pacific Camellia Oil Revenue (USD Million), by Country (2023-2030)
11.4.2 Asia Pacific Camellia Oil Revenue (USD Million), by Type (2023-2030)
11.4.3 Asia Pacific Camellia Oil Revenue (USD Million), by Applications (2023-2030)
11.5 South America Camellia Oil Revenue (USD Million), by Type, and Applications (2023-2030)
11.5.1 South America Camellia Oil Revenue (USD Million), by Country (2023-2030)
11.5.2 South America Camellia Oil Revenue (USD Million), by Type (2023-2030)
11.5.3 South America Camellia Oil Revenue (USD Million), by Applications (2023-2030)
11.6 Middle East and Africa Camellia Oil Revenue (USD Million), by Type, and Applications (2023-2030)
11.6.1 Middle East and Africa Camellia Oil Revenue (USD Million), by region (2023-2030)
11.6.2 Middle East and Africa Camellia Oil Revenue (USD Million), by Type (2023-2030)
11.6.3 Middle East and Africa Camellia Oil Revenue (USD Million), by Applications (2023-2030)
12 Methodology and Data Sources
12.1 Methodology/Research Approach
12.1.1 Research Programs/Design
12.1.2 Market Size Estimation
12.1.3 Market Breakdown and Data Triangulation
12.2 Data Sources
12.2.1 Secondary Sources
12.2.2 Primary Sources
12.3 Disclaimer
List of Tables
Table 1 Market Segmentation Analysis
Table 2 Global Camellia Oil Market Companies with Areas Served
Table 3 Products Offerings Global Camellia Oil Market
Table 4 Low Growth Scenario Forecasts
Table 5 Reference Case Growth Scenario
Table 6 High Growth Case Scenario
Table 7 Global Camellia Oil Revenue (USD Million) And CAGR (%) By Type (2018-2030)
Table 8 Global Camellia Oil Revenue (USD Million) And CAGR (%) By Applications (2018-2030)
Table 9 Global Camellia Oil Revenue (USD Million) And CAGR (%) By Regions (2018-2030)
Table 10 Global Camellia Oil Revenue (USD Million) By Type (2018-2022)
Table 11 Global Camellia Oil Revenue Market Share (%) By Type (2018-2022)
Table 12 Global Camellia Oil Revenue (USD Million) By Applications (2018-2022)
Table 13 Global Camellia Oil Revenue Market Share (%) By Applications (2018-2022)
Table 14 Global Camellia Oil Market Revenue (USD Million) By Regions (2018-2022)
Table 15 Global Camellia Oil Market Share (%) By Regions (2018-2022)
Table 16 North America Camellia Oil Revenue (USD Million) By Country (2018-2022)
Table 17 North America Camellia Oil Revenue (USD Million) By Type (2018-2022)
Table 18 North America Camellia Oil Revenue (USD Million) By Applications (2018-2022)
Table 19 Europe Camellia Oil Revenue (USD Million) By Country (2018-2022)
Table 20 Europe Camellia Oil Revenue (USD Million) By Type (2018-2022)
Table 21 Europe Camellia Oil Revenue (USD Million) By Applications (2018-2022)
Table 22 Asia Pacific Camellia Oil Revenue (USD Million) By Country (2018-2022)
Table 23 Asia Pacific Camellia Oil Revenue (USD Million) By Type (2018-2022)
Table 24 Asia Pacific Camellia Oil Revenue (USD Million) By Applications (2018-2022)
Table 25 South America Camellia Oil Revenue (USD Million) By Country (2018-2022)
Table 26 South America Camellia Oil Revenue (USD Million) By Type (2018-2022)
Table 27 South America Camellia Oil Revenue (USD Million) By Applications (2018-2022)
Table 28 Middle East and Africa Camellia Oil Revenue (USD Million) By Region (2018-2022)
Table 29 Middle East and Africa Camellia Oil Revenue (USD Million) By Type (2018-2022)
Table 30 Middle East and Africa Camellia Oil Revenue (USD Million) By Applications (2018-2022)
Table 31 Financial Analysis
Table 32 Global Camellia Oil Revenue (USD Million) By Type (2023-2030)
Table 33 Global Camellia Oil Revenue Market Share (%) By Type (2023-2030)
Table 34 Global Camellia Oil Revenue (USD Million) By Applications (2023-2030)
Table 35 Global Camellia Oil Revenue Market Share (%) By Applications (2023-2030)
Table 36 Global Camellia Oil Market Revenue (USD Million), And Revenue (USD Million) By Regions (2023-2030)
Table 37 North America Camellia Oil Revenue (USD)By Country (2023-2030)
Table 38 North America Camellia Oil Revenue (USD Million) By Type (2023-2030)
Table 39 North America Camellia Oil Revenue (USD Million) By Applications (2023-2030)
Table 40 Europe Camellia Oil Revenue (USD Million) By Country (2023-2030)
Table 41 Europe Camellia Oil Revenue (USD Million) By Type (2023-2030)
Table 42 Europe Camellia Oil Revenue (USD Million) By Applications (2023-2030)
Table 43 Asia Pacific Camellia Oil Revenue (USD Million) By Country (2023-2030)
Table 44 Asia Pacific Camellia Oil Revenue (USD Million) By Type (2023-2030)
Table 45 Asia Pacific Camellia Oil Revenue (USD Million) By Applications (2023-2030)
Table 46 South America Camellia Oil Revenue (USD Million) By Country (2023-2030)
Table 47 South America Camellia Oil Revenue (USD Million) By Type (2023-2030)
Table 48 South America Camellia Oil Revenue (USD Million) By Applications (2023-2030)
Table 49 Middle East and Africa Camellia Oil Revenue (USD Million) By Region (2023-2030)
Table 50 Middle East and Africa Camellia Oil Revenue (USD Million) By Region (2023-2030)
Table 51 Middle East and Africa Camellia Oil Revenue (USD Million) By Type (2023-2030)
Table 52 Middle East and Africa Camellia Oil Revenue (USD Million) By Applications (2023-2030)
Table 53 Research Programs/Design for This Report
Table 54 Key Data Information from Secondary Sources
Table 55 Key Data Information from Primary Sources
List of Figures
Figure 1 Market Scope
Figure 2 Porter’s Five Forces
Figure 3 Global Camellia Oil Revenue (USD Million) By Type (2018-2022)
Figure 4 Global Camellia Oil Revenue Market Share (%) By Type (2022)
Figure 5 Global Camellia Oil Revenue (USD Million) By Applications (2018-2022)
Figure 6 Global Camellia Oil Revenue Market Share (%) By Applications (2022)
Figure 7 Global Camellia Oil Market Revenue (USD Million) By Regions (2018-2022)
Figure 8 Global Camellia Oil Market Share (%) By Regions (2022)
Figure 9 North America Camellia Oil Revenue (USD Million) By Country (2018-2022)
Figure 10 North America Camellia Oil Revenue (USD Million) By Type (2018-2022)
Figure 11 North America Camellia Oil Revenue (USD Million) By Applications (2018-2022)
Figure 12 Europe Camellia Oil Revenue (USD Million) By Country (2018-2022)
Figure 13 Europe Camellia Oil Revenue (USD Million) By Type (2018-2022)
Figure 14 Europe Camellia Oil Revenue (USD Million) By Applications (2018-2022)
Figure 15 Asia Pacific Camellia Oil Revenue (USD Million) By Country (2018-2022)
Figure 16 Asia Pacific Camellia Oil Revenue (USD Million) By Type (2018-2022)
Figure 17 Asia Pacific Camellia Oil Revenue (USD Million) By Applications (2018-2022)
Figure 18 South America Camellia Oil Revenue (USD Million) By Country (2018-2022)
Figure 19 South America Camellia Oil Revenue (USD Million) By Type (2018-2022)
Figure 20 South America Camellia Oil Revenue (USD Million) By Applications (2018-2022)
Figure 21 Middle East and Africa Camellia Oil Revenue (USD Million) By Region (2018-2022)
Figure 22 Middle East and Africa Camellia Oil Revenue (USD Million) By Type (2018-2022)
Figure 23 Middle East and Africa Camellia Oil Revenue (USD Million) By Applications (2018-2022)
Figure 24 Global Camellia Oil Revenue (USD Million) By Type (2023-2030)
Figure 25 Global Camellia Oil Revenue Market Share (%) By Type (2030)
Figure 26 Global Camellia Oil Revenue (USD Million) By Applications (2023-2030)
Figure 27 Global Camellia Oil Revenue Market Share (%) By Applications (2030)
Figure 28 Global Camellia Oil Market Revenue (USD Million) By Regions (2023-2030)
Figure 29 North America Camellia Oil Revenue (USD Million) By Country (2023-2030)
Figure 30 North America Camellia Oil Revenue (USD Million) By Type (2023-2030)
Figure 31 North America Camellia Oil Revenue (USD Million) By Applications (2023-2030)
Figure 32 Europe Camellia Oil Revenue (USD Million) By Country (2023-2030)
Figure 33 Europe Camellia Oil Revenue (USD Million) By Type (2023-2030)
Figure 34 Europe Camellia Oil Revenue (USD Million) By Applications (2023-2030)
Figure 35 Asia Pacific Camellia Oil Revenue (USD Million) By Country (2023-2030)
Figure 36 Asia Pacific Camellia Oil Revenue (USD Million) By Type (2023-2030)
Figure 37 Asia Pacific Camellia Oil Revenue (USD Million) By Applications (2023-2030)
Figure 38 South America Camellia Oil Revenue (USD Million) By Country (2023-2030)
Figure 39 South America Camellia Oil Revenue (USD Million) By Type (2023-2030)
Figure 40 South America Camellia Oil Revenue (USD Million) By Applications (2023-2030)
Figure 41 Middle East and Africa Camellia Oil Revenue (USD Million) By Region (2023-2030)
Figure 42 Middle East and Africa Camellia Oil Revenue (USD Million) By Region (2023-2030)
Figure 43 Middle East and Africa Camellia Oil Revenue (USD Million) By Type (2023-2030)
Figure 44 Middle East and Africa Camellia Oil Revenue (USD Million) By Applications (2023-2030)
Figure 45 Bottom-Up and Top-Down Approaches for This Report
Figure 46 Data Triangulation
