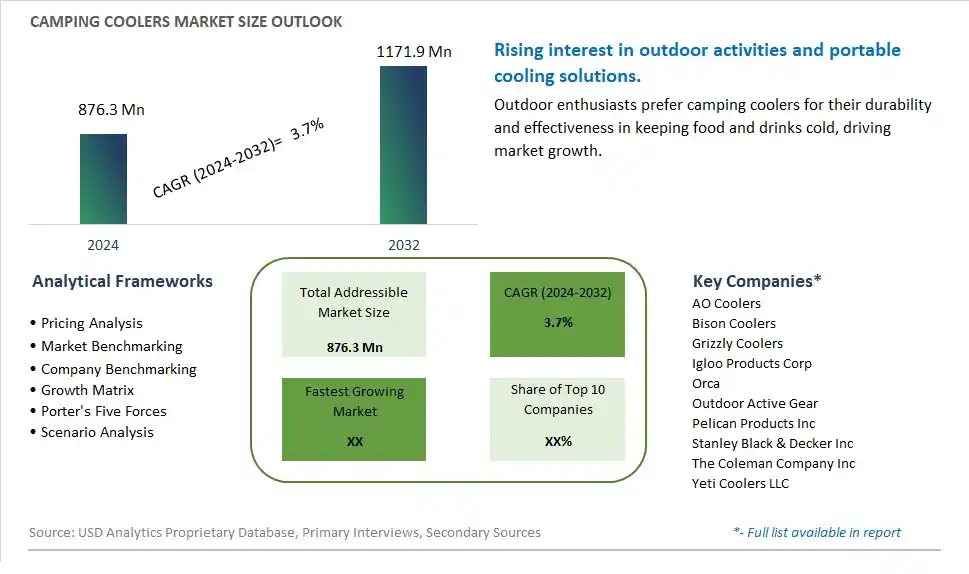
Global Camping Coolers Market Size is valued at $876.3 Million in 2024 and is forecast to register a growth rate (CAGR) of 3.7% to reach $1171.9 Million by 2032.
The global Camping Coolers Market Comprehensive Study analyzes and forecasts the market size across 6 regions and 24 countries for diverse segments -By Volume (Below 25 quart, 25 to 50 quart, 50 to 75 quart, 75 to 100 quart, Above 100 quart), By Product (Hard cooler, Soft cooler, Others), By Application (Dry camping, Backpacking, Off-road/RV camping, Others)
An Introduction to Camping Coolers Market
In 2024, the Camping Coolers market is experiencing robust growth, driven by the increasing popularity of outdoor activities and recreational travel. Camping coolers, essential for keeping food and beverages cold, are favored for their durability, portability, and advanced cooling technologies. The market is supported by innovations in materials and design that enhance insulation, capacity, and convenience. Advances in cooler technology, such as battery-powered cooling systems and eco-friendly insulation materials, are also contributing to market expansion. The growing trend towards camping, hiking, and outdoor adventures is driving demand for high-quality, reliable coolers that cater to a wide range of outdoor enthusiasts.
Camping Coolers Competitive Landscape
The market report analyses the leading companies in the industry including AO Coolers, Bison Coolers, Grizzly Coolers, Igloo Products Corp, Orca, Outdoor Active Gear, Pelican Products Inc, Stanley Black & Decker Inc, The Coleman Company Inc, Yeti Coolers LLC, and Others.
Camping Coolers Market Dynamics
Camping Coolers Market Trend: Growing Interest in Outdoor Activities
One prominent market trend for Camping Coolers is the growing interest in outdoor activities and recreational adventures. As more people seek opportunities to explore nature, engage in camping trips, and participate in outdoor events, the demand for reliable and high-performance coolers for food and beverage storage increases. Consumers prioritize durable, portable, and efficient cooling solutions that can withstand rugged outdoor environments while keeping their food and drinks fresh and safe.
Camping Coolers Market Driver: Innovation in Cooler Technology
The market driver for Camping Coolers is continuous innovation in cooler technology, leading to the development of advanced features and functionalities. Manufacturers are focusing on enhancing insulation capabilities, improving durability, incorporating eco-friendly materials, and introducing smart features such as integrated Bluetooth speakers or solar-powered options. These innovations not only enhance the user experience but also cater to the evolving needs of outdoor enthusiasts who seek convenience and versatility in their camping gear.
Camping Coolers Market Opportunity: Eco-Friendly and Sustainable Coolers
An opportunity within the Camping Coolers market lies in the demand for eco-friendly and sustainable cooling solutions. With increasing environmental consciousness among consumers, there is a growing preference for coolers made from recycled materials, biodegradable components, or those designed for long-term durability to reduce waste. Companies that emphasize sustainability in their cooler designs and manufacturing processes can appeal to environmentally conscious consumers and capitalize on the eco-friendly trend in outdoor gear.
Camping Coolers Market Share Analysis: 25 to 50 Quart Volume segment generated the highest revenue share in the industry
The largest segment in the Camping Coolers Market is the 25 to 50 quart volume category. This segment encompasses camping coolers that offer a mid-range storage capacity, making them versatile and popular among a wide range of outdoor enthusiasts. The 25 to 50 quart coolers strike a balance between size and portability, catering to the needs of both solo campers and small groups or families. They are ideal for weekend camping trips, picnics, tailgating events, and other outdoor activities where a moderate amount of food and beverages needs to be kept cool for extended periods. The popularity of this segment can be attributed to its convenience, as these coolers are often compact enough to fit in vehicles yet spacious enough to hold a sufficient amount of supplies. Additionally, advancements in insulation technologies and durable construction materials have enhanced the performance and durability of coolers within this volume range, further driving their demand among outdoor enthusiasts seeking reliable and efficient cooling solutions for their adventures.
Camping Coolers Market Share Analysis: Soft Cooler is the fastest growing segment over the forecast period to 2032
The fastest-growing segment in the Camping Coolers Market is the Soft Cooler category. Soft coolers have been experiencing rapid growth due to several key factors. Firstly, their lightweight and flexible design make them highly portable and easy to transport, appealing to outdoor enthusiasts who prioritize mobility and convenience. Soft coolers are also versatile, as they can be easily carried on hiking trips, fishing excursions, beach outings, and various outdoor activities. Additionally, advancements in insulation technology have significantly improved the cooling performance of soft coolers, allowing them to maintain temperatures for extended periods, similar to their hard cooler counterparts. Another contributing factor to their growth is the increasing demand for eco-friendly and sustainable products. Soft coolers are often made from materials that are more environmentally friendly than traditional hard coolers, attracting environmentally conscious consumers. Overall, the combination of portability, versatility, improved performance, and eco-friendliness positions soft coolers as a fast-growing and popular choice in the Camping Coolers Market.
Camping Coolers Market Share Analysis: Off-road/RV Camping segment generated the highest revenue share in the industry
The largest segment in the Camping Coolers Market is Off-road/RV Camping. This segment encompasses a wide range of outdoor enthusiasts, including campers who prefer exploring remote areas, off-road adventurers, and recreational vehicle (RV) travelers. Off-road/RV camping requires durable and reliable coolers to keep food and beverages fresh during extended trips in rugged terrain or remote locations where access to amenities may be limited. These coolers need to withstand rough handling, varying weather conditions, and maintain cooling efficiency for extended periods. As the popularity of off-road adventures and RV camping continues to grow, the demand for high-quality camping coolers tailored to these specific needs has also increased significantly. Manufacturers have responded by introducing innovative features such as rugged construction, superior insulation, and convenient storage options to cater to the unique requirements of off-road/RV camping enthusiasts. Consequently, the Off-road/RV Camping segment has emerged as the largest and most influential segment in the Camping Coolers Market, driving innovation and shaping product development in the industry.
Camping Coolers Market Segmentation
By Volume
Below 25 quart
25 to 50 quart
50 to 75 quart
75 to 100 quart
Above 100 quart
By Product
Hard cooler
Soft cooler
Others
By Application
Dry camping
Backpacking
Off-road/RV camping
Others
Countries Analyzed
North America (US, Canada, Mexico)
Europe (Germany, UK, France, Spain, Italy, Russia, Rest of Europe)
Asia Pacific (China, India, Japan, South Korea, Australia, South East Asia, Rest of Asia)
South America (Brazil, Argentina, Rest of South America)
Middle East and Africa (Saudi Arabia, UAE, Rest of Middle East, South Africa, Egypt, Rest of Africa)
Camping Coolers Companies Profiled in the Study
AO Coolers
Bison Coolers
Grizzly Coolers
Igloo Products Corp
Orca
Outdoor Active Gear
Pelican Products Inc
Stanley Black & Decker Inc
The Coleman Company Inc
Yeti Coolers LLC
*- List Not Exhaustive
Chapter 1. TABLE OF CONTENTS
Chapter 2. Introduction to Camping Coolers Market
2.1. Market Overview
2.2. Key Statistics and Report Highlights
2.3. Scope of the Comprehensive Study
2.3.1. Market Definition
2.3.2 Countries and Regions Covered
2.3.3 Research Objective
2.3.4 Units, Currency, and Conversions
2.3.5 Industry Value Chain
2.4. Key Market Segments
2.5. Key Companies
2.6. Study Period
Chapter 3. Strategic Analysis Review
3.1. Camping Coolers Pricing Analysis and Forecast
3.2. Porter’s Five Forces
3.3. Market Ecosystem
3.4. SWOT Analysis
3.5. Regulatory Scenario
3.3. Effects of Inflation, Russia-Ukraine War, moderating economic growth, and other macroeconomic factors
Chapter 4. Competitive Landscape
4.1. Market Share Analysis
4.1.1. Global Camping Coolers Market Share by Company, 2023
4.1.2. Product Offerings of Leading Camping Coolers Companies
4.2. Market Entropy
4.2.1. New Product Launches in the Industry
4.2.2. Mergers, Acquisitions, Joint ventures, and Partnerships
4.3. Key Strategies and Best Practices
Chapter 5. Global Market Projections: Best, Reference, and Low Case Scenarios
5.1. Growth Analysis- Case Scenario Definitions
5.2. Low Growth Case Scenario Forecasts
5.3. Reference Growth Case Scenario Forecasts
5.4. High Growth Case Scenario Forecasts
Chapter 6. Market Dynamics
6.1. Camping Coolers Market Drivers
6.2. Camping Coolers Market Challenges
6.6. Camping Coolers Market Opportunities
6.4. Camping Coolers Market Trends
Chapter 7. Global Camping Coolers Market Outlook Trends
7.1. Global Camping Coolers Revenue (USD Million) and CAGR (%) by Type (2021-2032)
7.2. Global Camping Coolers Revenue (USD Million) and CAGR (%) by Application (2021-2032)
7.3. Global Camping Coolers Revenue (USD Million) and CAGR (%) by Product (2021-2032)
By Volume
Below 25 quart
25 to 50 quart
50 to 75 quart
75 to 100 quart
Above 100 quart
By Product
Hard cooler
Soft cooler
Others
By Application
Dry camping
Backpacking
Off-road/RV camping
Others
Chapter 8. Global Camping Coolers Regional Analysis and Outlook
8.1. Global Camping Coolers Revenue (USD Million) By Regions (2021- 2032)
8.2. North America Camping Coolers Revenue (USD Million) by Country (2021-2032)
8.2.1. United States Camping Coolers Regional Analysis and Outlook
8.2.2. Canada Camping Coolers Regional Analysis and Outlook
8.2.3. Mexico Camping Coolers Regional Analysis and Outlook
8.3. Europe Camping Coolers Revenue (USD Million), by Country (2021-2032)
8.3.1. Germany Camping Coolers Regional Analysis and Outlook
8.3.2. France Camping Coolers Regional Analysis and Outlook
8.3.3. United Kingdom Camping Coolers Regional Analysis and Outlook
8.3.4. Spain Camping Coolers Regional Analysis and Outlook
8.3.5. Italy Camping Coolers Regional Analysis and Outlook
8.3.6. Russia Camping Coolers Regional Analysis and Outlook
8.3.7. Rest of Europe Camping Coolers Regional Analysis and Outlook
8.4. Asia Pacific Camping Coolers Revenue (USD Million) by Country (2021-2032)
8.4.1. China Camping Coolers Regional Analysis and Outlook
8.4.2. Japan Camping Coolers Regional Analysis and Outlook
8.4.3. India Camping Coolers Regional Analysis and Outlook
8.4.4. South Korea Camping Coolers Regional Analysis and Outlook
8.4.5. Australia Camping Coolers Regional Analysis and Outlook
8.4.6. South East Asia Camping Coolers Regional Analysis and Outlook
8.4.7. Rest of Asia Pacific Camping Coolers Regional Analysis and Outlook
8.5. South America Camping Coolers Revenue (USD Million), by Country (2021-2032)
8.5.1. Brazil Camping Coolers Regional Analysis and Outlook
8.5.2. Argentina Camping Coolers Regional Analysis and Outlook
8.5.3. Rest of South America Camping Coolers Regional Analysis and Outlook
8.6. Middle East and Africa Camping Coolers Revenue (USD Million) by Country (2021-2032)
8.6.1. Middle East Camping Coolers Regional Analysis and Outlook
8.6.2. Africa Camping Coolers Regional Analysis and Outlook
Chapter 9. North America Camping Coolers Analysis and Outlook
9.1. North America Camping Coolers Revenue (USD Million) by Segments (2021-2032)
9.1.1. North America Camping Coolers Revenue (USD Million) by Type (2021-2032)
9.1.2. North America Camping Coolers Revenue (USD Million) by Application (2021-2032)
9.1.3. North America Camping Coolers Revenue (USD Million) by Product (2021-2032)
By Volume
Below 25 quart
25 to 50 quart
50 to 75 quart
75 to 100 quart
Above 100 quart
By Product
Hard cooler
Soft cooler
Others
By Application
Dry camping
Backpacking
Off-road/RV camping
Others
Chapter 10. Europe Camping Coolers Analysis and Outlook
10.1. Europe Camping Coolers Revenue (USD Million), by Segments (USD Million) (2021-2032)
10.1.1. Europe Camping Coolers Revenue (USD Million) by Type (2021-2032)
10.1.2. Europe Camping Coolers Revenue (USD Million) by Application (2021-2032)
10.1.3. Europe Camping Coolers Revenue (USD Million) by Product (2021-2032)
By Volume
Below 25 quart
25 to 50 quart
50 to 75 quart
75 to 100 quart
Above 100 quart
By Product
Hard cooler
Soft cooler
Others
By Application
Dry camping
Backpacking
Off-road/RV camping
Others
Chapter 11. Asia Pacific Camping Coolers Analysis and Outlook
11.1. Asia Pacific Camping Coolers Revenue (USD Million), and Revenue (USD Million) by Segments (2021-2032)
11.1.1. Asia Pacific Camping Coolers Revenue (USD Million) by Type (2021-2032)
11.1.2. Asia Pacific Camping Coolers Revenue (USD Million) by Application (2021-2032)
11.1.3. Asia Pacific Camping Coolers Revenue (USD Million) by Product (2021-2032)
By Volume
Below 25 quart
25 to 50 quart
50 to 75 quart
75 to 100 quart
Above 100 quart
By Product
Hard cooler
Soft cooler
Others
By Application
Dry camping
Backpacking
Off-road/RV camping
Others
Chapter 12. South America Camping Coolers Analysis and Outlook
12.1. South America Camping Coolers Revenue (USD Million), by Segments (2021-2032)
12.1.1. South America Camping Coolers Revenue (USD Million) by Type (2021-2032)
12.1.2. South America Camping Coolers Revenue (USD Million) by Application (2021-2032)
12.1.3. South America Camping Coolers Revenue (USD Million) by Product (2021-2032)
By Volume
Below 25 quart
25 to 50 quart
50 to 75 quart
75 to 100 quart
Above 100 quart
By Product
Hard cooler
Soft cooler
Others
By Application
Dry camping
Backpacking
Off-road/RV camping
Others
Chapter 13. Middle East and Africa Camping Coolers Analysis and Outlook
13.1. Middle East and Africa Camping Coolers Revenue (USD Million), by Segments (2021-2032)
13.1.1. Middle East and Africa Camping Coolers Revenue (USD Million) by Type (2021-2032)
13.1.2. Middle East and Africa Camping Coolers Revenue (USD Million) by Application (2021-2032)
13.1.3. Middle East and Africa Camping Coolers Revenue (USD Million) by Product (2021-2032)
By Volume
Below 25 quart
25 to 50 quart
50 to 75 quart
75 to 100 quart
Above 100 quart
By Product
Hard cooler
Soft cooler
Others
By Application
Dry camping
Backpacking
Off-road/RV camping
Others
Chapter 14. Camping Coolers Company Profiles
14.1 Business Overview
14.2 Product Profiles
14.3 SWOT Profiles
14.5 Recent Developments
14.6 Financial Profile
List of Companies
AO Coolers
Bison Coolers
Grizzly Coolers
Igloo Products Corp
Orca
Outdoor Active Gear
Pelican Products Inc
Stanley Black & Decker Inc
The Coleman Company Inc
Yeti Coolers LLC
15. Methodology and Data Sources
15.1 Customization Offerings
15.2 Subscription Services
15.3 Related Reports
15.4 Publisher Expertise
LIST OF TABLES
Table 1 Market Segmentation Analysis
Table 2 Global Camping Coolers Market Share of Leading Companies, 2023
Table 3 Product Offerings of Leading Companies
Table 4 Low Growth Scenario Forecasts
Table 5 Reference Case Growth Scenario
Table 6 High Growth Case Scenario
Table 7 Global Camping Coolers Revenue (USD Million) And CAGR (%) By Type (2021-2032)
Table 8 Global Camping Coolers Revenue (USD Million) And CAGR (%) By Application (2021-2032)
Table 9 Global Camping Coolers Revenue (USD Million) And CAGR (%) By Product (2021-2032)
Table 10 Global Camping Coolers Market Revenue (USD Million) By Regions (2021-2032)
Table 11 Global Camping Coolers Market Share (%) By Regions (2021-2032)
Table 12 North America Camping Coolers Revenue (USD Million) By Country (2021-2032)
Table 13 Europe Camping Coolers Revenue (USD Million) By Country (2021-2032)
Table 14 Asia Pacific Camping Coolers Revenue (USD Million) By Country (2021-2032)
Table 15 South America Camping Coolers Revenue (USD Million) By Country (2021-2032)
Table 16 Middle East and Africa Camping Coolers Revenue (USD Million) By Region (2021-2032)
Table 17 North America Camping Coolers Revenue (USD Million) By Type (2021-2032)
Table 18 North America Camping Coolers Revenue (USD Million) By Application (2021-2032)
Table 19 North America Camping Coolers Revenue (USD Million) By Product (2021-2032)
Table 20 Europe Camping Coolers Revenue (USD Million) By Type (2021-2032)
Table 21 Europe Camping Coolers Revenue (USD Million) By Application (2021-2032)
Table 22 Europe Camping Coolers Revenue (USD Million) By Product (2021-2032)
Table 23 Asia Pacific Camping Coolers Revenue (USD Million) By Type (2021-2032)
Table 24 Asia Pacific Camping Coolers Revenue (USD Million) By Application (2021-2032)
Table 25 Asia Pacific Camping Coolers Revenue (USD Million) By Product (2021-2032)
Table 26 South America Camping Coolers Revenue (USD Million) By Type (2021-2032)
Table 27 South America Camping Coolers Revenue (USD Million) By Application (2021-2032)
Table 28 South America Camping Coolers Revenue (USD Million) By Product (2021-2032)
Table 29 Middle East and Africa Camping Coolers Revenue (USD Million) By Type (2021-2032)
Table 30 Middle East and Africa Camping Coolers Revenue (USD Million) By Application (2021-2032)
Table 31 Middle East and Africa Camping Coolers Revenue (USD Million) By Product (2021-2032)
LIST OF FIGURES
Figure 1. Market Scope
Figure 2. Pricing Forecasts Per Unit, 2023- 2032
Figure 3. Porter’s Five Forces
Figure 4. Global Camping Coolers Market Revenue (USD Million) By Regions (2021-2032)
Figure 5. Global Camping Coolers Market Share (%) By Regions (2023)
Figure 6. North America Camping Coolers Revenue (USD Million) By Country (2021-2032)
Figure 7. United States Camping Coolers Revenue (USD Million) By Country (2021-2032)
Figure 8. Canada Camping Coolers Revenue (USD Million) By Country (2021-2032)
Figure 9. Mexico Camping Coolers Revenue (USD Million) By Country (2021-2032)
Figure 10. Europe Camping Coolers Revenue (USD Million) By Country (2021-2032)
Figure 11. Germany Camping Coolers Revenue (USD Million) By Country (2021-2032)
Figure 12. France Camping Coolers Revenue (USD Million) By Country (2021-2032)
Figure 13. United Kingdom Camping Coolers Revenue (USD Million) By Country (2021-2032)
Figure 14. Spain Camping Coolers Revenue (USD Million) By Country (2021-2032)
Figure 15. Italy Camping Coolers Revenue (USD Million) By Country (2021-2032)
Figure 16. Russia Camping Coolers Revenue (USD Million) By Country (2021-2032)
Figure 17. Rest of Europe Camping Coolers Revenue (USD Million) By Country (2021-2032)
Figure 11. Asia Pacific Camping Coolers Revenue (USD Million) By Country (2021-2032)
Figure 12. China Camping Coolers Revenue (USD Million) By Country (2021-2032)
Figure 13. Japan Camping Coolers Revenue (USD Million) By Country (2021-2032)
Figure 14. India Camping Coolers Revenue (USD Million) By Country (2021-2032)
Figure 15. South Korea Camping Coolers Revenue (USD Million) By Country (2021-2032)
Figure 16. Australia Camping Coolers Revenue (USD Million) By Country (2021-2032)
Figure 17. South East Asia Camping Coolers Revenue (USD Million) By Country (2021-2032)
Figure 18. South America Camping Coolers Revenue (USD Million) By Country (2021-2032)
Figure 19. Brazil Camping Coolers Revenue (USD Million) By Country (2021-2032)
Figure 20. Argentina Camping Coolers Revenue (USD Million) By Country (2021-2032)
Figure 21. Rest of Asia Pacific Camping Coolers Revenue (USD Million) By Country (2021-2032)
Figure 22. Middle East and Africa Camping Coolers Revenue (USD Million) By Region (2021-2032)
Figure 23. Saudi Arabia Camping Coolers Revenue (USD Million) By Region (2021-2032)
Figure 24. The UAE Camping Coolers Revenue (USD Million) By Region (2021-2032)
Figure 25. Rest of Middle East Camping Coolers Revenue (USD Million) By Region (2021-2032)
Figure 26. South Africa Camping Coolers Revenue (USD Million) By Region (2021-2032)
Figure 27. Africa Camping Coolers Revenue (USD Million) By Region (2021-2032)
Figure 28. North America Camping Coolers Revenue (USD Million) By Type (2021-2032)
Figure 29. North America Camping Coolers Revenue (USD Million) By Application (2021-2032)
Figure 30. North America Camping Coolers Revenue (USD Million) By Product (2021-2032)
Figure 31. Europe Camping Coolers Revenue (USD Million) By Type (2021-2032)
Figure 32. Europe Camping Coolers Revenue (USD Million) By Application (2021-2032)
Figure 33. Europe Camping Coolers Revenue (USD Million) By Product (2021-2032)
Figure 34. Asia Pacific Camping Coolers Revenue (USD Million) By Type (2021-2032)
Figure 35. Asia Pacific Camping Coolers Revenue (USD Million) By Application (2021-2032)
Figure 36. Asia Pacific Camping Coolers Revenue (USD Million) By Product (2021-2032)
Figure 37. South America Camping Coolers Revenue (USD Million) By Type (2021-2032)
Figure 38. South America Camping Coolers Revenue (USD Million) By Application (2021-2032)
Figure 39. South America Camping Coolers Revenue (USD Million) By Product (2021-2032)
Figure 40. Middle East and Africa Camping Coolers Revenue (USD Million) By Type (2021-2032)
Figure 41. Middle East and Africa Camping Coolers Revenue (USD Million) By Application (2021-2032)
Figure 42. Middle East and Africa Camping Coolers Revenue (USD Million) By Product (2021-2032)
By Volume
Below 25 quart
25 to 50 quart
50 to 75 quart
75 to 100 quart
Above 100 quart
By Product
Hard cooler
Soft cooler
Others
By Application
Dry camping
Backpacking
Off-road/RV camping
Others
Countries Analyzed
North America (US, Canada, Mexico)
Europe (Germany, UK, France, Spain, Italy, Russia, Rest of Europe)
Asia Pacific (China, India, Japan, South Korea, Australia, South East Asia, Rest of Asia)
South America (Brazil, Argentina, Rest of South America)
Middle East and Africa (Saudi Arabia, UAE, Rest of Middle East, South Africa, Egypt, Rest of Africa)
