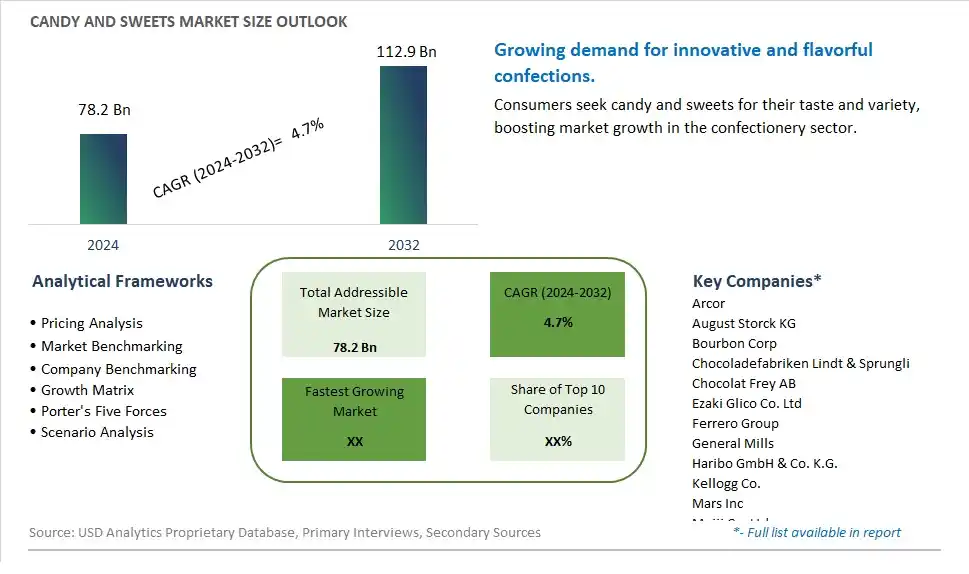
Global Candy and Sweets Market Size is valued at $78.2 Billion in 2024 and is forecast to register a growth rate (CAGR) of 4.7% to reach $112.9 Billion by 2032.
The global Candy and Sweets Market Comprehensive Study analyzes and forecasts the market size across 6 regions and 24 countries for diverse segments -By Type (Chocolate, Gummies, Hard Candies, Licorice, Lollipops, Others), By Distribution Channel (Supermarkets/Hypermarkets, Convenience Stores, Specialty Food Stores, Online, Others)
An Introduction to Candy and Sweets Market
In 2024, the Candy and Sweets market is witnessing significant growth, driven by the enduring consumer demand for indulgent and nostalgic treats. The market encompasses a wide range of products, including chocolates, gummies, hard candies, and confectioneries. The market is supported by innovations in flavor, texture, and packaging that cater to diverse consumer preferences. Advances in ingredient sourcing and production technologies are enhancing product quality and expanding the variety of offerings. The market is also benefiting from the trend towards premium, artisanal, and health-focused candies, appealing to consumers seeking both indulgence and quality in their sweet treats.
Candy and Sweets Competitive Landscape
The market report analyses the leading companies in the industry including Arcor, August Storck KG, Bourbon Corp, Chocoladefabriken Lindt & Sprungli, Chocolat Frey AB, Ezaki Glico Co. Ltd, Ferrero Group, General Mills, Haribo GmbH & Co. K.G., Kellogg Co., Mars Inc, Meiji Co. Ltd, Mondelez International Inc, Morinaga & Co. Ltd, Nestlé S.A., Orion Corp, Perfetti Van Melle, pladis, The Hershey Company, United Confectionary Manufacturers, and Others.
Candy and Sweets Market Dynamics
Candy and Sweets Market Trend: Innovation in Flavor and Ingredient Varieties
A prominent market trend in the candy and sweets industry is the continuous innovation in flavor profiles and ingredient varieties. Consumers are increasingly seeking unique and exotic taste experiences, driving candy manufacturers to explore new flavor combinations, natural ingredients, and indulgent textures. This trend includes the introduction of healthier options, such as sugar-free candies, as well as premium offerings with high-quality ingredients like organic chocolate and gourmet flavors, catering to diverse consumer preferences and evolving dietary trends.
Candy and Sweets Market Driver: Growing Demand for Convenience and On-the-Go Snacking
The market driver for candy and sweets is the growing demand for convenient and on-the-go snacking options. Busy lifestyles and a preference for portable indulgences have fueled the demand for single-serve packs, bite-sized candies, and grab-and-go formats. Candy brands are responding by developing packaging innovations that enhance convenience, freshness, and portion control, making it easier for consumers to enjoy their favorite treats anytime, anywhere.
Candy and Sweets Market Opportunity: Expansion into Functional and Healthier Candy Alternatives
An opportunity within the candy and sweets market lies in the expansion into functional and healthier candy alternatives. With a rising focus on health and wellness, there is a growing demand for candies that offer added nutritional benefits, such as fortified with vitamins, minerals, and functional ingredients like probiotics or plant extracts. Manufacturers can capitalize on this trend by developing innovative products that combine indulgence with health benefits, targeting health-conscious consumers seeking guilt-free indulgences and functional snacks. Additionally, opportunities exist in the development of allergen-free, organic, and natural candies to cater to specific dietary preferences and lifestyle choices, further expanding the market reach and consumer base.
Candy and Sweets Market Share Analysis: Chocolate segment generated the highest revenue share in the industry
In the Candy and Sweets Market, the largest segment is Chocolate. Chocolate products encompass a wide range of offerings, including milk chocolate, dark chocolate, white chocolate, and various flavored chocolates. The popularity of chocolate is driven by its widespread appeal across different age groups and consumer preferences. It serves as a versatile treat, suitable for indulgence, gifting, and incorporation into various desserts and confectionery items. Chocolate's enduring popularity is also attributed to its association with celebrations, holidays, and special occasions, further boosting its demand throughout the year. Further, the evolving consumer taste preferences have led to the introduction of innovative chocolate products, such as organic, sugar-free, and premium artisanal chocolates, catering to health-conscious consumers and connoisseurs seeking unique flavor experiences. As a result, the Chocolate segment maintains its position as the largest and most dynamic category within the Candy and Sweets Market, continually driving growth and innovation in the industry.
Candy and Sweets Market Share Analysis: Online is the fastest growing segment over the forecast period to 2032
The Candy and Sweets Market's fastest-growing segment is Online distribution channels. This growth is propelled by several key factors influencing consumer behavior and market dynamics. Firstly, the increasing digitalization and e-commerce penetration globally have facilitated greater convenience and accessibility for consumers to purchase confectionery products online. The convenience factor is particularly appealing to busy urban dwellers and tech-savvy consumers seeking hassle-free shopping experiences. Further, the Past few yearsaccelerated the shift towards online shopping, with lockdowns and social distancing measures prompting more consumers to explore online platforms for their confectionery needs. Additionally, online channels offer a vast array of choices, allowing consumers to compare prices, read reviews, and discover niche or artisanal candy brands that may not be readily available in physical stores. Furthermore, the convenience of doorstep delivery and the availability of discounts or promotions often make online platforms a preferred choice for purchasing candies and sweets. As a result, the Online distribution channel is expected to witness rapid growth and emerge as a dominant force in shaping the Candy and Sweets Market landscape by 2032.
Candy and Sweets Market Segmentation
By Type
Chocolate
Gummies
Hard Candies
Licorice
Lollipops
Others
By Distribution Channel
Supermarkets/Hypermarkets
Convenience Stores
Specialty Food Stores
Online
Others
Countries Analyzed
North America (US, Canada, Mexico)
Europe (Germany, UK, France, Spain, Italy, Russia, Rest of Europe)
Asia Pacific (China, India, Japan, South Korea, Australia, South East Asia, Rest of Asia)
South America (Brazil, Argentina, Rest of South America)
Middle East and Africa (Saudi Arabia, UAE, Rest of Middle East, South Africa, Egypt, Rest of Africa)
Candy and Sweets Companies Profiled in the Study
Arcor
August Storck KG
Bourbon Corp
Chocoladefabriken Lindt & Sprungli
Chocolat Frey AB
Ezaki Glico Co. Ltd
Ferrero Group
General Mills
Haribo GmbH & Co. K.G.
Kellogg Co.
Mars Inc
Meiji Co. Ltd
Mondelez International Inc
Morinaga & Co. Ltd
Nestlé S.A.
Orion Corp
Perfetti Van Melle
pladis
The Hershey Company
United Confectionary Manufacturers
*- List Not Exhaustive
Chapter 1. TABLE OF CONTENTS
Chapter 2. Introduction to Candy and Sweets Market
2.1. Market Overview
2.2. Key Statistics and Report Highlights
2.3. Scope of the Comprehensive Study
2.3.1. Market Definition
2.3.2 Countries and Regions Covered
2.3.3 Research Objective
2.3.4 Units, Currency, and Conversions
2.3.5 Industry Value Chain
2.4. Key Market Segments
2.5. Key Companies
2.6. Study Period
Chapter 3. Strategic Analysis Review
3.1. Candy and Sweets Pricing Analysis and Forecast
3.2. Porter’s Five Forces
3.3. Market Ecosystem
3.4. SWOT Analysis
3.5. Regulatory Scenario
3.3. Effects of Inflation, Russia-Ukraine War, moderating economic growth, and other macroeconomic factors
Chapter 4. Competitive Landscape
4.1. Market Share Analysis
4.1.1. Global Candy and Sweets Market Share by Company, 2023
4.1.2. Product Offerings of Leading Candy and Sweets Companies
4.2. Market Entropy
4.2.1. New Product Launches in the Industry
4.2.2. Mergers, Acquisitions, Joint ventures, and Partnerships
4.3. Key Strategies and Best Practices
Chapter 5. Global Market Projections: Best, Reference, and Low Case Scenarios
5.1. Growth Analysis- Case Scenario Definitions
5.2. Low Growth Case Scenario Forecasts
5.3. Reference Growth Case Scenario Forecasts
5.4. High Growth Case Scenario Forecasts
Chapter 6. Market Dynamics
6.1. Candy and Sweets Market Drivers
6.2. Candy and Sweets Market Challenges
6.6. Candy and Sweets Market Opportunities
6.4. Candy and Sweets Market Trends
Chapter 7. Global Candy and Sweets Market Outlook Trends
7.1. Global Candy and Sweets Revenue (USD Million) and CAGR (%) by Type (2021-2032)
7.2. Global Candy and Sweets Revenue (USD Million) and CAGR (%) by Application (2021-2032)
7.3. Global Candy and Sweets Revenue (USD Million) and CAGR (%) by Product (2021-2032)
By Type
Chocolate
Gummies
Hard Candies
Licorice
Lollipops
Others
By Distribution Channel
Supermarkets/Hypermarkets
Convenience Stores
Specialty Food Stores
Online
Others
Chapter 8. Global Candy and Sweets Regional Analysis and Outlook
8.1. Global Candy and Sweets Revenue (USD Million) By Regions (2021- 2032)
8.2. North America Candy and Sweets Revenue (USD Million) by Country (2021-2032)
8.2.1. United States Candy and Sweets Regional Analysis and Outlook
8.2.2. Canada Candy and Sweets Regional Analysis and Outlook
8.2.3. Mexico Candy and Sweets Regional Analysis and Outlook
8.3. Europe Candy and Sweets Revenue (USD Million), by Country (2021-2032)
8.3.1. Germany Candy and Sweets Regional Analysis and Outlook
8.3.2. France Candy and Sweets Regional Analysis and Outlook
8.3.3. United Kingdom Candy and Sweets Regional Analysis and Outlook
8.3.4. Spain Candy and Sweets Regional Analysis and Outlook
8.3.5. Italy Candy and Sweets Regional Analysis and Outlook
8.3.6. Russia Candy and Sweets Regional Analysis and Outlook
8.3.7. Rest of Europe Candy and Sweets Regional Analysis and Outlook
8.4. Asia Pacific Candy and Sweets Revenue (USD Million) by Country (2021-2032)
8.4.1. China Candy and Sweets Regional Analysis and Outlook
8.4.2. Japan Candy and Sweets Regional Analysis and Outlook
8.4.3. India Candy and Sweets Regional Analysis and Outlook
8.4.4. South Korea Candy and Sweets Regional Analysis and Outlook
8.4.5. Australia Candy and Sweets Regional Analysis and Outlook
8.4.6. South East Asia Candy and Sweets Regional Analysis and Outlook
8.4.7. Rest of Asia Pacific Candy and Sweets Regional Analysis and Outlook
8.5. South America Candy and Sweets Revenue (USD Million), by Country (2021-2032)
8.5.1. Brazil Candy and Sweets Regional Analysis and Outlook
8.5.2. Argentina Candy and Sweets Regional Analysis and Outlook
8.5.3. Rest of South America Candy and Sweets Regional Analysis and Outlook
8.6. Middle East and Africa Candy and Sweets Revenue (USD Million) by Country (2021-2032)
8.6.1. Middle East Candy and Sweets Regional Analysis and Outlook
8.6.2. Africa Candy and Sweets Regional Analysis and Outlook
Chapter 9. North America Candy and Sweets Analysis and Outlook
9.1. North America Candy and Sweets Revenue (USD Million) by Segments (2021-2032)
9.1.1. North America Candy and Sweets Revenue (USD Million) by Type (2021-2032)
9.1.2. North America Candy and Sweets Revenue (USD Million) by Application (2021-2032)
9.1.3. North America Candy and Sweets Revenue (USD Million) by Product (2021-2032)
By Type
Chocolate
Gummies
Hard Candies
Licorice
Lollipops
Others
By Distribution Channel
Supermarkets/Hypermarkets
Convenience Stores
Specialty Food Stores
Online
Others
Chapter 10. Europe Candy and Sweets Analysis and Outlook
10.1. Europe Candy and Sweets Revenue (USD Million), by Segments (USD Million) (2021-2032)
10.1.1. Europe Candy and Sweets Revenue (USD Million) by Type (2021-2032)
10.1.2. Europe Candy and Sweets Revenue (USD Million) by Application (2021-2032)
10.1.3. Europe Candy and Sweets Revenue (USD Million) by Product (2021-2032)
By Type
Chocolate
Gummies
Hard Candies
Licorice
Lollipops
Others
By Distribution Channel
Supermarkets/Hypermarkets
Convenience Stores
Specialty Food Stores
Online
Others
Chapter 11. Asia Pacific Candy and Sweets Analysis and Outlook
11.1. Asia Pacific Candy and Sweets Revenue (USD Million), and Revenue (USD Million) by Segments (2021-2032)
11.1.1. Asia Pacific Candy and Sweets Revenue (USD Million) by Type (2021-2032)
11.1.2. Asia Pacific Candy and Sweets Revenue (USD Million) by Application (2021-2032)
11.1.3. Asia Pacific Candy and Sweets Revenue (USD Million) by Product (2021-2032)
By Type
Chocolate
Gummies
Hard Candies
Licorice
Lollipops
Others
By Distribution Channel
Supermarkets/Hypermarkets
Convenience Stores
Specialty Food Stores
Online
Others
Chapter 12. South America Candy and Sweets Analysis and Outlook
12.1. South America Candy and Sweets Revenue (USD Million), by Segments (2021-2032)
12.1.1. South America Candy and Sweets Revenue (USD Million) by Type (2021-2032)
12.1.2. South America Candy and Sweets Revenue (USD Million) by Application (2021-2032)
12.1.3. South America Candy and Sweets Revenue (USD Million) by Product (2021-2032)
By Type
Chocolate
Gummies
Hard Candies
Licorice
Lollipops
Others
By Distribution Channel
Supermarkets/Hypermarkets
Convenience Stores
Specialty Food Stores
Online
Others
Chapter 13. Middle East and Africa Candy and Sweets Analysis and Outlook
13.1. Middle East and Africa Candy and Sweets Revenue (USD Million), by Segments (2021-2032)
13.1.1. Middle East and Africa Candy and Sweets Revenue (USD Million) by Type (2021-2032)
13.1.2. Middle East and Africa Candy and Sweets Revenue (USD Million) by Application (2021-2032)
13.1.3. Middle East and Africa Candy and Sweets Revenue (USD Million) by Product (2021-2032)
By Type
Chocolate
Gummies
Hard Candies
Licorice
Lollipops
Others
By Distribution Channel
Supermarkets/Hypermarkets
Convenience Stores
Specialty Food Stores
Online
Others
Chapter 14. Candy and Sweets Company Profiles
14.1 Business Overview
14.2 Product Profiles
14.3 SWOT Profiles
14.5 Recent Developments
14.6 Financial Profile
List of Companies
Arcor
August Storck KG
Bourbon Corp
Chocoladefabriken Lindt & Sprungli
Chocolat Frey AB
Ezaki Glico Co. Ltd
Ferrero Group
General Mills
Haribo GmbH & Co. K.G.
Kellogg Co.
Mars Inc
Meiji Co. Ltd
Mondelez International Inc
Morinaga & Co. Ltd
Nestlé S.A.
Orion Corp
Perfetti Van Melle
pladis
The Hershey Company
United Confectionary Manufacturers
15. Methodology and Data Sources
15.1 Customization Offerings
15.2 Subscription Services
15.3 Related Reports
15.4 Publisher Expertise
LIST OF TABLES
Table 1 Market Segmentation Analysis
Table 2 Global Candy and Sweets Market Share of Leading Companies, 2023
Table 3 Product Offerings of Leading Companies
Table 4 Low Growth Scenario Forecasts
Table 5 Reference Case Growth Scenario
Table 6 High Growth Case Scenario
Table 7 Global Candy and Sweets Revenue (USD Million) And CAGR (%) By Type (2021-2032)
Table 8 Global Candy and Sweets Revenue (USD Million) And CAGR (%) By Application (2021-2032)
Table 9 Global Candy and Sweets Revenue (USD Million) And CAGR (%) By Product (2021-2032)
Table 10 Global Candy and Sweets Market Revenue (USD Million) By Regions (2021-2032)
Table 11 Global Candy and Sweets Market Share (%) By Regions (2021-2032)
Table 12 North America Candy and Sweets Revenue (USD Million) By Country (2021-2032)
Table 13 Europe Candy and Sweets Revenue (USD Million) By Country (2021-2032)
Table 14 Asia Pacific Candy and Sweets Revenue (USD Million) By Country (2021-2032)
Table 15 South America Candy and Sweets Revenue (USD Million) By Country (2021-2032)
Table 16 Middle East and Africa Candy and Sweets Revenue (USD Million) By Region (2021-2032)
Table 17 North America Candy and Sweets Revenue (USD Million) By Type (2021-2032)
Table 18 North America Candy and Sweets Revenue (USD Million) By Application (2021-2032)
Table 19 North America Candy and Sweets Revenue (USD Million) By Product (2021-2032)
Table 20 Europe Candy and Sweets Revenue (USD Million) By Type (2021-2032)
Table 21 Europe Candy and Sweets Revenue (USD Million) By Application (2021-2032)
Table 22 Europe Candy and Sweets Revenue (USD Million) By Product (2021-2032)
Table 23 Asia Pacific Candy and Sweets Revenue (USD Million) By Type (2021-2032)
Table 24 Asia Pacific Candy and Sweets Revenue (USD Million) By Application (2021-2032)
Table 25 Asia Pacific Candy and Sweets Revenue (USD Million) By Product (2021-2032)
Table 26 South America Candy and Sweets Revenue (USD Million) By Type (2021-2032)
Table 27 South America Candy and Sweets Revenue (USD Million) By Application (2021-2032)
Table 28 South America Candy and Sweets Revenue (USD Million) By Product (2021-2032)
Table 29 Middle East and Africa Candy and Sweets Revenue (USD Million) By Type (2021-2032)
Table 30 Middle East and Africa Candy and Sweets Revenue (USD Million) By Application (2021-2032)
Table 31 Middle East and Africa Candy and Sweets Revenue (USD Million) By Product (2021-2032)
LIST OF FIGURES
Figure 1. Market Scope
Figure 2. Pricing Forecasts Per Unit, 2023- 2032
Figure 3. Porter’s Five Forces
Figure 4. Global Candy and Sweets Market Revenue (USD Million) By Regions (2021-2032)
Figure 5. Global Candy and Sweets Market Share (%) By Regions (2023)
Figure 6. North America Candy and Sweets Revenue (USD Million) By Country (2021-2032)
Figure 7. United States Candy and Sweets Revenue (USD Million) By Country (2021-2032)
Figure 8. Canada Candy and Sweets Revenue (USD Million) By Country (2021-2032)
Figure 9. Mexico Candy and Sweets Revenue (USD Million) By Country (2021-2032)
Figure 10. Europe Candy and Sweets Revenue (USD Million) By Country (2021-2032)
Figure 11. Germany Candy and Sweets Revenue (USD Million) By Country (2021-2032)
Figure 12. France Candy and Sweets Revenue (USD Million) By Country (2021-2032)
Figure 13. United Kingdom Candy and Sweets Revenue (USD Million) By Country (2021-2032)
Figure 14. Spain Candy and Sweets Revenue (USD Million) By Country (2021-2032)
Figure 15. Italy Candy and Sweets Revenue (USD Million) By Country (2021-2032)
Figure 16. Russia Candy and Sweets Revenue (USD Million) By Country (2021-2032)
Figure 17. Rest of Europe Candy and Sweets Revenue (USD Million) By Country (2021-2032)
Figure 11. Asia Pacific Candy and Sweets Revenue (USD Million) By Country (2021-2032)
Figure 12. China Candy and Sweets Revenue (USD Million) By Country (2021-2032)
Figure 13. Japan Candy and Sweets Revenue (USD Million) By Country (2021-2032)
Figure 14. India Candy and Sweets Revenue (USD Million) By Country (2021-2032)
Figure 15. South Korea Candy and Sweets Revenue (USD Million) By Country (2021-2032)
Figure 16. Australia Candy and Sweets Revenue (USD Million) By Country (2021-2032)
Figure 17. South East Asia Candy and Sweets Revenue (USD Million) By Country (2021-2032)
Figure 18. South America Candy and Sweets Revenue (USD Million) By Country (2021-2032)
Figure 19. Brazil Candy and Sweets Revenue (USD Million) By Country (2021-2032)
Figure 20. Argentina Candy and Sweets Revenue (USD Million) By Country (2021-2032)
Figure 21. Rest of Asia Pacific Candy and Sweets Revenue (USD Million) By Country (2021-2032)
Figure 22. Middle East and Africa Candy and Sweets Revenue (USD Million) By Region (2021-2032)
Figure 23. Saudi Arabia Candy and Sweets Revenue (USD Million) By Region (2021-2032)
Figure 24. The UAE Candy and Sweets Revenue (USD Million) By Region (2021-2032)
Figure 25. Rest of Middle East Candy and Sweets Revenue (USD Million) By Region (2021-2032)
Figure 26. South Africa Candy and Sweets Revenue (USD Million) By Region (2021-2032)
Figure 27. Africa Candy and Sweets Revenue (USD Million) By Region (2021-2032)
Figure 28. North America Candy and Sweets Revenue (USD Million) By Type (2021-2032)
Figure 29. North America Candy and Sweets Revenue (USD Million) By Application (2021-2032)
Figure 30. North America Candy and Sweets Revenue (USD Million) By Product (2021-2032)
Figure 31. Europe Candy and Sweets Revenue (USD Million) By Type (2021-2032)
Figure 32. Europe Candy and Sweets Revenue (USD Million) By Application (2021-2032)
Figure 33. Europe Candy and Sweets Revenue (USD Million) By Product (2021-2032)
Figure 34. Asia Pacific Candy and Sweets Revenue (USD Million) By Type (2021-2032)
Figure 35. Asia Pacific Candy and Sweets Revenue (USD Million) By Application (2021-2032)
Figure 36. Asia Pacific Candy and Sweets Revenue (USD Million) By Product (2021-2032)
Figure 37. South America Candy and Sweets Revenue (USD Million) By Type (2021-2032)
Figure 38. South America Candy and Sweets Revenue (USD Million) By Application (2021-2032)
Figure 39. South America Candy and Sweets Revenue (USD Million) By Product (2021-2032)
Figure 40. Middle East and Africa Candy and Sweets Revenue (USD Million) By Type (2021-2032)
Figure 41. Middle East and Africa Candy and Sweets Revenue (USD Million) By Application (2021-2032)
Figure 42. Middle East and Africa Candy and Sweets Revenue (USD Million) By Product (2021-2032)
By Type
Chocolate
Gummies
Hard Candies
Licorice
Lollipops
Others
By Distribution Channel
Supermarkets/Hypermarkets
Convenience Stores
Specialty Food Stores
Online
Others
Countries Analyzed
North America (US, Canada, Mexico)
Europe (Germany, UK, France, Spain, Italy, Russia, Rest of Europe)
Asia Pacific (China, India, Japan, South Korea, Australia, South East Asia, Rest of Asia)
South America (Brazil, Argentina, Rest of South America)
Middle East and Africa (Saudi Arabia, UAE, Rest of Middle East, South Africa, Egypt, Rest of Africa)
