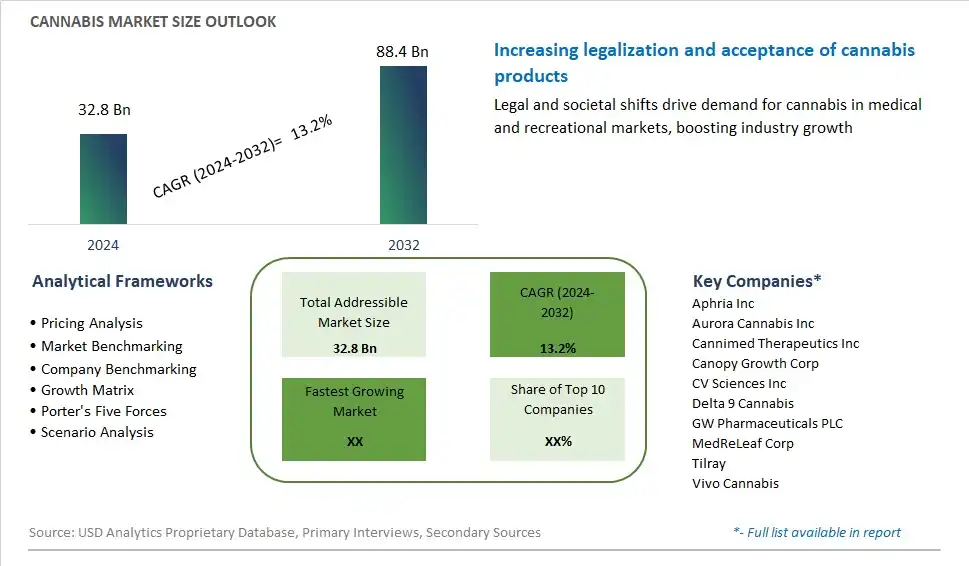
Global Cannabis Market Size is valued at $32.8 Billion in 2024 and is forecast to register a growth rate (CAGR) of 13.2% to reach $88.4 Billion by 2032.
The global Cannabis Market Comprehensive Study analyzes and forecasts the market size across 6 regions and 24 countries for diverse segments -By Product (Capsules, Concentrates, Edibles, Others), By Application (Medical, Recreational), By Compound (Tetrahydrocannabinol (THC), Cannabidiol (CBD), Balanced THC & CBD)
An Introduction to Cannabis Market
Cannabis, also known as marijuana or hemp, is a versatile plant with various applications in medicine, recreation, and industry in 2024. With the legalization of cannabis for medical and recreational use in many regions, the cannabis industry is experiencing rapid growth and innovation, creating opportunities for cultivation, processing, distribution, and retail of cannabis products. From pharmaceutical formulations and wellness supplements to recreational edibles and beverages, cannabis offers a wide range of therapeutic and recreational benefits that appeal to consumers seeking alternatives to traditional medicine and intoxicants. With advancements in breeding, cultivation, and extraction techniques, cannabis cultivars are being developed to optimize cannabinoid profiles, terpene compositions, and sensory attributes for specific uses and preferences. As regulatory frameworks evolve and consumer acceptance of cannabis products grows, the market for cannabis is expected to expand, driven by demand for safe, standardized, and high-quality products that meet the diverse needs and preferences of consumers worldwide.
Cannabis Competitive Landscape
The market report analyses the leading companies in the industry including Aphria Inc, Aurora Cannabis Inc, Cannimed Therapeutics Inc, Canopy Growth Corp, CV Sciences Inc, Delta 9 Cannabis, GW Pharmaceuticals PLC, MedReLeaf Corp, Tilray, Vivo Cannabis, and Others.
Cannabis Market Dynamics
Cannabis Market Trend: Legalization and Mainstream Acceptance of Cannabis
One of the most prominent trends in the cannabis market is the legalization and mainstream acceptance of cannabis products for both medical and recreational use. Over the past decade, there has been a significant shift in attitudes and policies towards cannabis, with an increasing number of countries and states legalizing its use for medical purposes and, in some cases, for adult recreational use. This trend is driven by evolving perceptions of cannabis as a therapeutic agent, growing recognition of its potential health benefits, and the economic opportunities presented by the cannabis industry. As legalization efforts continue to gain momentum worldwide, the cannabis market is experiencing unprecedented growth and diversification, with a wide range of products entering the market, including dried flower, concentrates, edibles, topicals, and beverages. Additionally, mainstream retailers, pharmaceutical companies, and consumer packaged goods (CPG) brands are entering the cannabis space, further legitimizing and expanding the market. The legalization and mainstream acceptance of cannabis represent a transformative shift in the industry, opening up new opportunities for innovation, investment, and market expansion.
Market Driver: Medical Cannabis Research and Regulatory Changes
A key driver propelling the growth of the cannabis market is the increasing focus on medical cannabis research and regulatory changes that facilitate access to medical cannabis products for patients. Scientific research into the therapeutic properties of cannabis compounds, such as cannabinoids and terpenes, has accelerated in recent years, leading to a better understanding of their potential applications in treating various medical conditions, including chronic pain, epilepsy, cancer, anxiety, and insomnia. This driver is reinforced by regulatory changes that have expanded access to medical cannabis for patients in need, as governments and regulatory agencies recognize the therapeutic potential of cannabis and enact legislation to legalize medical cannabis use and regulate its production and distribution. As a result, the medical cannabis market is experiencing significant growth, with increasing demand for medical-grade cannabis products, pharmaceutical formulations, and personalized treatment options. Additionally, regulatory changes are driving investment in medical cannabis research, clinical trials, and product development, paving the way for the development of innovative therapies and treatments that harness the therapeutic properties of cannabis for improving patient outcomes and quality of life.
Market Opportunity: Diversification and Innovation in Cannabis Products
An opportunity within the cannabis market lies in diversification and innovation in cannabis products to meet evolving consumer preferences, market demands, and regulatory requirements. With the expansion of legal cannabis markets, there's growing demand for a wide range of cannabis products beyond traditional dried flower, including concentrates, extracts, edibles, beverages, topicals, and pharmaceutical formulations. This presents an opportunity for companies to innovate and differentiate their offerings by developing novel products that cater to specific consumer needs and preferences, such as low-dose options, CBD-infused products, microdosing formulations, and personalized cannabis experiences. Additionally, there's potential for innovation in delivery methods, packaging, branding, and marketing strategies to target different consumer segments and create unique value propositions. Furthermore, as regulations evolve and barriers to entry into the cannabis market decrease, there's an opportunity for new entrants, entrepreneurs, and existing companies from other industries to enter the cannabis space and capitalize on the growing market opportunity. By embracing innovation, collaboration, and market diversification, companies can position themselves for success in the dynamic and rapidly evolving cannabis market.
Cannabis Market Share Analysis: Edibles held the dominant market share in 2024
In the Cannabis Market segmented by product, the edibles segment is the largest, propelled by several pivotal factors. Edibles offer consumers a convenient, discreet, and palatable way to consume cannabis, appealing to a broad spectrum of users, including both medical patients and recreational consumers. The versatility of edibles allows for the incorporation of cannabis extracts into a wide range of food and beverage products, such as chocolates, gummies, beverages, and baked goods, catering to diverse consumer preferences and dietary restrictions. Additionally, edibles provide an alternative consumption method for individuals who prefer to avoid the respiratory risks associated with smoking or vaping cannabis. Further, the growing trend towards cannabis legalization and mainstream acceptance has fueled innovation in the edibles market, with manufacturers introducing new flavors, formulations, and dosage options to meet evolving consumer demands. As a result, the edibles segment stands as the largest in the Cannabis Market, poised for continued growth as consumers increasingly embrace edible cannabis products as part of their lifestyle and wellness routines.
Cannabis Market Share Analysis: Recreational market is poised to register the fastest growth rae over the forecast period to 2032
In the Cannabis Market segmented by application, the recreational segment is the fastest-growing, driven by several transformative factors. With the legalization of recreational cannabis in various regions, there has been a significant surge in demand from adult consumers seeking cannabis for non-medical purposes. The recreational market offers a wide range of cannabis products, including flower, concentrates, edibles, and infused beverages, catering to diverse consumer preferences and consumption habits. Additionally, the normalization of cannabis use and the destigmatization of recreational cannabis have led to increased social acceptance and accessibility, driving further market growth. Further, the recreational cannabis market benefits from the emergence of new consumption trends and product innovations, such as microdosing, wellness-focused products, and cannabis tourism experiences, attracting a broader audience of recreational users. As a result, the recreational segment is experiencing rapid expansion and is poised to continue growing as legalization efforts progress globally, creating new opportunities for market players and driving the overall growth of the Cannabis Market.
Cannabis Market Share Analysis: Tetrahydrocannabinol (THC) held the dominant market share in 2024
In the Cannabis Market segmented by compound, the tetrahydrocannabinol (THC) segment is the largest, propelled by several pivotal factors. THC is the primary psychoactive compound found in cannabis and is responsible for the euphoric effects commonly associated with recreational cannabis use. As such, THC-dominant cannabis products are favored by recreational consumers seeking a euphoric high or intoxicating experience. Additionally, THC has garnered attention for its potential therapeutic benefits, including pain relief, appetite stimulation, and nausea suppression, further driving its demand in the medical cannabis market. Further, the legalization of recreational cannabis in various regions has expanded the consumer base for THC-dominant products, fueling market growth. Furthermore, advancements in cultivation techniques and breeding have led to the development of high-THC strains and concentrates with increased potency, catering to the preferences of both recreational and medical cannabis users. As a result, the THC segment stands as the largest in the Cannabis Market, poised for continued dominance as demand for psychoactive cannabis products remains robust globally.
Cannabis Market Segmentation
By Product
Capsules
Concentrates
Edibles
Others
By Application
Medical
Recreational
By Compound
Tetrahydrocannabinol (THC)
Cannabidiol (CBD)
Balanced THC & CBD
Countries Analyzed
North America (US, Canada, Mexico)
Europe (Germany, UK, France, Spain, Italy, Russia, Rest of Europe)
Asia Pacific (China, India, Japan, South Korea, Australia, South East Asia, Rest of Asia)
South America (Brazil, Argentina, Rest of South America)
Middle East and Africa (Saudi Arabia, UAE, Rest of Middle East, South Africa, Egypt, Rest of Africa)
Cannabis Companies Profiled in the Study
Aphria Inc
Aurora Cannabis Inc
Cannimed Therapeutics Inc
Canopy Growth Corp
CV Sciences Inc
Delta 9 Cannabis
GW Pharmaceuticals PLC
MedReLeaf Corp
Tilray
Vivo Cannabis
*- List Not Exhaustive
Chapter 1. TABLE OF CONTENTS
Chapter 2. Introduction to Cannabis Market
2.1. Market Overview
2.2. Key Statistics and Report Highlights
2.3. Scope of the Comprehensive Study
2.3.1. Market Definition
2.3.2 Countries and Regions Covered
2.3.3 Research Objective
2.3.4 Units, Currency, and Conversions
2.3.5 Industry Value Chain
2.4. Key Market Segments
2.5. Key Companies
2.6. Study Period
Chapter 3. Strategic Analysis Review
3.1. Cannabis Pricing Analysis and Forecast
3.2. Porter’s Five Forces
3.3. Market Ecosystem
3.4. SWOT Analysis
3.5. Regulatory Scenario
3.3. Effects of Inflation, Russia-Ukraine War, moderating economic growth, and other macroeconomic factors
Chapter 4. Competitive Landscape
4.1. Market Share Analysis
4.1.1. Global Cannabis Market Share by Company, 2023
4.1.2. Product Offerings of Leading Cannabis Companies
4.2. Market Entropy
4.2.1. New Product Launches in the Industry
4.2.2. Mergers, Acquisitions, Joint ventures, and Partnerships
4.3. Key Strategies and Best Practices
Chapter 5. Global Market Projections: Best, Reference, and Low Case Scenarios
5.1. Growth Analysis- Case Scenario Definitions
5.2. Low Growth Case Scenario Forecasts
5.3. Reference Growth Case Scenario Forecasts
5.4. High Growth Case Scenario Forecasts
Chapter 6. Market Dynamics
6.1. Cannabis Market Drivers
6.2. Cannabis Market Challenges
6.6. Cannabis Market Opportunities
6.4. Cannabis Market Trends
Chapter 7. Global Cannabis Market Outlook Trends
7.1. Global Cannabis Revenue (USD Million) and CAGR (%) by Type (2021-2032)
7.2. Global Cannabis Revenue (USD Million) and CAGR (%) by Application (2021-2032)
7.3. Global Cannabis Revenue (USD Million) and CAGR (%) by Product (2021-2032)
By Product
Capsules
Concentrates
Edibles
Others
By Application
Medical
Recreational
By Compound
Tetrahydrocannabinol (THC)
Cannabidiol (CBD)
Balanced THC & CBD
Chapter 8. Global Cannabis Regional Analysis and Outlook
8.1. Global Cannabis Revenue (USD Million) By Regions (2021- 2032)
8.2. North America Cannabis Revenue (USD Million) by Country (2021-2032)
8.2.1. United States Cannabis Regional Analysis and Outlook
8.2.2. Canada Cannabis Regional Analysis and Outlook
8.2.3. Mexico Cannabis Regional Analysis and Outlook
8.3. Europe Cannabis Revenue (USD Million), by Country (2021-2032)
8.3.1. Germany Cannabis Regional Analysis and Outlook
8.3.2. France Cannabis Regional Analysis and Outlook
8.3.3. United Kingdom Cannabis Regional Analysis and Outlook
8.3.4. Spain Cannabis Regional Analysis and Outlook
8.3.5. Italy Cannabis Regional Analysis and Outlook
8.3.6. Russia Cannabis Regional Analysis and Outlook
8.3.7. Rest of Europe Cannabis Regional Analysis and Outlook
8.4. Asia Pacific Cannabis Revenue (USD Million) by Country (2021-2032)
8.4.1. China Cannabis Regional Analysis and Outlook
8.4.2. Japan Cannabis Regional Analysis and Outlook
8.4.3. India Cannabis Regional Analysis and Outlook
8.4.4. South Korea Cannabis Regional Analysis and Outlook
8.4.5. Australia Cannabis Regional Analysis and Outlook
8.4.6. South East Asia Cannabis Regional Analysis and Outlook
8.4.7. Rest of Asia Pacific Cannabis Regional Analysis and Outlook
8.5. South America Cannabis Revenue (USD Million), by Country (2021-2032)
8.5.1. Brazil Cannabis Regional Analysis and Outlook
8.5.2. Argentina Cannabis Regional Analysis and Outlook
8.5.3. Rest of South America Cannabis Regional Analysis and Outlook
8.6. Middle East and Africa Cannabis Revenue (USD Million) by Country (2021-2032)
8.6.1. Middle East Cannabis Regional Analysis and Outlook
8.6.2. Africa Cannabis Regional Analysis and Outlook
Chapter 9. North America Cannabis Analysis and Outlook
9.1. North America Cannabis Revenue (USD Million) by Segments (2021-2032)
9.1.1. North America Cannabis Revenue (USD Million) by Type (2021-2032)
9.1.2. North America Cannabis Revenue (USD Million) by Application (2021-2032)
9.1.3. North America Cannabis Revenue (USD Million) by Product (2021-2032)
By Product
Capsules
Concentrates
Edibles
Others
By Application
Medical
Recreational
By Compound
Tetrahydrocannabinol (THC)
Cannabidiol (CBD)
Balanced THC & CBD
Chapter 10. Europe Cannabis Analysis and Outlook
10.1. Europe Cannabis Revenue (USD Million), by Segments (USD Million) (2021-2032)
10.1.1. Europe Cannabis Revenue (USD Million) by Type (2021-2032)
10.1.2. Europe Cannabis Revenue (USD Million) by Application (2021-2032)
10.1.3. Europe Cannabis Revenue (USD Million) by Product (2021-2032)
By Product
Capsules
Concentrates
Edibles
Others
By Application
Medical
Recreational
By Compound
Tetrahydrocannabinol (THC)
Cannabidiol (CBD)
Balanced THC & CBD
Chapter 11. Asia Pacific Cannabis Analysis and Outlook
11.1. Asia Pacific Cannabis Revenue (USD Million), and Revenue (USD Million) by Segments (2021-2032)
11.1.1. Asia Pacific Cannabis Revenue (USD Million) by Type (2021-2032)
11.1.2. Asia Pacific Cannabis Revenue (USD Million) by Application (2021-2032)
11.1.3. Asia Pacific Cannabis Revenue (USD Million) by Product (2021-2032)
By Product
Capsules
Concentrates
Edibles
Others
By Application
Medical
Recreational
By Compound
Tetrahydrocannabinol (THC)
Cannabidiol (CBD)
Balanced THC & CBD
Chapter 12. South America Cannabis Analysis and Outlook
12.1. South America Cannabis Revenue (USD Million), by Segments (2021-2032)
12.1.1. South America Cannabis Revenue (USD Million) by Type (2021-2032)
12.1.2. South America Cannabis Revenue (USD Million) by Application (2021-2032)
12.1.3. South America Cannabis Revenue (USD Million) by Product (2021-2032)
By Product
Capsules
Concentrates
Edibles
Others
By Application
Medical
Recreational
By Compound
Tetrahydrocannabinol (THC)
Cannabidiol (CBD)
Balanced THC & CBD
Chapter 13. Middle East and Africa Cannabis Analysis and Outlook
13.1. Middle East and Africa Cannabis Revenue (USD Million), by Segments (2021-2032)
13.1.1. Middle East and Africa Cannabis Revenue (USD Million) by Type (2021-2032)
13.1.2. Middle East and Africa Cannabis Revenue (USD Million) by Application (2021-2032)
13.1.3. Middle East and Africa Cannabis Revenue (USD Million) by Product (2021-2032)
By Product
Capsules
Concentrates
Edibles
Others
By Application
Medical
Recreational
By Compound
Tetrahydrocannabinol (THC)
Cannabidiol (CBD)
Balanced THC & CBD
Chapter 14. Cannabis Company Profiles
14.1 Business Overview
14.2 Product Profiles
14.3 SWOT Profiles
14.5 Recent Developments
14.6 Financial Profile
List of Companies
Aphria Inc
Aurora Cannabis Inc
Cannimed Therapeutics Inc
Canopy Growth Corp
CV Sciences Inc
Delta 9 Cannabis
GW Pharmaceuticals PLC
MedReLeaf Corp
Tilray
Vivo Cannabis
15. Methodology and Data Sources
15.1 Customization Offerings
15.2 Subscription Services
15.3 Related Reports
15.4 Publisher Expertise
LIST OF TABLES
Table 1 Market Segmentation Analysis
Table 2 Global Cannabis Market Share of Leading Companies, 2023
Table 3 Product Offerings of Leading Companies
Table 4 Low Growth Scenario Forecasts
Table 5 Reference Case Growth Scenario
Table 6 High Growth Case Scenario
Table 7 Global Cannabis Revenue (USD Million) And CAGR (%) By Type (2021-2032)
Table 8 Global Cannabis Revenue (USD Million) And CAGR (%) By Application (2021-2032)
Table 9 Global Cannabis Revenue (USD Million) And CAGR (%) By Product (2021-2032)
Table 10 Global Cannabis Market Revenue (USD Million) By Regions (2021-2032)
Table 11 Global Cannabis Market Share (%) By Regions (2021-2032)
Table 12 North America Cannabis Revenue (USD Million) By Country (2021-2032)
Table 13 Europe Cannabis Revenue (USD Million) By Country (2021-2032)
Table 14 Asia Pacific Cannabis Revenue (USD Million) By Country (2021-2032)
Table 15 South America Cannabis Revenue (USD Million) By Country (2021-2032)
Table 16 Middle East and Africa Cannabis Revenue (USD Million) By Region (2021-2032)
Table 17 North America Cannabis Revenue (USD Million) By Type (2021-2032)
Table 18 North America Cannabis Revenue (USD Million) By Application (2021-2032)
Table 19 North America Cannabis Revenue (USD Million) By Product (2021-2032)
Table 20 Europe Cannabis Revenue (USD Million) By Type (2021-2032)
Table 21 Europe Cannabis Revenue (USD Million) By Application (2021-2032)
Table 22 Europe Cannabis Revenue (USD Million) By Product (2021-2032)
Table 23 Asia Pacific Cannabis Revenue (USD Million) By Type (2021-2032)
Table 24 Asia Pacific Cannabis Revenue (USD Million) By Application (2021-2032)
Table 25 Asia Pacific Cannabis Revenue (USD Million) By Product (2021-2032)
Table 26 South America Cannabis Revenue (USD Million) By Type (2021-2032)
Table 27 South America Cannabis Revenue (USD Million) By Application (2021-2032)
Table 28 South America Cannabis Revenue (USD Million) By Product (2021-2032)
Table 29 Middle East and Africa Cannabis Revenue (USD Million) By Type (2021-2032)
Table 30 Middle East and Africa Cannabis Revenue (USD Million) By Application (2021-2032)
Table 31 Middle East and Africa Cannabis Revenue (USD Million) By Product (2021-2032)
LIST OF FIGURES
Figure 1. Market Scope
Figure 2. Pricing Forecasts Per Unit, 2023- 2032
Figure 3. Porter’s Five Forces
Figure 4. Global Cannabis Market Revenue (USD Million) By Regions (2021-2032)
Figure 5. Global Cannabis Market Share (%) By Regions (2023)
Figure 6. North America Cannabis Revenue (USD Million) By Country (2021-2032)
Figure 7. United States Cannabis Revenue (USD Million) By Country (2021-2032)
Figure 8. Canada Cannabis Revenue (USD Million) By Country (2021-2032)
Figure 9. Mexico Cannabis Revenue (USD Million) By Country (2021-2032)
Figure 10. Europe Cannabis Revenue (USD Million) By Country (2021-2032)
Figure 11. Germany Cannabis Revenue (USD Million) By Country (2021-2032)
Figure 12. France Cannabis Revenue (USD Million) By Country (2021-2032)
Figure 13. United Kingdom Cannabis Revenue (USD Million) By Country (2021-2032)
Figure 14. Spain Cannabis Revenue (USD Million) By Country (2021-2032)
Figure 15. Italy Cannabis Revenue (USD Million) By Country (2021-2032)
Figure 16. Russia Cannabis Revenue (USD Million) By Country (2021-2032)
Figure 17. Rest of Europe Cannabis Revenue (USD Million) By Country (2021-2032)
Figure 11. Asia Pacific Cannabis Revenue (USD Million) By Country (2021-2032)
Figure 12. China Cannabis Revenue (USD Million) By Country (2021-2032)
Figure 13. Japan Cannabis Revenue (USD Million) By Country (2021-2032)
Figure 14. India Cannabis Revenue (USD Million) By Country (2021-2032)
Figure 15. South Korea Cannabis Revenue (USD Million) By Country (2021-2032)
Figure 16. Australia Cannabis Revenue (USD Million) By Country (2021-2032)
Figure 17. South East Asia Cannabis Revenue (USD Million) By Country (2021-2032)
Figure 18. South America Cannabis Revenue (USD Million) By Country (2021-2032)
Figure 19. Brazil Cannabis Revenue (USD Million) By Country (2021-2032)
Figure 20. Argentina Cannabis Revenue (USD Million) By Country (2021-2032)
Figure 21. Rest of Asia Pacific Cannabis Revenue (USD Million) By Country (2021-2032)
Figure 22. Middle East and Africa Cannabis Revenue (USD Million) By Region (2021-2032)
Figure 23. Saudi Arabia Cannabis Revenue (USD Million) By Region (2021-2032)
Figure 24. The UAE Cannabis Revenue (USD Million) By Region (2021-2032)
Figure 25. Rest of Middle East Cannabis Revenue (USD Million) By Region (2021-2032)
Figure 26. South Africa Cannabis Revenue (USD Million) By Region (2021-2032)
Figure 27. Africa Cannabis Revenue (USD Million) By Region (2021-2032)
Figure 28. North America Cannabis Revenue (USD Million) By Type (2021-2032)
Figure 29. North America Cannabis Revenue (USD Million) By Application (2021-2032)
Figure 30. North America Cannabis Revenue (USD Million) By Product (2021-2032)
Figure 31. Europe Cannabis Revenue (USD Million) By Type (2021-2032)
Figure 32. Europe Cannabis Revenue (USD Million) By Application (2021-2032)
Figure 33. Europe Cannabis Revenue (USD Million) By Product (2021-2032)
Figure 34. Asia Pacific Cannabis Revenue (USD Million) By Type (2021-2032)
Figure 35. Asia Pacific Cannabis Revenue (USD Million) By Application (2021-2032)
Figure 36. Asia Pacific Cannabis Revenue (USD Million) By Product (2021-2032)
Figure 37. South America Cannabis Revenue (USD Million) By Type (2021-2032)
Figure 38. South America Cannabis Revenue (USD Million) By Application (2021-2032)
Figure 39. South America Cannabis Revenue (USD Million) By Product (2021-2032)
Figure 40. Middle East and Africa Cannabis Revenue (USD Million) By Type (2021-2032)
Figure 41. Middle East and Africa Cannabis Revenue (USD Million) By Application (2021-2032)
Figure 42. Middle East and Africa Cannabis Revenue (USD Million) By Product (2021-2032)
By Product
Capsules
Concentrates
Edibles
Others
By Application
Medical
Recreational
By Compound
Tetrahydrocannabinol (THC)
Cannabidiol (CBD)
Balanced THC & CBD
Countries Analyzed
North America (US, Canada, Mexico)
Europe (Germany, UK, France, Spain, Italy, Russia, Rest of Europe)
Asia Pacific (China, India, Japan, South Korea, Australia, South East Asia, Rest of Asia)
South America (Brazil, Argentina, Rest of South America)
Middle East and Africa (Saudi Arabia, UAE, Rest of Middle East, South Africa, Egypt, Rest of Africa)
