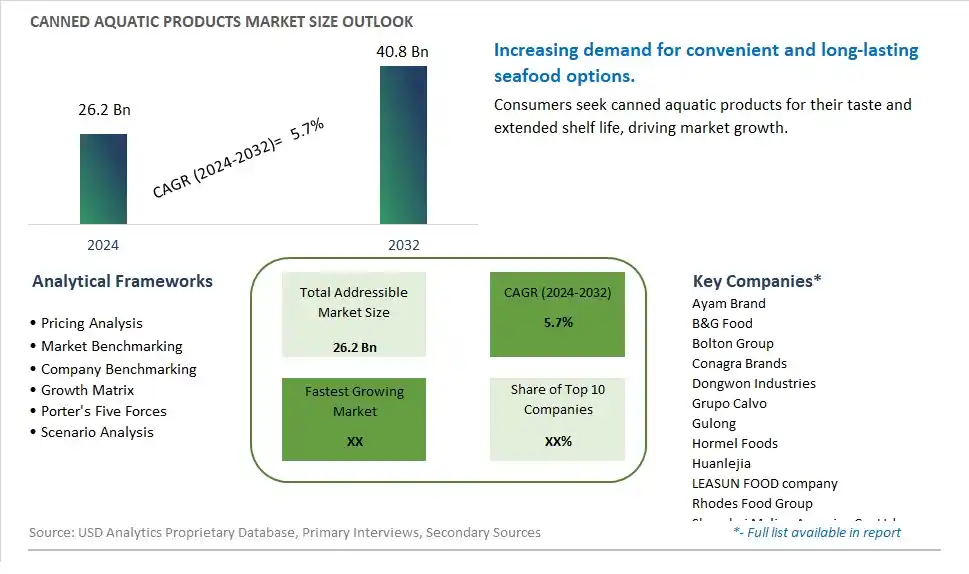
Global Canned Aquatic Products Market Size is valued at $26.2 Billion in 2024 and is forecast to register a growth rate (CAGR) of 5.7% to reach $40.8 Billion by 2032.
The global Canned Aquatic Products Market Comprehensive Study analyzes and forecasts the market size across 6 regions and 24 countries for diverse segments -By Type (Fish Type, Shellfish Type, Others), By Application (Supermarkets/Hypermarkets, Convenience Stores, Online Retailers, Others)
An Introduction to Canned Aquatic Products Market
The Canned Aquatic Products market in 2024 is witnessing steady growth, driven by the increasing demand for convenient and shelf-stable seafood options. Canned aquatic products, including fish, shellfish, and other marine items, are valued for their long shelf life, nutritional benefits, and ease of preparation. The market is supported by the growing popularity of ready-to-eat and ready-to-cook meals. Advances in canning technology and sustainable fishing practices are enhancing the quality and availability of canned aquatic products. The market is also benefiting from the trend towards healthy eating and the rising consumption of protein-rich seafood.
Canned Aquatic Products Competitive Landscape
The market report analyses the leading companies in the industry including Ayam Brand, B&G Food, Bolton Group, Conagra Brands, Dongwon Industries, Grupo Calvo, Gulong, Hormel Foods, Huanlejia, LEASUN FOOD company, Rhodes Food Group, Shanghai Maling Aquarius Co. Ltd, Thai Union Frozen Products, The Kraft Heinz Company, Zishan group, and Others.
Canned Aquatic Products Market Dynamics
Canned Aquatic Products Market Trend: Growing Demand for Convenience and Shelf-Stable Foods
A prominent market trend in canned aquatic products is the growing demand for convenience and shelf-stable foods. Consumers are increasingly seeking convenient and ready-to-eat options that require minimal preparation time, making canned aquatic products such as canned fish, seafood, and shellfish popular choices. This trend is driven by busy lifestyles, urbanization, and the need for long-lasting food items that can be easily stored and consumed without compromising on taste or nutrition.
Canned Aquatic Products Market Driver: Health Benefits and Nutritional Value
The market driver for canned aquatic products is the perceived health benefits and nutritional value they offer. Canned fish and seafood are rich sources of protein, omega-3 fatty acids, vitamins, and minerals, making them a nutritious addition to diets. The convenience of canned products also allows consumers to incorporate healthy aquatic foods into their meals more easily, contributing to a balanced and varied diet. Additionally, the long shelf life of canned products preserves their nutritional content, making them an attractive choice for health-conscious consumers.
Canned Aquatic Products Market Opportunity: Diversification of Product Offerings and Flavors
An opportunity within the canned aquatic products market lies in the diversification of product offerings and flavors. Manufacturers can capitalize on consumer preferences by introducing a wide range of canned aquatic products, including different types of fish, seafood, and shellfish, to cater to varying tastes and dietary preferences. Offering products in various flavors, such as smoked, spiced, or marinated options, can also appeal to different consumer segments and create excitement around canned aquatic foods. Furthermore, exploring sustainable sourcing practices, eco-friendly packaging, and transparent labeling can enhance the market appeal of canned aquatic products and attract environmentally conscious consumers.
Canned Aquatic Products Market Share Analysis: Fish Type segment generated the highest revenue share in the industry
The largest segment in the Canned Aquatic Products Market is the Fish Type category. Fish-based canned aquatic products have maintained their dominance due to several key factors. Firstly, fish is widely consumed globally and is considered a healthy source of protein, omega-3 fatty acids, and essential nutrients, making it a popular choice among consumers seeking nutritious food options. Additionally, advancements in food processing and preservation techniques have enabled fish to be canned efficiently while retaining its nutritional value and flavor, contributing to its widespread acceptance and demand. Furthermore, the versatility of fish allows for a variety of product offerings within the Fish Type segment, including tuna, salmon, sardines, and mackerel, catering to diverse consumer preferences. The convenience, long shelf life, and nutritional benefits associated with canned fish products have fueled the growth of the Fish Type segment, solidifying its position as the largest segment in the Canned Aquatic Products Market.
Canned Aquatic Products Market Share Analysis: Online Retailers is the fastest growing segment over the forecast period to 2032
The Online Retailers segment is experiencing the fastest growth in the Canned Aquatic Products Market. This growth can be attributed to several key factors driving the online retail sector's expansion globally. Firstly, the increasing penetration of internet services and the growing popularity of e-commerce platforms have made online shopping more accessible and convenient for consumers. As a result, more consumers are opting to purchase canned aquatic products online due to the convenience of browsing a wide range of products, comparing prices, and making purchases from the comfort of their homes. Additionally, online retailers often offer competitive pricing, discounts, and promotions, attracting budget-conscious consumers seeking value for their money. Furthermore, the Past few yearshas accelerated the shift towards online shopping as consumers prioritize safety and social distancing measures, further boosting the demand for canned aquatic products through online channels. As online retail continues to evolve and innovate, leveraging technologies such as AI-driven recommendations and seamless payment options, the Online Retailers segment is poised for continued rapid growth in the Canned Aquatic Products Market up to 2032.
Canned Aquatic Products Market Segmentation
By Type
Fish Type
Shellfish Type
Others
By Application
Supermarkets/Hypermarkets
Convenience Stores
Online Retailers
Others
Countries Analyzed
North America (US, Canada, Mexico)
Europe (Germany, UK, France, Spain, Italy, Russia, Rest of Europe)
Asia Pacific (China, India, Japan, South Korea, Australia, South East Asia, Rest of Asia)
South America (Brazil, Argentina, Rest of South America)
Middle East and Africa (Saudi Arabia, UAE, Rest of Middle East, South Africa, Egypt, Rest of Africa)
Canned Aquatic Products Companies Profiled in the Study
Ayam Brand
B&G Food
Bolton Group
Conagra Brands
Dongwon Industries
Grupo Calvo
Gulong
Hormel Foods
Huanlejia
LEASUN FOOD company
Rhodes Food Group
Shanghai Maling Aquarius Co. Ltd
Thai Union Frozen Products
The Kraft Heinz Company
Zishan group
*- List Not Exhaustive
Chapter 1. TABLE OF CONTENTS
Chapter 2. Introduction to Canned Aquatic Products Market
2.1. Market Overview
2.2. Key Statistics and Report Highlights
2.3. Scope of the Comprehensive Study
2.3.1. Market Definition
2.3.2 Countries and Regions Covered
2.3.3 Research Objective
2.3.4 Units, Currency, and Conversions
2.3.5 Industry Value Chain
2.4. Key Market Segments
2.5. Key Companies
2.6. Study Period
Chapter 3. Strategic Analysis Review
3.1. Canned Aquatic Products Pricing Analysis and Forecast
3.2. Porter’s Five Forces
3.3. Market Ecosystem
3.4. SWOT Analysis
3.5. Regulatory Scenario
3.3. Effects of Inflation, Russia-Ukraine War, moderating economic growth, and other macroeconomic factors
Chapter 4. Competitive Landscape
4.1. Market Share Analysis
4.1.1. Global Canned Aquatic Products Market Share by Company, 2023
4.1.2. Product Offerings of Leading Canned Aquatic Products Companies
4.2. Market Entropy
4.2.1. New Product Launches in the Industry
4.2.2. Mergers, Acquisitions, Joint ventures, and Partnerships
4.3. Key Strategies and Best Practices
Chapter 5. Global Market Projections: Best, Reference, and Low Case Scenarios
5.1. Growth Analysis- Case Scenario Definitions
5.2. Low Growth Case Scenario Forecasts
5.3. Reference Growth Case Scenario Forecasts
5.4. High Growth Case Scenario Forecasts
Chapter 6. Market Dynamics
6.1. Canned Aquatic Products Market Drivers
6.2. Canned Aquatic Products Market Challenges
6.6. Canned Aquatic Products Market Opportunities
6.4. Canned Aquatic Products Market Trends
Chapter 7. Global Canned Aquatic Products Market Outlook Trends
7.1. Global Canned Aquatic Products Revenue (USD Million) and CAGR (%) by Type (2021-2032)
7.2. Global Canned Aquatic Products Revenue (USD Million) and CAGR (%) by Application (2021-2032)
7.3. Global Canned Aquatic Products Revenue (USD Million) and CAGR (%) by Product (2021-2032)
By Type
Fish Type
Shellfish Type
Others
By Application
Supermarkets/Hypermarkets
Convenience Stores
Online Retailers
Others
Chapter 8. Global Canned Aquatic Products Regional Analysis and Outlook
8.1. Global Canned Aquatic Products Revenue (USD Million) By Regions (2021- 2032)
8.2. North America Canned Aquatic Products Revenue (USD Million) by Country (2021-2032)
8.2.1. United States Canned Aquatic Products Regional Analysis and Outlook
8.2.2. Canada Canned Aquatic Products Regional Analysis and Outlook
8.2.3. Mexico Canned Aquatic Products Regional Analysis and Outlook
8.3. Europe Canned Aquatic Products Revenue (USD Million), by Country (2021-2032)
8.3.1. Germany Canned Aquatic Products Regional Analysis and Outlook
8.3.2. France Canned Aquatic Products Regional Analysis and Outlook
8.3.3. United Kingdom Canned Aquatic Products Regional Analysis and Outlook
8.3.4. Spain Canned Aquatic Products Regional Analysis and Outlook
8.3.5. Italy Canned Aquatic Products Regional Analysis and Outlook
8.3.6. Russia Canned Aquatic Products Regional Analysis and Outlook
8.3.7. Rest of Europe Canned Aquatic Products Regional Analysis and Outlook
8.4. Asia Pacific Canned Aquatic Products Revenue (USD Million) by Country (2021-2032)
8.4.1. China Canned Aquatic Products Regional Analysis and Outlook
8.4.2. Japan Canned Aquatic Products Regional Analysis and Outlook
8.4.3. India Canned Aquatic Products Regional Analysis and Outlook
8.4.4. South Korea Canned Aquatic Products Regional Analysis and Outlook
8.4.5. Australia Canned Aquatic Products Regional Analysis and Outlook
8.4.6. South East Asia Canned Aquatic Products Regional Analysis and Outlook
8.4.7. Rest of Asia Pacific Canned Aquatic Products Regional Analysis and Outlook
8.5. South America Canned Aquatic Products Revenue (USD Million), by Country (2021-2032)
8.5.1. Brazil Canned Aquatic Products Regional Analysis and Outlook
8.5.2. Argentina Canned Aquatic Products Regional Analysis and Outlook
8.5.3. Rest of South America Canned Aquatic Products Regional Analysis and Outlook
8.6. Middle East and Africa Canned Aquatic Products Revenue (USD Million) by Country (2021-2032)
8.6.1. Middle East Canned Aquatic Products Regional Analysis and Outlook
8.6.2. Africa Canned Aquatic Products Regional Analysis and Outlook
Chapter 9. North America Canned Aquatic Products Analysis and Outlook
9.1. North America Canned Aquatic Products Revenue (USD Million) by Segments (2021-2032)
9.1.1. North America Canned Aquatic Products Revenue (USD Million) by Type (2021-2032)
9.1.2. North America Canned Aquatic Products Revenue (USD Million) by Application (2021-2032)
9.1.3. North America Canned Aquatic Products Revenue (USD Million) by Product (2021-2032)
By Type
Fish Type
Shellfish Type
Others
By Application
Supermarkets/Hypermarkets
Convenience Stores
Online Retailers
Others
Chapter 10. Europe Canned Aquatic Products Analysis and Outlook
10.1. Europe Canned Aquatic Products Revenue (USD Million), by Segments (USD Million) (2021-2032)
10.1.1. Europe Canned Aquatic Products Revenue (USD Million) by Type (2021-2032)
10.1.2. Europe Canned Aquatic Products Revenue (USD Million) by Application (2021-2032)
10.1.3. Europe Canned Aquatic Products Revenue (USD Million) by Product (2021-2032)
By Type
Fish Type
Shellfish Type
Others
By Application
Supermarkets/Hypermarkets
Convenience Stores
Online Retailers
Others
Chapter 11. Asia Pacific Canned Aquatic Products Analysis and Outlook
11.1. Asia Pacific Canned Aquatic Products Revenue (USD Million), and Revenue (USD Million) by Segments (2021-2032)
11.1.1. Asia Pacific Canned Aquatic Products Revenue (USD Million) by Type (2021-2032)
11.1.2. Asia Pacific Canned Aquatic Products Revenue (USD Million) by Application (2021-2032)
11.1.3. Asia Pacific Canned Aquatic Products Revenue (USD Million) by Product (2021-2032)
By Type
Fish Type
Shellfish Type
Others
By Application
Supermarkets/Hypermarkets
Convenience Stores
Online Retailers
Others
Chapter 12. South America Canned Aquatic Products Analysis and Outlook
12.1. South America Canned Aquatic Products Revenue (USD Million), by Segments (2021-2032)
12.1.1. South America Canned Aquatic Products Revenue (USD Million) by Type (2021-2032)
12.1.2. South America Canned Aquatic Products Revenue (USD Million) by Application (2021-2032)
12.1.3. South America Canned Aquatic Products Revenue (USD Million) by Product (2021-2032)
By Type
Fish Type
Shellfish Type
Others
By Application
Supermarkets/Hypermarkets
Convenience Stores
Online Retailers
Others
Chapter 13. Middle East and Africa Canned Aquatic Products Analysis and Outlook
13.1. Middle East and Africa Canned Aquatic Products Revenue (USD Million), by Segments (2021-2032)
13.1.1. Middle East and Africa Canned Aquatic Products Revenue (USD Million) by Type (2021-2032)
13.1.2. Middle East and Africa Canned Aquatic Products Revenue (USD Million) by Application (2021-2032)
13.1.3. Middle East and Africa Canned Aquatic Products Revenue (USD Million) by Product (2021-2032)
By Type
Fish Type
Shellfish Type
Others
By Application
Supermarkets/Hypermarkets
Convenience Stores
Online Retailers
Others
Chapter 14. Canned Aquatic Products Company Profiles
14.1 Business Overview
14.2 Product Profiles
14.3 SWOT Profiles
14.5 Recent Developments
14.6 Financial Profile
List of Companies
Ayam Brand
B&G Food
Bolton Group
Conagra Brands
Dongwon Industries
Grupo Calvo
Gulong
Hormel Foods
Huanlejia
LEASUN FOOD company
Rhodes Food Group
Shanghai Maling Aquarius Co. Ltd
Thai Union Frozen Products
The Kraft Heinz Company
Zishan group
15. Methodology and Data Sources
15.1 Customization Offerings
15.2 Subscription Services
15.3 Related Reports
15.4 Publisher Expertise
LIST OF TABLES
Table 1 Market Segmentation Analysis
Table 2 Global Canned Aquatic Products Market Share of Leading Companies, 2023
Table 3 Product Offerings of Leading Companies
Table 4 Low Growth Scenario Forecasts
Table 5 Reference Case Growth Scenario
Table 6 High Growth Case Scenario
Table 7 Global Canned Aquatic Products Revenue (USD Million) And CAGR (%) By Type (2021-2032)
Table 8 Global Canned Aquatic Products Revenue (USD Million) And CAGR (%) By Application (2021-2032)
Table 9 Global Canned Aquatic Products Revenue (USD Million) And CAGR (%) By Product (2021-2032)
Table 10 Global Canned Aquatic Products Market Revenue (USD Million) By Regions (2021-2032)
Table 11 Global Canned Aquatic Products Market Share (%) By Regions (2021-2032)
Table 12 North America Canned Aquatic Products Revenue (USD Million) By Country (2021-2032)
Table 13 Europe Canned Aquatic Products Revenue (USD Million) By Country (2021-2032)
Table 14 Asia Pacific Canned Aquatic Products Revenue (USD Million) By Country (2021-2032)
Table 15 South America Canned Aquatic Products Revenue (USD Million) By Country (2021-2032)
Table 16 Middle East and Africa Canned Aquatic Products Revenue (USD Million) By Region (2021-2032)
Table 17 North America Canned Aquatic Products Revenue (USD Million) By Type (2021-2032)
Table 18 North America Canned Aquatic Products Revenue (USD Million) By Application (2021-2032)
Table 19 North America Canned Aquatic Products Revenue (USD Million) By Product (2021-2032)
Table 20 Europe Canned Aquatic Products Revenue (USD Million) By Type (2021-2032)
Table 21 Europe Canned Aquatic Products Revenue (USD Million) By Application (2021-2032)
Table 22 Europe Canned Aquatic Products Revenue (USD Million) By Product (2021-2032)
Table 23 Asia Pacific Canned Aquatic Products Revenue (USD Million) By Type (2021-2032)
Table 24 Asia Pacific Canned Aquatic Products Revenue (USD Million) By Application (2021-2032)
Table 25 Asia Pacific Canned Aquatic Products Revenue (USD Million) By Product (2021-2032)
Table 26 South America Canned Aquatic Products Revenue (USD Million) By Type (2021-2032)
Table 27 South America Canned Aquatic Products Revenue (USD Million) By Application (2021-2032)
Table 28 South America Canned Aquatic Products Revenue (USD Million) By Product (2021-2032)
Table 29 Middle East and Africa Canned Aquatic Products Revenue (USD Million) By Type (2021-2032)
Table 30 Middle East and Africa Canned Aquatic Products Revenue (USD Million) By Application (2021-2032)
Table 31 Middle East and Africa Canned Aquatic Products Revenue (USD Million) By Product (2021-2032)
LIST OF FIGURES
Figure 1. Market Scope
Figure 2. Pricing Forecasts Per Unit, 2023- 2032
Figure 3. Porter’s Five Forces
Figure 4. Global Canned Aquatic Products Market Revenue (USD Million) By Regions (2021-2032)
Figure 5. Global Canned Aquatic Products Market Share (%) By Regions (2023)
Figure 6. North America Canned Aquatic Products Revenue (USD Million) By Country (2021-2032)
Figure 7. United States Canned Aquatic Products Revenue (USD Million) By Country (2021-2032)
Figure 8. Canada Canned Aquatic Products Revenue (USD Million) By Country (2021-2032)
Figure 9. Mexico Canned Aquatic Products Revenue (USD Million) By Country (2021-2032)
Figure 10. Europe Canned Aquatic Products Revenue (USD Million) By Country (2021-2032)
Figure 11. Germany Canned Aquatic Products Revenue (USD Million) By Country (2021-2032)
Figure 12. France Canned Aquatic Products Revenue (USD Million) By Country (2021-2032)
Figure 13. United Kingdom Canned Aquatic Products Revenue (USD Million) By Country (2021-2032)
Figure 14. Spain Canned Aquatic Products Revenue (USD Million) By Country (2021-2032)
Figure 15. Italy Canned Aquatic Products Revenue (USD Million) By Country (2021-2032)
Figure 16. Russia Canned Aquatic Products Revenue (USD Million) By Country (2021-2032)
Figure 17. Rest of Europe Canned Aquatic Products Revenue (USD Million) By Country (2021-2032)
Figure 11. Asia Pacific Canned Aquatic Products Revenue (USD Million) By Country (2021-2032)
Figure 12. China Canned Aquatic Products Revenue (USD Million) By Country (2021-2032)
Figure 13. Japan Canned Aquatic Products Revenue (USD Million) By Country (2021-2032)
Figure 14. India Canned Aquatic Products Revenue (USD Million) By Country (2021-2032)
Figure 15. South Korea Canned Aquatic Products Revenue (USD Million) By Country (2021-2032)
Figure 16. Australia Canned Aquatic Products Revenue (USD Million) By Country (2021-2032)
Figure 17. South East Asia Canned Aquatic Products Revenue (USD Million) By Country (2021-2032)
Figure 18. South America Canned Aquatic Products Revenue (USD Million) By Country (2021-2032)
Figure 19. Brazil Canned Aquatic Products Revenue (USD Million) By Country (2021-2032)
Figure 20. Argentina Canned Aquatic Products Revenue (USD Million) By Country (2021-2032)
Figure 21. Rest of Asia Pacific Canned Aquatic Products Revenue (USD Million) By Country (2021-2032)
Figure 22. Middle East and Africa Canned Aquatic Products Revenue (USD Million) By Region (2021-2032)
Figure 23. Saudi Arabia Canned Aquatic Products Revenue (USD Million) By Region (2021-2032)
Figure 24. The UAE Canned Aquatic Products Revenue (USD Million) By Region (2021-2032)
Figure 25. Rest of Middle East Canned Aquatic Products Revenue (USD Million) By Region (2021-2032)
Figure 26. South Africa Canned Aquatic Products Revenue (USD Million) By Region (2021-2032)
Figure 27. Africa Canned Aquatic Products Revenue (USD Million) By Region (2021-2032)
Figure 28. North America Canned Aquatic Products Revenue (USD Million) By Type (2021-2032)
Figure 29. North America Canned Aquatic Products Revenue (USD Million) By Application (2021-2032)
Figure 30. North America Canned Aquatic Products Revenue (USD Million) By Product (2021-2032)
Figure 31. Europe Canned Aquatic Products Revenue (USD Million) By Type (2021-2032)
Figure 32. Europe Canned Aquatic Products Revenue (USD Million) By Application (2021-2032)
Figure 33. Europe Canned Aquatic Products Revenue (USD Million) By Product (2021-2032)
Figure 34. Asia Pacific Canned Aquatic Products Revenue (USD Million) By Type (2021-2032)
Figure 35. Asia Pacific Canned Aquatic Products Revenue (USD Million) By Application (2021-2032)
Figure 36. Asia Pacific Canned Aquatic Products Revenue (USD Million) By Product (2021-2032)
Figure 37. South America Canned Aquatic Products Revenue (USD Million) By Type (2021-2032)
Figure 38. South America Canned Aquatic Products Revenue (USD Million) By Application (2021-2032)
Figure 39. South America Canned Aquatic Products Revenue (USD Million) By Product (2021-2032)
Figure 40. Middle East and Africa Canned Aquatic Products Revenue (USD Million) By Type (2021-2032)
Figure 41. Middle East and Africa Canned Aquatic Products Revenue (USD Million) By Application (2021-2032)
Figure 42. Middle East and Africa Canned Aquatic Products Revenue (USD Million) By Product (2021-2032)
By Type
Fish Type
Shellfish Type
Others
By Application
Supermarkets/Hypermarkets
Convenience Stores
Online Retailers
Others
Countries Analyzed
North America (US, Canada, Mexico)
Europe (Germany, UK, France, Spain, Italy, Russia, Rest of Europe)
Asia Pacific (China, India, Japan, South Korea, Australia, South East Asia, Rest of Asia)
South America (Brazil, Argentina, Rest of South America)
Middle East and Africa (Saudi Arabia, UAE, Rest of Middle East, South Africa, Egypt, Rest of Africa)
