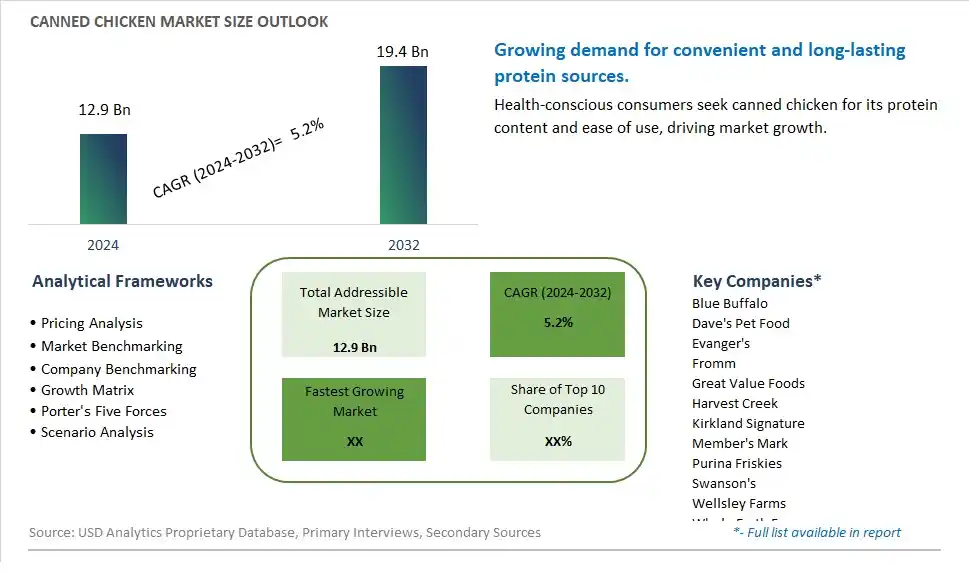
Global Canned Chicken Market Size is valued at $12.9 Billion in 2024 and is forecast to register a growth rate (CAGR) of 5.2% to reach $19.4 Billion by 2032.
The global Canned Chicken Market Comprehensive Study analyzes and forecasts the market size across 6 regions and 24 countries for diverse segments -By Type (Fresh, Frozen), By Application (Supermarkets/Hypermarkets, Convenience Stores, Online Retailers, Others)
An Introduction to Canned Chicken Market
In 2024, the Canned Chicken market is witnessing significant growth, driven by the demand for convenient and high-protein meal options. Canned chicken, known for its versatility and long shelf life, is used in salads, sandwiches, soups, and casseroles. The market is supported by the growing trend towards ready-to-eat and easy-to-prepare foods. Advances in canning technology and preservation methods are enhancing the flavor, texture, and nutritional content of canned chicken. The market is also benefiting from the trend towards clean-label and minimally processed foods, appealing to health-conscious consumers seeking high-quality protein sources.
Canned Chicken Competitive Landscape
The market report analyses the leading companies in the industry including Blue Buffalo, Dave's Pet Food, Evanger's, Fromm, Great Value Foods, Harvest Creek, Kirkland Signature, Member's Mark, Purina Friskies, Swanson's, Wellsley Farms, Whole Earth Farms, Wild Planet, and Others.
Canned Chicken Market Dynamics
Canned Chicken Market Trend: Increased Demand for Convenience and Long Shelf Life
The market trend for canned chicken is driven by the increased demand for convenience and long shelf life among consumers. Canned chicken offers a ready-to-eat protein source that can be easily incorporated into a variety of meals, making it popular among busy individuals, working professionals, and households seeking quick and hassle-free meal options. The extended shelf life of canned chicken enhances its appeal as a pantry staple, providing consumers with a convenient and reliable protein option that can be stored for an extended period.
Canned Chicken Market Driver: Versatility and Ease of Storage
The market driver for canned chicken is its versatility and ease of storage. Canned chicken can be used in a wide range of recipes, including sandwiches, salads, soups, casseroles, and pasta dishes, making it a versatile ingredient in both home cooking and foodservice applications. Its long shelf life eliminates the need for refrigeration until opened, reducing storage requirements and minimizing food waste. This convenience factor, coupled with its ability to be stored at room temperature, makes canned chicken a convenient and practical choice for consumers seeking convenient meal solutions.
Canned Chicken Market Opportunity: Healthier Formulations and Flavor Innovations
An opportunity within the canned chicken market lies in the development of healthier formulations and flavor innovations. With increasing consumer focus on health and wellness, there is a demand for canned chicken products that offer reduced sodium, lower fat content, and organic or antibiotic-free options. Manufacturers can capitalize on this trend by introducing healthier formulations that align with consumer preferences for nutritious and clean-label products. Additionally, exploring flavor innovations such as seasoned or marinated canned chicken varieties can attract consumers looking for flavorful and convenient meal options. By addressing these evolving consumer preferences, the canned chicken market can tap into new segments and drive growth in the coming years.
Canned Chicken Market Share Analysis: Fresh Canned Chicken segment generated the highest revenue share in the industry
The largest segment in the Canned Chicken Market is the Fresh type. This category represents chicken products that have been canned without undergoing freezing processes, retaining their natural freshness and flavor to a significant extent. The popularity of fresh canned chicken can be attributed to several factors. Firstly, consumers often perceive fresh products as healthier and more natural compared to frozen alternatives, leading to a higher demand for fresh canned chicken among health-conscious individuals. Additionally, fresh canned chicken offers convenience and versatility in meal preparation, making it a preferred choice for various culinary applications. Whether used in salads, sandwiches, soups, or as a standalone protein source, fresh canned chicken provides consumers with a convenient and quick solution for meal preparation without compromising on taste or nutritional value. The growing trend of home cooking and the need for convenient yet nutritious food options further contribute to the dominance of the Fresh segment in the Canned Chicken Market.
Canned Chicken Market Share Analysis: Online Retailers is the fastest growing segment over the forecast period to 2032
The Online Retailers segment is poised for significant growth in the Canned Chicken Market by 2032. This growth is primarily driven by the increasing adoption of e-commerce platforms and digital channels for food purchases. Online retailers offer consumers a convenient and hassle-free shopping experience, allowing them to browse a wide range of products, compare prices, and make purchases from the comfort of their homes. With the ongoing digital transformation and the shift towards online shopping, consumers are increasingly turning to online retailers for their grocery needs, including canned chicken products. Further, the Past few yearshas accelerated the trend of online shopping as people prioritize safety and social distancing measures. As a result, the Online Retailers segment is experiencing rapid growth as more consumers opt for the convenience and accessibility offered by online channels for purchasing canned chicken and other food items. This trend is expected to continue growing significantly as online shopping becomes increasingly integrated into consumers' daily routines.
Canned Chicken Market Segmentation
By Type
Fresh
Frozen
By Application
Supermarkets/Hypermarkets
Convenience Stores
Online Retailers
Others
Countries Analyzed
North America (US, Canada, Mexico)
Europe (Germany, UK, France, Spain, Italy, Russia, Rest of Europe)
Asia Pacific (China, India, Japan, South Korea, Australia, South East Asia, Rest of Asia)
South America (Brazil, Argentina, Rest of South America)
Middle East and Africa (Saudi Arabia, UAE, Rest of Middle East, South Africa, Egypt, Rest of Africa)
Canned Chicken Companies Profiled in the Study
Blue Buffalo
Dave's Pet Food
Evanger's
Fromm
Great Value Foods
Harvest Creek
Kirkland Signature
Member's Mark
Purina Friskies
Swanson's
Wellsley Farms
Whole Earth Farms
Wild Planet
*- List Not Exhaustive
Chapter 1. TABLE OF CONTENTS
Chapter 2. Introduction to Canned Chicken Market
2.1. Market Overview
2.2. Key Statistics and Report Highlights
2.3. Scope of the Comprehensive Study
2.3.1. Market Definition
2.3.2 Countries and Regions Covered
2.3.3 Research Objective
2.3.4 Units, Currency, and Conversions
2.3.5 Industry Value Chain
2.4. Key Market Segments
2.5. Key Companies
2.6. Study Period
Chapter 3. Strategic Analysis Review
3.1. Canned Chicken Pricing Analysis and Forecast
3.2. Porter’s Five Forces
3.3. Market Ecosystem
3.4. SWOT Analysis
3.5. Regulatory Scenario
3.3. Effects of Inflation, Russia-Ukraine War, moderating economic growth, and other macroeconomic factors
Chapter 4. Competitive Landscape
4.1. Market Share Analysis
4.1.1. Global Canned Chicken Market Share by Company, 2023
4.1.2. Product Offerings of Leading Canned Chicken Companies
4.2. Market Entropy
4.2.1. New Product Launches in the Industry
4.2.2. Mergers, Acquisitions, Joint ventures, and Partnerships
4.3. Key Strategies and Best Practices
Chapter 5. Global Market Projections: Best, Reference, and Low Case Scenarios
5.1. Growth Analysis- Case Scenario Definitions
5.2. Low Growth Case Scenario Forecasts
5.3. Reference Growth Case Scenario Forecasts
5.4. High Growth Case Scenario Forecasts
Chapter 6. Market Dynamics
6.1. Canned Chicken Market Drivers
6.2. Canned Chicken Market Challenges
6.6. Canned Chicken Market Opportunities
6.4. Canned Chicken Market Trends
Chapter 7. Global Canned Chicken Market Outlook Trends
7.1. Global Canned Chicken Revenue (USD Million) and CAGR (%) by Type (2021-2032)
7.2. Global Canned Chicken Revenue (USD Million) and CAGR (%) by Application (2021-2032)
7.3. Global Canned Chicken Revenue (USD Million) and CAGR (%) by Product (2021-2032)
By Type
Fresh
Frozen
By Application
Supermarkets/Hypermarkets
Convenience Stores
Online Retailers
Others
Chapter 8. Global Canned Chicken Regional Analysis and Outlook
8.1. Global Canned Chicken Revenue (USD Million) By Regions (2021- 2032)
8.2. North America Canned Chicken Revenue (USD Million) by Country (2021-2032)
8.2.1. United States Canned Chicken Regional Analysis and Outlook
8.2.2. Canada Canned Chicken Regional Analysis and Outlook
8.2.3. Mexico Canned Chicken Regional Analysis and Outlook
8.3. Europe Canned Chicken Revenue (USD Million), by Country (2021-2032)
8.3.1. Germany Canned Chicken Regional Analysis and Outlook
8.3.2. France Canned Chicken Regional Analysis and Outlook
8.3.3. United Kingdom Canned Chicken Regional Analysis and Outlook
8.3.4. Spain Canned Chicken Regional Analysis and Outlook
8.3.5. Italy Canned Chicken Regional Analysis and Outlook
8.3.6. Russia Canned Chicken Regional Analysis and Outlook
8.3.7. Rest of Europe Canned Chicken Regional Analysis and Outlook
8.4. Asia Pacific Canned Chicken Revenue (USD Million) by Country (2021-2032)
8.4.1. China Canned Chicken Regional Analysis and Outlook
8.4.2. Japan Canned Chicken Regional Analysis and Outlook
8.4.3. India Canned Chicken Regional Analysis and Outlook
8.4.4. South Korea Canned Chicken Regional Analysis and Outlook
8.4.5. Australia Canned Chicken Regional Analysis and Outlook
8.4.6. South East Asia Canned Chicken Regional Analysis and Outlook
8.4.7. Rest of Asia Pacific Canned Chicken Regional Analysis and Outlook
8.5. South America Canned Chicken Revenue (USD Million), by Country (2021-2032)
8.5.1. Brazil Canned Chicken Regional Analysis and Outlook
8.5.2. Argentina Canned Chicken Regional Analysis and Outlook
8.5.3. Rest of South America Canned Chicken Regional Analysis and Outlook
8.6. Middle East and Africa Canned Chicken Revenue (USD Million) by Country (2021-2032)
8.6.1. Middle East Canned Chicken Regional Analysis and Outlook
8.6.2. Africa Canned Chicken Regional Analysis and Outlook
Chapter 9. North America Canned Chicken Analysis and Outlook
9.1. North America Canned Chicken Revenue (USD Million) by Segments (2021-2032)
9.1.1. North America Canned Chicken Revenue (USD Million) by Type (2021-2032)
9.1.2. North America Canned Chicken Revenue (USD Million) by Application (2021-2032)
9.1.3. North America Canned Chicken Revenue (USD Million) by Product (2021-2032)
By Type
Fresh
Frozen
By Application
Supermarkets/Hypermarkets
Convenience Stores
Online Retailers
Others
Chapter 10. Europe Canned Chicken Analysis and Outlook
10.1. Europe Canned Chicken Revenue (USD Million), by Segments (USD Million) (2021-2032)
10.1.1. Europe Canned Chicken Revenue (USD Million) by Type (2021-2032)
10.1.2. Europe Canned Chicken Revenue (USD Million) by Application (2021-2032)
10.1.3. Europe Canned Chicken Revenue (USD Million) by Product (2021-2032)
By Type
Fresh
Frozen
By Application
Supermarkets/Hypermarkets
Convenience Stores
Online Retailers
Others
Chapter 11. Asia Pacific Canned Chicken Analysis and Outlook
11.1. Asia Pacific Canned Chicken Revenue (USD Million), and Revenue (USD Million) by Segments (2021-2032)
11.1.1. Asia Pacific Canned Chicken Revenue (USD Million) by Type (2021-2032)
11.1.2. Asia Pacific Canned Chicken Revenue (USD Million) by Application (2021-2032)
11.1.3. Asia Pacific Canned Chicken Revenue (USD Million) by Product (2021-2032)
By Type
Fresh
Frozen
By Application
Supermarkets/Hypermarkets
Convenience Stores
Online Retailers
Others
Chapter 12. South America Canned Chicken Analysis and Outlook
12.1. South America Canned Chicken Revenue (USD Million), by Segments (2021-2032)
12.1.1. South America Canned Chicken Revenue (USD Million) by Type (2021-2032)
12.1.2. South America Canned Chicken Revenue (USD Million) by Application (2021-2032)
12.1.3. South America Canned Chicken Revenue (USD Million) by Product (2021-2032)
By Type
Fresh
Frozen
By Application
Supermarkets/Hypermarkets
Convenience Stores
Online Retailers
Others
Chapter 13. Middle East and Africa Canned Chicken Analysis and Outlook
13.1. Middle East and Africa Canned Chicken Revenue (USD Million), by Segments (2021-2032)
13.1.1. Middle East and Africa Canned Chicken Revenue (USD Million) by Type (2021-2032)
13.1.2. Middle East and Africa Canned Chicken Revenue (USD Million) by Application (2021-2032)
13.1.3. Middle East and Africa Canned Chicken Revenue (USD Million) by Product (2021-2032)
By Type
Fresh
Frozen
By Application
Supermarkets/Hypermarkets
Convenience Stores
Online Retailers
Others
Chapter 14. Canned Chicken Company Profiles
14.1 Business Overview
14.2 Product Profiles
14.3 SWOT Profiles
14.5 Recent Developments
14.6 Financial Profile
List of Companies
Blue Buffalo
Dave's Pet Food
Evanger's
Fromm
Great Value Foods
Harvest Creek
Kirkland Signature
Member's Mark
Purina Friskies
Swanson's
Wellsley Farms
Whole Earth Farms
Wild Planet
15. Methodology and Data Sources
15.1 Customization Offerings
15.2 Subscription Services
15.3 Related Reports
15.4 Publisher Expertise
LIST OF TABLES
Table 1 Market Segmentation Analysis
Table 2 Global Canned Chicken Market Share of Leading Companies, 2023
Table 3 Product Offerings of Leading Companies
Table 4 Low Growth Scenario Forecasts
Table 5 Reference Case Growth Scenario
Table 6 High Growth Case Scenario
Table 7 Global Canned Chicken Revenue (USD Million) And CAGR (%) By Type (2021-2032)
Table 8 Global Canned Chicken Revenue (USD Million) And CAGR (%) By Application (2021-2032)
Table 9 Global Canned Chicken Revenue (USD Million) And CAGR (%) By Product (2021-2032)
Table 10 Global Canned Chicken Market Revenue (USD Million) By Regions (2021-2032)
Table 11 Global Canned Chicken Market Share (%) By Regions (2021-2032)
Table 12 North America Canned Chicken Revenue (USD Million) By Country (2021-2032)
Table 13 Europe Canned Chicken Revenue (USD Million) By Country (2021-2032)
Table 14 Asia Pacific Canned Chicken Revenue (USD Million) By Country (2021-2032)
Table 15 South America Canned Chicken Revenue (USD Million) By Country (2021-2032)
Table 16 Middle East and Africa Canned Chicken Revenue (USD Million) By Region (2021-2032)
Table 17 North America Canned Chicken Revenue (USD Million) By Type (2021-2032)
Table 18 North America Canned Chicken Revenue (USD Million) By Application (2021-2032)
Table 19 North America Canned Chicken Revenue (USD Million) By Product (2021-2032)
Table 20 Europe Canned Chicken Revenue (USD Million) By Type (2021-2032)
Table 21 Europe Canned Chicken Revenue (USD Million) By Application (2021-2032)
Table 22 Europe Canned Chicken Revenue (USD Million) By Product (2021-2032)
Table 23 Asia Pacific Canned Chicken Revenue (USD Million) By Type (2021-2032)
Table 24 Asia Pacific Canned Chicken Revenue (USD Million) By Application (2021-2032)
Table 25 Asia Pacific Canned Chicken Revenue (USD Million) By Product (2021-2032)
Table 26 South America Canned Chicken Revenue (USD Million) By Type (2021-2032)
Table 27 South America Canned Chicken Revenue (USD Million) By Application (2021-2032)
Table 28 South America Canned Chicken Revenue (USD Million) By Product (2021-2032)
Table 29 Middle East and Africa Canned Chicken Revenue (USD Million) By Type (2021-2032)
Table 30 Middle East and Africa Canned Chicken Revenue (USD Million) By Application (2021-2032)
Table 31 Middle East and Africa Canned Chicken Revenue (USD Million) By Product (2021-2032)
LIST OF FIGURES
Figure 1. Market Scope
Figure 2. Pricing Forecasts Per Unit, 2023- 2032
Figure 3. Porter’s Five Forces
Figure 4. Global Canned Chicken Market Revenue (USD Million) By Regions (2021-2032)
Figure 5. Global Canned Chicken Market Share (%) By Regions (2023)
Figure 6. North America Canned Chicken Revenue (USD Million) By Country (2021-2032)
Figure 7. United States Canned Chicken Revenue (USD Million) By Country (2021-2032)
Figure 8. Canada Canned Chicken Revenue (USD Million) By Country (2021-2032)
Figure 9. Mexico Canned Chicken Revenue (USD Million) By Country (2021-2032)
Figure 10. Europe Canned Chicken Revenue (USD Million) By Country (2021-2032)
Figure 11. Germany Canned Chicken Revenue (USD Million) By Country (2021-2032)
Figure 12. France Canned Chicken Revenue (USD Million) By Country (2021-2032)
Figure 13. United Kingdom Canned Chicken Revenue (USD Million) By Country (2021-2032)
Figure 14. Spain Canned Chicken Revenue (USD Million) By Country (2021-2032)
Figure 15. Italy Canned Chicken Revenue (USD Million) By Country (2021-2032)
Figure 16. Russia Canned Chicken Revenue (USD Million) By Country (2021-2032)
Figure 17. Rest of Europe Canned Chicken Revenue (USD Million) By Country (2021-2032)
Figure 11. Asia Pacific Canned Chicken Revenue (USD Million) By Country (2021-2032)
Figure 12. China Canned Chicken Revenue (USD Million) By Country (2021-2032)
Figure 13. Japan Canned Chicken Revenue (USD Million) By Country (2021-2032)
Figure 14. India Canned Chicken Revenue (USD Million) By Country (2021-2032)
Figure 15. South Korea Canned Chicken Revenue (USD Million) By Country (2021-2032)
Figure 16. Australia Canned Chicken Revenue (USD Million) By Country (2021-2032)
Figure 17. South East Asia Canned Chicken Revenue (USD Million) By Country (2021-2032)
Figure 18. South America Canned Chicken Revenue (USD Million) By Country (2021-2032)
Figure 19. Brazil Canned Chicken Revenue (USD Million) By Country (2021-2032)
Figure 20. Argentina Canned Chicken Revenue (USD Million) By Country (2021-2032)
Figure 21. Rest of Asia Pacific Canned Chicken Revenue (USD Million) By Country (2021-2032)
Figure 22. Middle East and Africa Canned Chicken Revenue (USD Million) By Region (2021-2032)
Figure 23. Saudi Arabia Canned Chicken Revenue (USD Million) By Region (2021-2032)
Figure 24. The UAE Canned Chicken Revenue (USD Million) By Region (2021-2032)
Figure 25. Rest of Middle East Canned Chicken Revenue (USD Million) By Region (2021-2032)
Figure 26. South Africa Canned Chicken Revenue (USD Million) By Region (2021-2032)
Figure 27. Africa Canned Chicken Revenue (USD Million) By Region (2021-2032)
Figure 28. North America Canned Chicken Revenue (USD Million) By Type (2021-2032)
Figure 29. North America Canned Chicken Revenue (USD Million) By Application (2021-2032)
Figure 30. North America Canned Chicken Revenue (USD Million) By Product (2021-2032)
Figure 31. Europe Canned Chicken Revenue (USD Million) By Type (2021-2032)
Figure 32. Europe Canned Chicken Revenue (USD Million) By Application (2021-2032)
Figure 33. Europe Canned Chicken Revenue (USD Million) By Product (2021-2032)
Figure 34. Asia Pacific Canned Chicken Revenue (USD Million) By Type (2021-2032)
Figure 35. Asia Pacific Canned Chicken Revenue (USD Million) By Application (2021-2032)
Figure 36. Asia Pacific Canned Chicken Revenue (USD Million) By Product (2021-2032)
Figure 37. South America Canned Chicken Revenue (USD Million) By Type (2021-2032)
Figure 38. South America Canned Chicken Revenue (USD Million) By Application (2021-2032)
Figure 39. South America Canned Chicken Revenue (USD Million) By Product (2021-2032)
Figure 40. Middle East and Africa Canned Chicken Revenue (USD Million) By Type (2021-2032)
Figure 41. Middle East and Africa Canned Chicken Revenue (USD Million) By Application (2021-2032)
Figure 42. Middle East and Africa Canned Chicken Revenue (USD Million) By Product (2021-2032)
By Type
Fresh
Frozen
By Application
Supermarkets/Hypermarkets
Convenience Stores
Online Retailers
Others
Countries Analyzed
North America (US, Canada, Mexico)
Europe (Germany, UK, France, Spain, Italy, Russia, Rest of Europe)
Asia Pacific (China, India, Japan, South Korea, Australia, South East Asia, Rest of Asia)
South America (Brazil, Argentina, Rest of South America)
Middle East and Africa (Saudi Arabia, UAE, Rest of Middle East, South Africa, Egypt, Rest of Africa)
