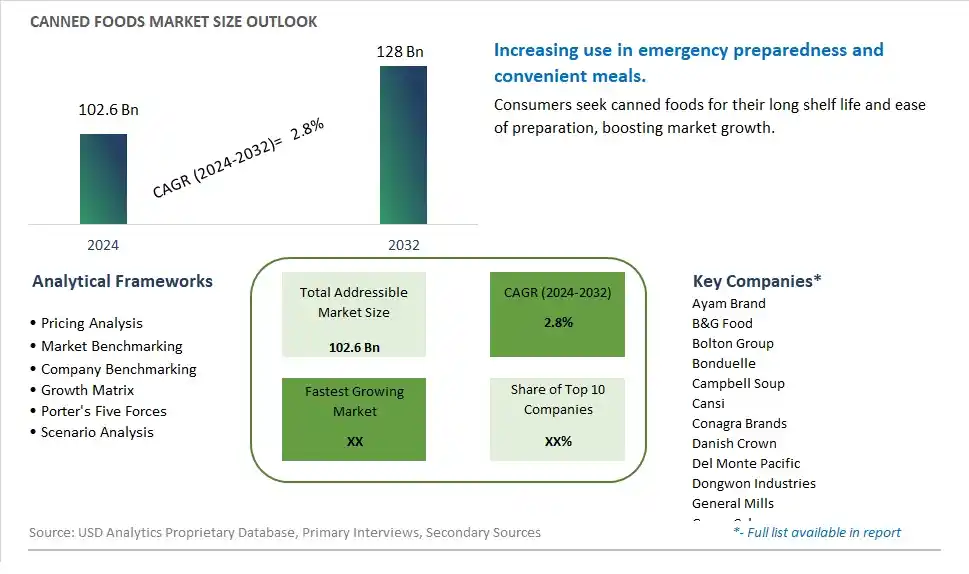
Global Canned Foods Market Size is valued at $102.6 Billion in 2024 and is forecast to register a growth rate (CAGR) of 2.8% to reach $128 Billion by 2032.
The global Canned Foods Market Comprehensive Study analyzes and forecasts the market size across 6 regions and 24 countries for diverse segments -By Type (Fruits, Vegetables, Meat and Poultry, Aquatic Products, Others), By Application (Restaurant, Supermarkets, Department Stores, Online Sales, Others)
An Introduction to Canned Foods Market
In 2024, the Canned Goods market is witnessing significant growth, driven by the increasing demand for convenient, shelf-stable food options that offer long shelf life and ease of preparation. The market includes a wide range of products such as vegetables, fruits, meats, seafood, and ready-to-eat meals. The market is supported by the growing trend towards pantry stocking and meal planning, as consumers seek reliable and nutritious food solutions. Advances in canning technology and preservation methods are enhancing the quality, flavor, and nutritional content of canned goods. The market is also benefiting from the trend towards clean-label and organic products, appealing to health-conscious consumers seeking high-quality, minimally processed foods.
Canned Foods Competitive Landscape
The market report analyses the leading companies in the industry including Ayam Brand, B&G Food, Bolton Group, Bonduelle, Campbell Soup, Cansi, Conagra Brands, Danish Crown, Del Monte Pacific, Dongwon Industries, General Mills, Grupo Calvo, Guangdong Ganzhu, Gulong Food, Hormel Foods, Huanlejia, JBS, Linjiapuzi, Rhodes Food Group, Shanghai Maling, Thai Union Frozen Products, The Kraft Heinz Company, Zi Shan, and Others.
Canned Foods Market Dynamics
Canned Goods Market Trend: Increased Demand for Shelf-Stable Food Products
One prominent market trend for canned goods is the increased demand for shelf-stable food products. Consumers are seeking convenient and long-lasting food options that can be stored for extended periods without compromising quality or taste. Canned goods offer a solution by providing a wide range of food items, including vegetables, fruits, soups, meats, and seafood, that remain fresh and flavorful for an extended shelf life, making them suitable for pantry stocking and emergency preparedness.
Canned Goods Market Driver: Convenience and Versatility in Meal Preparation
The market driver for canned goods is the convenience and versatility they offer in meal preparation. Canned goods provide quick and easy meal solutions, requiring minimal cooking time and effort. They serve as essential pantry staples for busy individuals and families, allowing for quick meal assembly or ingredient additions to various recipes. The versatility of canned goods extends to their use in diverse cuisines, making them a popular choice for consumers looking to create flavorful dishes without extensive cooking skills or time investment.
Canned Goods Market Opportunity: Innovation in Packaging, Healthier Options, and Sustainability
An opportunity within the canned goods market lies in innovation across three key areas: packaging, healthier options, and sustainability. Manufacturers can explore innovative packaging solutions such as easy-open lids, portion-controlled servings, and resealable cans to enhance user convenience and reduce food waste. Introducing healthier options, such as low-sodium varieties, organic ingredients, and preservative-free options, can appeal to health-conscious consumers seeking nutritious alternatives in canned foods. Additionally, adopting sustainable practices in sourcing, production, and packaging can attract environmentally conscious consumers and contribute to long-term market growth. By capitalizing on these opportunities, the canned goods market can continue to evolve and meet evolving consumer preferences.
Canned Foods Market Share Analysis- Largest Segment by Type
The Vegetables segment is the largest in the Canned Foods Market by type. This dominance is driven by the widespread use and high consumption of canned vegetables across various regions. Canned vegetables offer convenience, long shelf life, and affordability, making them a staple in many households. They are used in a variety of dishes and are essential for quick meal preparations, which is particularly appealing to busy consumers. Additionally, the preservation process retains most of the nutritional value of vegetables, making them a practical alternative to fresh produce. The consistent demand for canned vegetables in both developed and developing markets supports their prominent market share. Moreover, the ongoing trend towards healthier eating and the inclusion of vegetables in daily diets further boosts the consumption of canned vegetables.
Canned Foods Market Share Analysis- Fastest Growing Segment by Application
The Online Sales segment is poised to grow the fastest in the Canned Foods Market by application over the next five years. This rapid growth is driven by the increasing consumer shift towards e-commerce and the convenience it offers. Online platforms provide a vast array of canned food options, detailed product information, and customer reviews, enhancing the shopping experience. The COVID-19 pandemic accelerated the adoption of online grocery shopping, and this trend continues as consumers appreciate the convenience and safety of home delivery. Additionally, the integration of subscription services and discounts for online purchases encourages repeat buying. The expansion of e-commerce infrastructure and the growing trust in online transactions support the fast growth of the online sales segment.
Canned Foods Market Segmentation
By Type
Fruits
Vegetables
Meat and Poultry
Aquatic Products
Others
By Application
Restaurant
Supermarkets
Department Stores
Online Sales
Others
Countries Analyzed
North America (US, Canada, Mexico)
Europe (Germany, UK, France, Spain, Italy, Russia, Rest of Europe)
Asia Pacific (China, India, Japan, South Korea, Australia, South East Asia, Rest of Asia)
South America (Brazil, Argentina, Rest of South America)
Middle East and Africa (Saudi Arabia, UAE, Rest of Middle East, South Africa, Egypt, Rest of Africa)
Canned Foods Companies Profiled in the Study
Ayam Brand
B&G Food
Bolton Group
Bonduelle
Campbell Soup
Cansi
Conagra Brands
Danish Crown
Del Monte Pacific
Dongwon Industries
General Mills
Grupo Calvo
Guangdong Ganzhu
Gulong Food
Hormel Foods
Huanlejia
JBS
Linjiapuzi
Rhodes Food Group
Shanghai Maling
Thai Union Frozen Products
The Kraft Heinz Company
Zi Shan
*- List Not Exhaustive
Chapter 1. TABLE OF CONTENTS
Chapter 2. Introduction to Canned Foods Market
2.1. Market Overview
2.2. Key Statistics and Report Highlights
2.3. Scope of the Comprehensive Study
2.3.1. Market Definition
2.3.2 Countries and Regions Covered
2.3.3 Research Objective
2.3.4 Units, Currency, and Conversions
2.3.5 Industry Value Chain
2.4. Key Market Segments
2.5. Key Companies
2.6. Study Period
Chapter 3. Strategic Analysis Review
3.1. Canned Foods Pricing Analysis and Forecast
3.2. Porter’s Five Forces
3.3. Market Ecosystem
3.4. SWOT Analysis
3.5. Regulatory Scenario
3.3. Effects of Inflation, Russia-Ukraine War, moderating economic growth, and other macroeconomic factors
Chapter 4. Competitive Landscape
4.1. Market Share Analysis
4.1.1. Global Canned Foods Market Share by Company, 2023
4.1.2. Product Offerings of Leading Canned Foods Companies
4.2. Market Entropy
4.2.1. New Product Launches in the Industry
4.2.2. Mergers, Acquisitions, Joint ventures, and Partnerships
4.3. Key Strategies and Best Practices
Chapter 5. Global Market Projections: Best, Reference, and Low Case Scenarios
5.1. Growth Analysis- Case Scenario Definitions
5.2. Low Growth Case Scenario Forecasts
5.3. Reference Growth Case Scenario Forecasts
5.4. High Growth Case Scenario Forecasts
Chapter 6. Market Dynamics
6.1. Canned Foods Market Drivers
6.2. Canned Foods Market Challenges
6.6. Canned Foods Market Opportunities
6.4. Canned Foods Market Trends
Chapter 7. Global Canned Foods Market Outlook Trends
7.1. Global Canned Foods Revenue (USD Million) and CAGR (%) by Type (2021-2032)
7.2. Global Canned Foods Revenue (USD Million) and CAGR (%) by Application (2021-2032)
7.3. Global Canned Foods Revenue (USD Million) and CAGR (%) by Product (2021-2032)
By Type
Fruits
Vegetables
Meat and Poultry
Aquatic Products
Others
By Application
Restaurant
Supermarkets
Department Stores
Online Sales
Others
Chapter 8. Global Canned Foods Regional Analysis and Outlook
8.1. Global Canned Foods Revenue (USD Million) By Regions (2021- 2032)
8.2. North America Canned Foods Revenue (USD Million) by Country (2021-2032)
8.2.1. United States Canned Foods Regional Analysis and Outlook
8.2.2. Canada Canned Foods Regional Analysis and Outlook
8.2.3. Mexico Canned Foods Regional Analysis and Outlook
8.3. Europe Canned Foods Revenue (USD Million), by Country (2021-2032)
8.3.1. Germany Canned Foods Regional Analysis and Outlook
8.3.2. France Canned Foods Regional Analysis and Outlook
8.3.3. United Kingdom Canned Foods Regional Analysis and Outlook
8.3.4. Spain Canned Foods Regional Analysis and Outlook
8.3.5. Italy Canned Foods Regional Analysis and Outlook
8.3.6. Russia Canned Foods Regional Analysis and Outlook
8.3.7. Rest of Europe Canned Foods Regional Analysis and Outlook
8.4. Asia Pacific Canned Foods Revenue (USD Million) by Country (2021-2032)
8.4.1. China Canned Foods Regional Analysis and Outlook
8.4.2. Japan Canned Foods Regional Analysis and Outlook
8.4.3. India Canned Foods Regional Analysis and Outlook
8.4.4. South Korea Canned Foods Regional Analysis and Outlook
8.4.5. Australia Canned Foods Regional Analysis and Outlook
8.4.6. South East Asia Canned Foods Regional Analysis and Outlook
8.4.7. Rest of Asia Pacific Canned Foods Regional Analysis and Outlook
8.5. South America Canned Foods Revenue (USD Million), by Country (2021-2032)
8.5.1. Brazil Canned Foods Regional Analysis and Outlook
8.5.2. Argentina Canned Foods Regional Analysis and Outlook
8.5.3. Rest of South America Canned Foods Regional Analysis and Outlook
8.6. Middle East and Africa Canned Foods Revenue (USD Million) by Country (2021-2032)
8.6.1. Middle East Canned Foods Regional Analysis and Outlook
8.6.2. Africa Canned Foods Regional Analysis and Outlook
Chapter 9. North America Canned Foods Analysis and Outlook
9.1. North America Canned Foods Revenue (USD Million) by Segments (2021-2032)
9.1.1. North America Canned Foods Revenue (USD Million) by Type (2021-2032)
9.1.2. North America Canned Foods Revenue (USD Million) by Application (2021-2032)
9.1.3. North America Canned Foods Revenue (USD Million) by Product (2021-2032)
By Type
Fruits
Vegetables
Meat and Poultry
Aquatic Products
Others
By Application
Restaurant
Supermarkets
Department Stores
Online Sales
Others
Chapter 10. Europe Canned Foods Analysis and Outlook
10.1. Europe Canned Foods Revenue (USD Million), by Segments (USD Million) (2021-2032)
10.1.1. Europe Canned Foods Revenue (USD Million) by Type (2021-2032)
10.1.2. Europe Canned Foods Revenue (USD Million) by Application (2021-2032)
10.1.3. Europe Canned Foods Revenue (USD Million) by Product (2021-2032)
By Type
Fruits
Vegetables
Meat and Poultry
Aquatic Products
Others
By Application
Restaurant
Supermarkets
Department Stores
Online Sales
Others
Chapter 11. Asia Pacific Canned Foods Analysis and Outlook
11.1. Asia Pacific Canned Foods Revenue (USD Million), and Revenue (USD Million) by Segments (2021-2032)
11.1.1. Asia Pacific Canned Foods Revenue (USD Million) by Type (2021-2032)
11.1.2. Asia Pacific Canned Foods Revenue (USD Million) by Application (2021-2032)
11.1.3. Asia Pacific Canned Foods Revenue (USD Million) by Product (2021-2032)
By Type
Fruits
Vegetables
Meat and Poultry
Aquatic Products
Others
By Application
Restaurant
Supermarkets
Department Stores
Online Sales
Others
Chapter 12. South America Canned Foods Analysis and Outlook
12.1. South America Canned Foods Revenue (USD Million), by Segments (2021-2032)
12.1.1. South America Canned Foods Revenue (USD Million) by Type (2021-2032)
12.1.2. South America Canned Foods Revenue (USD Million) by Application (2021-2032)
12.1.3. South America Canned Foods Revenue (USD Million) by Product (2021-2032)
By Type
Fruits
Vegetables
Meat and Poultry
Aquatic Products
Others
By Application
Restaurant
Supermarkets
Department Stores
Online Sales
Others
Chapter 13. Middle East and Africa Canned Foods Analysis and Outlook
13.1. Middle East and Africa Canned Foods Revenue (USD Million), by Segments (2021-2032)
13.1.1. Middle East and Africa Canned Foods Revenue (USD Million) by Type (2021-2032)
13.1.2. Middle East and Africa Canned Foods Revenue (USD Million) by Application (2021-2032)
13.1.3. Middle East and Africa Canned Foods Revenue (USD Million) by Product (2021-2032)
By Type
Fruits
Vegetables
Meat and Poultry
Aquatic Products
Others
By Application
Restaurant
Supermarkets
Department Stores
Online Sales
Others
Chapter 14. Canned Foods Company Profiles
14.1 Business Overview
14.2 Product Profiles
14.3 SWOT Profiles
14.5 Recent Developments
14.6 Financial Profile
List of Companies
Ayam Brand
B&G Food
Bolton Group
Bonduelle
Campbell Soup
Cansi
Conagra Brands
Danish Crown
Del Monte Pacific
Dongwon Industries
General Mills
Grupo Calvo
Guangdong Ganzhu
Gulong Food
Hormel Foods
Huanlejia
JBS
Linjiapuzi
Rhodes Food Group
Shanghai Maling
Thai Union Frozen Products
The Kraft Heinz Company
Zi Shan
15. Methodology and Data Sources
15.1 Customization Offerings
15.2 Subscription Services
15.3 Related Reports
15.4 Publisher Expertise
LIST OF TABLES
Table 1 Market Segmentation Analysis
Table 2 Global Canned Foods Market Share of Leading Companies, 2023
Table 3 Product Offerings of Leading Companies
Table 4 Low Growth Scenario Forecasts
Table 5 Reference Case Growth Scenario
Table 6 High Growth Case Scenario
Table 7 Global Canned Foods Revenue (USD Million) And CAGR (%) By Type (2021-2032)
Table 8 Global Canned Foods Revenue (USD Million) And CAGR (%) By Application (2021-2032)
Table 9 Global Canned Foods Revenue (USD Million) And CAGR (%) By Product (2021-2032)
Table 10 Global Canned Foods Market Revenue (USD Million) By Regions (2021-2032)
Table 11 Global Canned Foods Market Share (%) By Regions (2021-2032)
Table 12 North America Canned Foods Revenue (USD Million) By Country (2021-2032)
Table 13 Europe Canned Foods Revenue (USD Million) By Country (2021-2032)
Table 14 Asia Pacific Canned Foods Revenue (USD Million) By Country (2021-2032)
Table 15 South America Canned Foods Revenue (USD Million) By Country (2021-2032)
Table 16 Middle East and Africa Canned Foods Revenue (USD Million) By Region (2021-2032)
Table 17 North America Canned Foods Revenue (USD Million) By Type (2021-2032)
Table 18 North America Canned Foods Revenue (USD Million) By Application (2021-2032)
Table 19 North America Canned Foods Revenue (USD Million) By Product (2021-2032)
Table 20 Europe Canned Foods Revenue (USD Million) By Type (2021-2032)
Table 21 Europe Canned Foods Revenue (USD Million) By Application (2021-2032)
Table 22 Europe Canned Foods Revenue (USD Million) By Product (2021-2032)
Table 23 Asia Pacific Canned Foods Revenue (USD Million) By Type (2021-2032)
Table 24 Asia Pacific Canned Foods Revenue (USD Million) By Application (2021-2032)
Table 25 Asia Pacific Canned Foods Revenue (USD Million) By Product (2021-2032)
Table 26 South America Canned Foods Revenue (USD Million) By Type (2021-2032)
Table 27 South America Canned Foods Revenue (USD Million) By Application (2021-2032)
Table 28 South America Canned Foods Revenue (USD Million) By Product (2021-2032)
Table 29 Middle East and Africa Canned Foods Revenue (USD Million) By Type (2021-2032)
Table 30 Middle East and Africa Canned Foods Revenue (USD Million) By Application (2021-2032)
Table 31 Middle East and Africa Canned Foods Revenue (USD Million) By Product (2021-2032)
LIST OF FIGURES
Figure 1. Market Scope
Figure 2. Pricing Forecasts Per Unit, 2023- 2032
Figure 3. Porter’s Five Forces
Figure 4. Global Canned Foods Market Revenue (USD Million) By Regions (2021-2032)
Figure 5. Global Canned Foods Market Share (%) By Regions (2023)
Figure 6. North America Canned Foods Revenue (USD Million) By Country (2021-2032)
Figure 7. United States Canned Foods Revenue (USD Million) By Country (2021-2032)
Figure 8. Canada Canned Foods Revenue (USD Million) By Country (2021-2032)
Figure 9. Mexico Canned Foods Revenue (USD Million) By Country (2021-2032)
Figure 10. Europe Canned Foods Revenue (USD Million) By Country (2021-2032)
Figure 11. Germany Canned Foods Revenue (USD Million) By Country (2021-2032)
Figure 12. France Canned Foods Revenue (USD Million) By Country (2021-2032)
Figure 13. United Kingdom Canned Foods Revenue (USD Million) By Country (2021-2032)
Figure 14. Spain Canned Foods Revenue (USD Million) By Country (2021-2032)
Figure 15. Italy Canned Foods Revenue (USD Million) By Country (2021-2032)
Figure 16. Russia Canned Foods Revenue (USD Million) By Country (2021-2032)
Figure 17. Rest of Europe Canned Foods Revenue (USD Million) By Country (2021-2032)
Figure 11. Asia Pacific Canned Foods Revenue (USD Million) By Country (2021-2032)
Figure 12. China Canned Foods Revenue (USD Million) By Country (2021-2032)
Figure 13. Japan Canned Foods Revenue (USD Million) By Country (2021-2032)
Figure 14. India Canned Foods Revenue (USD Million) By Country (2021-2032)
Figure 15. South Korea Canned Foods Revenue (USD Million) By Country (2021-2032)
Figure 16. Australia Canned Foods Revenue (USD Million) By Country (2021-2032)
Figure 17. South East Asia Canned Foods Revenue (USD Million) By Country (2021-2032)
Figure 18. South America Canned Foods Revenue (USD Million) By Country (2021-2032)
Figure 19. Brazil Canned Foods Revenue (USD Million) By Country (2021-2032)
Figure 20. Argentina Canned Foods Revenue (USD Million) By Country (2021-2032)
Figure 21. Rest of Asia Pacific Canned Foods Revenue (USD Million) By Country (2021-2032)
Figure 22. Middle East and Africa Canned Foods Revenue (USD Million) By Region (2021-2032)
Figure 23. Saudi Arabia Canned Foods Revenue (USD Million) By Region (2021-2032)
Figure 24. The UAE Canned Foods Revenue (USD Million) By Region (2021-2032)
Figure 25. Rest of Middle East Canned Foods Revenue (USD Million) By Region (2021-2032)
Figure 26. South Africa Canned Foods Revenue (USD Million) By Region (2021-2032)
Figure 27. Africa Canned Foods Revenue (USD Million) By Region (2021-2032)
Figure 28. North America Canned Foods Revenue (USD Million) By Type (2021-2032)
Figure 29. North America Canned Foods Revenue (USD Million) By Application (2021-2032)
Figure 30. North America Canned Foods Revenue (USD Million) By Product (2021-2032)
Figure 31. Europe Canned Foods Revenue (USD Million) By Type (2021-2032)
Figure 32. Europe Canned Foods Revenue (USD Million) By Application (2021-2032)
Figure 33. Europe Canned Foods Revenue (USD Million) By Product (2021-2032)
Figure 34. Asia Pacific Canned Foods Revenue (USD Million) By Type (2021-2032)
Figure 35. Asia Pacific Canned Foods Revenue (USD Million) By Application (2021-2032)
Figure 36. Asia Pacific Canned Foods Revenue (USD Million) By Product (2021-2032)
Figure 37. South America Canned Foods Revenue (USD Million) By Type (2021-2032)
Figure 38. South America Canned Foods Revenue (USD Million) By Application (2021-2032)
Figure 39. South America Canned Foods Revenue (USD Million) By Product (2021-2032)
Figure 40. Middle East and Africa Canned Foods Revenue (USD Million) By Type (2021-2032)
Figure 41. Middle East and Africa Canned Foods Revenue (USD Million) By Application (2021-2032)
Figure 42. Middle East and Africa Canned Foods Revenue (USD Million) By Product (2021-2032)
By Type
Fruits
Vegetables
Meat and Poultry
Aquatic Products
Others
By Application
Restaurant
Supermarkets
Department Stores
Online Sales
Others
Countries Analyzed
North America (US, Canada, Mexico)
Europe (Germany, UK, France, Spain, Italy, Russia, Rest of Europe)
Asia Pacific (China, India, Japan, South Korea, Australia, South East Asia, Rest of Asia)
South America (Brazil, Argentina, Rest of South America)
Middle East and Africa (Saudi Arabia, UAE, Rest of Middle East, South Africa, Egypt, Rest of Africa)
