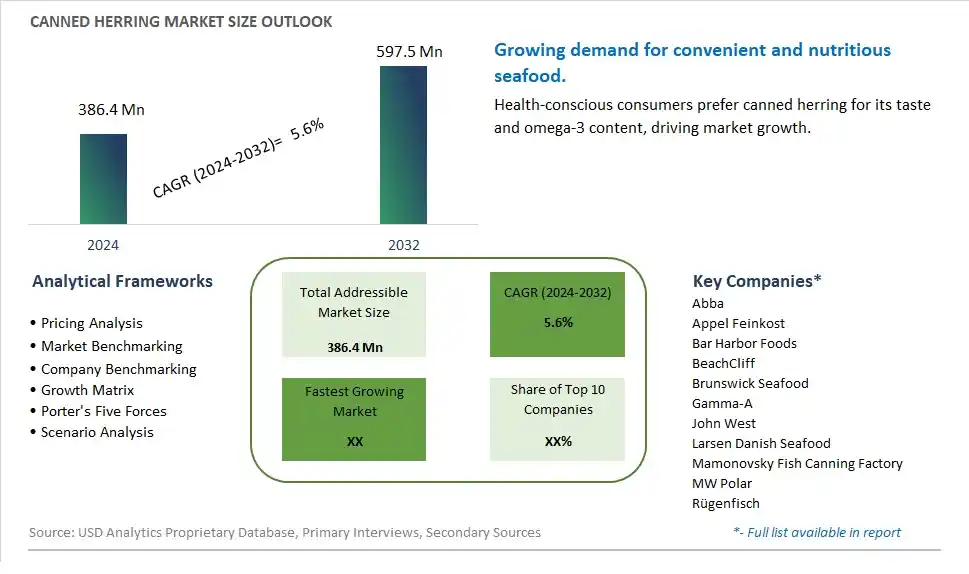
Global Canned Herring Market Size is valued at $386.4 Million in 2024 and is forecast to register a growth rate (CAGR) of 5.6% to reach $597.5 Million by 2032.
The global Canned Herring Market Comprehensive Study analyzes and forecasts the market size across 6 regions and 24 countries for diverse segments -By Type (Tomato Sauce, Hot Sauce, Mustard Sauce, Smoked, Others), By Application (Supermarkets/Hypermarkets, Convenience Stores, Online Retailers, Others)
An Introduction to Canned Herring Market
The Canned Herring market in 2024 is expanding steadily, driven by the increasing demand for nutritious and affordable seafood options. Canned herring, known for its rich omega-3 fatty acids and high protein content, is popular in salads, sandwiches, and various culinary dishes. The market is supported by the growing awareness of the health benefits of fish consumption. Advances in canning technology and sustainable fishing practices are enhancing the quality, flavor, and availability of canned herring. The market is also benefiting from the trend towards convenient and ready-to-eat seafood products, appealing to health-conscious consumers seeking nutrient-dense and easy-to-prepare meal options.
Canned Herring Competitive Landscape
The market report analyses the leading companies in the industry including Abba, Appel Feinkost, Bar Harbor Foods, BeachCliff, Brunswick Seafood, Gamma-A, John West, Larsen Danish Seafood, Mamonovsky Fish Canning Factory, MW Polar, Rügenfisch, and Others.
Canned Herring Market Dynamics
Canned Herring Market Trend: Growing Preference for Seafood Convenience Products
One prominent market trend for canned herring is the growing preference for seafood convenience products. Consumers are increasingly seeking convenient and ready-to-eat seafood options that offer nutritional benefits, flavor, and ease of preparation. Canned herring meets these demands by providing a convenient and shelf-stable seafood option that can be enjoyed as a standalone snack or incorporated into various recipes, appealing to busy individuals and households seeking quick and nutritious meal solutions.
Canned Herring Market Driver: Health Benefits and Nutritional Value
The market driver for canned herring is its health benefits and nutritional value. Herring is rich in omega-3 fatty acids, protein, vitamins, and minerals, making it a nutritious addition to the diet. The rising awareness of the health benefits associated with consuming omega-3 fatty acids, such as heart health support and anti-inflammatory properties, drives the demand for canned herring among health-conscious consumers. Additionally, the convenience of canned herring as a ready-to-eat seafood option further contributes to its market growth.
Canned Herring Market Opportunity: Product Innovation and Diverse Flavors
An opportunity within the canned herring market lies in product innovation and offering diverse flavors. Manufacturers can explore innovative packaging formats, such as easy-open cans and single-serve portions, to enhance convenience and appeal to on-the-go consumers. Introducing a variety of flavor options, including traditional smoked herring, spiced herring, and flavored marinades, can cater to diverse taste preferences and attract a broader consumer base. By capitalizing on product innovation and flavor diversity, the canned herring market can expand its reach and appeal to a wider range of consumers seeking convenient and flavorful seafood options.
Canned Herring Market Share Analysis: Tomato Sauce segment generated the highest revenue share in the industry
The largest segment in the Canned Herring Market is the variety that comes in Tomato Sauce. This particular type of canned herring has gained significant popularity due to several factors. Firstly, the combination of herring with tomato sauce creates a flavorful and savory dish that appeals to a wide range of consumers. The tangy sweetness of the tomato sauce complements the richness of the herring, making it a delicious and satisfying choice for meals. Further, canned herring in tomato sauce offers convenience and versatility in meal preparation. It can be easily incorporated into various recipes such as pasta dishes, salads, sandwiches, and appetizers, enhancing the overall taste profile of the dish. Additionally, the nutritional benefits of herring, rich in omega-3 fatty acids and protein, further contribute to its appeal among health-conscious consumers. As a result of these factors, the Canned Herring in Tomato Sauce segment has emerged as the largest and most preferred choice among consumers in the canned herring market.
Canned Herring Market Share Analysis: Online Retail is the fastest growing segment over the forecast period to 2032
The fastest-growing segment in the Canned Herring Market is the application in Online Retail. This growth can be attributed to several key factors driving the online retail market's expansion. Firstly, the increasing adoption of e-commerce platforms and digital technologies has made it easier for consumers to access a wide range of products, including canned herring, from the comfort of their homes. The convenience of online shopping, with features like doorstep delivery and multiple payment options, has significantly contributed to the growth of this segment. Further, the rising trend of health-conscious consumer preferences has fueled the demand for nutritious and protein-rich foods like herring, prompting consumers to explore online platforms for purchasing such products. Further, online retailers often offer a diverse selection of herring products, including different flavors and packaging sizes, catering to varying consumer needs and preferences. As a result, the Canned Herring in Online Retail segment is experiencing rapid growth and is expected to continue expanding significantly by 2032, driven by convenience, variety, and health-conscious consumer behavior.
Canned Herring Market Segmentation
By Type
Tomato Sauce
Hot Sauce
Mustard Sauce
Smoked
Others
By Application
Supermarkets/Hypermarkets
Convenience Stores
Online Retailers
Others
Countries Analyzed
North America (US, Canada, Mexico)
Europe (Germany, UK, France, Spain, Italy, Russia, Rest of Europe)
Asia Pacific (China, India, Japan, South Korea, Australia, South East Asia, Rest of Asia)
South America (Brazil, Argentina, Rest of South America)
Middle East and Africa (Saudi Arabia, UAE, Rest of Middle East, South Africa, Egypt, Rest of Africa)
Canned Herring Companies Profiled in the Study
Abba
Appel Feinkost
Bar Harbor Foods
BeachCliff
Brunswick Seafood
Gamma-A
John West
Larsen Danish Seafood
Mamonovsky Fish Canning Factory
MW Polar
Rügenfisch
*- List Not Exhaustive
Chapter 1. TABLE OF CONTENTS
Chapter 2. Introduction to Canned Herring Market
2.1. Market Overview
2.2. Key Statistics and Report Highlights
2.3. Scope of the Comprehensive Study
2.3.1. Market Definition
2.3.2 Countries and Regions Covered
2.3.3 Research Objective
2.3.4 Units, Currency, and Conversions
2.3.5 Industry Value Chain
2.4. Key Market Segments
2.5. Key Companies
2.6. Study Period
Chapter 3. Strategic Analysis Review
3.1. Canned Herring Pricing Analysis and Forecast
3.2. Porter’s Five Forces
3.3. Market Ecosystem
3.4. SWOT Analysis
3.5. Regulatory Scenario
3.3. Effects of Inflation, Russia-Ukraine War, moderating economic growth, and other macroeconomic factors
Chapter 4. Competitive Landscape
4.1. Market Share Analysis
4.1.1. Global Canned Herring Market Share by Company, 2023
4.1.2. Product Offerings of Leading Canned Herring Companies
4.2. Market Entropy
4.2.1. New Product Launches in the Industry
4.2.2. Mergers, Acquisitions, Joint ventures, and Partnerships
4.3. Key Strategies and Best Practices
Chapter 5. Global Market Projections: Best, Reference, and Low Case Scenarios
5.1. Growth Analysis- Case Scenario Definitions
5.2. Low Growth Case Scenario Forecasts
5.3. Reference Growth Case Scenario Forecasts
5.4. High Growth Case Scenario Forecasts
Chapter 6. Market Dynamics
6.1. Canned Herring Market Drivers
6.2. Canned Herring Market Challenges
6.6. Canned Herring Market Opportunities
6.4. Canned Herring Market Trends
Chapter 7. Global Canned Herring Market Outlook Trends
7.1. Global Canned Herring Revenue (USD Million) and CAGR (%) by Type (2021-2032)
7.2. Global Canned Herring Revenue (USD Million) and CAGR (%) by Application (2021-2032)
7.3. Global Canned Herring Revenue (USD Million) and CAGR (%) by Product (2021-2032)
By Type
Tomato Sauce
Hot Sauce
Mustard Sauce
Smoked
Others
By Application
Supermarkets/Hypermarkets
Convenience Stores
Online Retailers
Others
Chapter 8. Global Canned Herring Regional Analysis and Outlook
8.1. Global Canned Herring Revenue (USD Million) By Regions (2021- 2032)
8.2. North America Canned Herring Revenue (USD Million) by Country (2021-2032)
8.2.1. United States Canned Herring Regional Analysis and Outlook
8.2.2. Canada Canned Herring Regional Analysis and Outlook
8.2.3. Mexico Canned Herring Regional Analysis and Outlook
8.3. Europe Canned Herring Revenue (USD Million), by Country (2021-2032)
8.3.1. Germany Canned Herring Regional Analysis and Outlook
8.3.2. France Canned Herring Regional Analysis and Outlook
8.3.3. United Kingdom Canned Herring Regional Analysis and Outlook
8.3.4. Spain Canned Herring Regional Analysis and Outlook
8.3.5. Italy Canned Herring Regional Analysis and Outlook
8.3.6. Russia Canned Herring Regional Analysis and Outlook
8.3.7. Rest of Europe Canned Herring Regional Analysis and Outlook
8.4. Asia Pacific Canned Herring Revenue (USD Million) by Country (2021-2032)
8.4.1. China Canned Herring Regional Analysis and Outlook
8.4.2. Japan Canned Herring Regional Analysis and Outlook
8.4.3. India Canned Herring Regional Analysis and Outlook
8.4.4. South Korea Canned Herring Regional Analysis and Outlook
8.4.5. Australia Canned Herring Regional Analysis and Outlook
8.4.6. South East Asia Canned Herring Regional Analysis and Outlook
8.4.7. Rest of Asia Pacific Canned Herring Regional Analysis and Outlook
8.5. South America Canned Herring Revenue (USD Million), by Country (2021-2032)
8.5.1. Brazil Canned Herring Regional Analysis and Outlook
8.5.2. Argentina Canned Herring Regional Analysis and Outlook
8.5.3. Rest of South America Canned Herring Regional Analysis and Outlook
8.6. Middle East and Africa Canned Herring Revenue (USD Million) by Country (2021-2032)
8.6.1. Middle East Canned Herring Regional Analysis and Outlook
8.6.2. Africa Canned Herring Regional Analysis and Outlook
Chapter 9. North America Canned Herring Analysis and Outlook
9.1. North America Canned Herring Revenue (USD Million) by Segments (2021-2032)
9.1.1. North America Canned Herring Revenue (USD Million) by Type (2021-2032)
9.1.2. North America Canned Herring Revenue (USD Million) by Application (2021-2032)
9.1.3. North America Canned Herring Revenue (USD Million) by Product (2021-2032)
By Type
Tomato Sauce
Hot Sauce
Mustard Sauce
Smoked
Others
By Application
Supermarkets/Hypermarkets
Convenience Stores
Online Retailers
Others
Chapter 10. Europe Canned Herring Analysis and Outlook
10.1. Europe Canned Herring Revenue (USD Million), by Segments (USD Million) (2021-2032)
10.1.1. Europe Canned Herring Revenue (USD Million) by Type (2021-2032)
10.1.2. Europe Canned Herring Revenue (USD Million) by Application (2021-2032)
10.1.3. Europe Canned Herring Revenue (USD Million) by Product (2021-2032)
By Type
Tomato Sauce
Hot Sauce
Mustard Sauce
Smoked
Others
By Application
Supermarkets/Hypermarkets
Convenience Stores
Online Retailers
Others
Chapter 11. Asia Pacific Canned Herring Analysis and Outlook
11.1. Asia Pacific Canned Herring Revenue (USD Million), and Revenue (USD Million) by Segments (2021-2032)
11.1.1. Asia Pacific Canned Herring Revenue (USD Million) by Type (2021-2032)
11.1.2. Asia Pacific Canned Herring Revenue (USD Million) by Application (2021-2032)
11.1.3. Asia Pacific Canned Herring Revenue (USD Million) by Product (2021-2032)
By Type
Tomato Sauce
Hot Sauce
Mustard Sauce
Smoked
Others
By Application
Supermarkets/Hypermarkets
Convenience Stores
Online Retailers
Others
Chapter 12. South America Canned Herring Analysis and Outlook
12.1. South America Canned Herring Revenue (USD Million), by Segments (2021-2032)
12.1.1. South America Canned Herring Revenue (USD Million) by Type (2021-2032)
12.1.2. South America Canned Herring Revenue (USD Million) by Application (2021-2032)
12.1.3. South America Canned Herring Revenue (USD Million) by Product (2021-2032)
By Type
Tomato Sauce
Hot Sauce
Mustard Sauce
Smoked
Others
By Application
Supermarkets/Hypermarkets
Convenience Stores
Online Retailers
Others
Chapter 13. Middle East and Africa Canned Herring Analysis and Outlook
13.1. Middle East and Africa Canned Herring Revenue (USD Million), by Segments (2021-2032)
13.1.1. Middle East and Africa Canned Herring Revenue (USD Million) by Type (2021-2032)
13.1.2. Middle East and Africa Canned Herring Revenue (USD Million) by Application (2021-2032)
13.1.3. Middle East and Africa Canned Herring Revenue (USD Million) by Product (2021-2032)
By Type
Tomato Sauce
Hot Sauce
Mustard Sauce
Smoked
Others
By Application
Supermarkets/Hypermarkets
Convenience Stores
Online Retailers
Others
Chapter 14. Canned Herring Company Profiles
14.1 Business Overview
14.2 Product Profiles
14.3 SWOT Profiles
14.5 Recent Developments
14.6 Financial Profile
List of Companies
Abba
Appel Feinkost
Bar Harbor Foods
BeachCliff
Brunswick Seafood
Gamma-A
John West
Larsen Danish Seafood
Mamonovsky Fish Canning Factory
MW Polar
Rügenfisch
15. Methodology and Data Sources
15.1 Customization Offerings
15.2 Subscription Services
15.3 Related Reports
15.4 Publisher Expertise
LIST OF TABLES
Table 1 Market Segmentation Analysis
Table 2 Global Canned Herring Market Share of Leading Companies, 2023
Table 3 Product Offerings of Leading Companies
Table 4 Low Growth Scenario Forecasts
Table 5 Reference Case Growth Scenario
Table 6 High Growth Case Scenario
Table 7 Global Canned Herring Revenue (USD Million) And CAGR (%) By Type (2021-2032)
Table 8 Global Canned Herring Revenue (USD Million) And CAGR (%) By Application (2021-2032)
Table 9 Global Canned Herring Revenue (USD Million) And CAGR (%) By Product (2021-2032)
Table 10 Global Canned Herring Market Revenue (USD Million) By Regions (2021-2032)
Table 11 Global Canned Herring Market Share (%) By Regions (2021-2032)
Table 12 North America Canned Herring Revenue (USD Million) By Country (2021-2032)
Table 13 Europe Canned Herring Revenue (USD Million) By Country (2021-2032)
Table 14 Asia Pacific Canned Herring Revenue (USD Million) By Country (2021-2032)
Table 15 South America Canned Herring Revenue (USD Million) By Country (2021-2032)
Table 16 Middle East and Africa Canned Herring Revenue (USD Million) By Region (2021-2032)
Table 17 North America Canned Herring Revenue (USD Million) By Type (2021-2032)
Table 18 North America Canned Herring Revenue (USD Million) By Application (2021-2032)
Table 19 North America Canned Herring Revenue (USD Million) By Product (2021-2032)
Table 20 Europe Canned Herring Revenue (USD Million) By Type (2021-2032)
Table 21 Europe Canned Herring Revenue (USD Million) By Application (2021-2032)
Table 22 Europe Canned Herring Revenue (USD Million) By Product (2021-2032)
Table 23 Asia Pacific Canned Herring Revenue (USD Million) By Type (2021-2032)
Table 24 Asia Pacific Canned Herring Revenue (USD Million) By Application (2021-2032)
Table 25 Asia Pacific Canned Herring Revenue (USD Million) By Product (2021-2032)
Table 26 South America Canned Herring Revenue (USD Million) By Type (2021-2032)
Table 27 South America Canned Herring Revenue (USD Million) By Application (2021-2032)
Table 28 South America Canned Herring Revenue (USD Million) By Product (2021-2032)
Table 29 Middle East and Africa Canned Herring Revenue (USD Million) By Type (2021-2032)
Table 30 Middle East and Africa Canned Herring Revenue (USD Million) By Application (2021-2032)
Table 31 Middle East and Africa Canned Herring Revenue (USD Million) By Product (2021-2032)
LIST OF FIGURES
Figure 1. Market Scope
Figure 2. Pricing Forecasts Per Unit, 2023- 2032
Figure 3. Porter’s Five Forces
Figure 4. Global Canned Herring Market Revenue (USD Million) By Regions (2021-2032)
Figure 5. Global Canned Herring Market Share (%) By Regions (2023)
Figure 6. North America Canned Herring Revenue (USD Million) By Country (2021-2032)
Figure 7. United States Canned Herring Revenue (USD Million) By Country (2021-2032)
Figure 8. Canada Canned Herring Revenue (USD Million) By Country (2021-2032)
Figure 9. Mexico Canned Herring Revenue (USD Million) By Country (2021-2032)
Figure 10. Europe Canned Herring Revenue (USD Million) By Country (2021-2032)
Figure 11. Germany Canned Herring Revenue (USD Million) By Country (2021-2032)
Figure 12. France Canned Herring Revenue (USD Million) By Country (2021-2032)
Figure 13. United Kingdom Canned Herring Revenue (USD Million) By Country (2021-2032)
Figure 14. Spain Canned Herring Revenue (USD Million) By Country (2021-2032)
Figure 15. Italy Canned Herring Revenue (USD Million) By Country (2021-2032)
Figure 16. Russia Canned Herring Revenue (USD Million) By Country (2021-2032)
Figure 17. Rest of Europe Canned Herring Revenue (USD Million) By Country (2021-2032)
Figure 11. Asia Pacific Canned Herring Revenue (USD Million) By Country (2021-2032)
Figure 12. China Canned Herring Revenue (USD Million) By Country (2021-2032)
Figure 13. Japan Canned Herring Revenue (USD Million) By Country (2021-2032)
Figure 14. India Canned Herring Revenue (USD Million) By Country (2021-2032)
Figure 15. South Korea Canned Herring Revenue (USD Million) By Country (2021-2032)
Figure 16. Australia Canned Herring Revenue (USD Million) By Country (2021-2032)
Figure 17. South East Asia Canned Herring Revenue (USD Million) By Country (2021-2032)
Figure 18. South America Canned Herring Revenue (USD Million) By Country (2021-2032)
Figure 19. Brazil Canned Herring Revenue (USD Million) By Country (2021-2032)
Figure 20. Argentina Canned Herring Revenue (USD Million) By Country (2021-2032)
Figure 21. Rest of Asia Pacific Canned Herring Revenue (USD Million) By Country (2021-2032)
Figure 22. Middle East and Africa Canned Herring Revenue (USD Million) By Region (2021-2032)
Figure 23. Saudi Arabia Canned Herring Revenue (USD Million) By Region (2021-2032)
Figure 24. The UAE Canned Herring Revenue (USD Million) By Region (2021-2032)
Figure 25. Rest of Middle East Canned Herring Revenue (USD Million) By Region (2021-2032)
Figure 26. South Africa Canned Herring Revenue (USD Million) By Region (2021-2032)
Figure 27. Africa Canned Herring Revenue (USD Million) By Region (2021-2032)
Figure 28. North America Canned Herring Revenue (USD Million) By Type (2021-2032)
Figure 29. North America Canned Herring Revenue (USD Million) By Application (2021-2032)
Figure 30. North America Canned Herring Revenue (USD Million) By Product (2021-2032)
Figure 31. Europe Canned Herring Revenue (USD Million) By Type (2021-2032)
Figure 32. Europe Canned Herring Revenue (USD Million) By Application (2021-2032)
Figure 33. Europe Canned Herring Revenue (USD Million) By Product (2021-2032)
Figure 34. Asia Pacific Canned Herring Revenue (USD Million) By Type (2021-2032)
Figure 35. Asia Pacific Canned Herring Revenue (USD Million) By Application (2021-2032)
Figure 36. Asia Pacific Canned Herring Revenue (USD Million) By Product (2021-2032)
Figure 37. South America Canned Herring Revenue (USD Million) By Type (2021-2032)
Figure 38. South America Canned Herring Revenue (USD Million) By Application (2021-2032)
Figure 39. South America Canned Herring Revenue (USD Million) By Product (2021-2032)
Figure 40. Middle East and Africa Canned Herring Revenue (USD Million) By Type (2021-2032)
Figure 41. Middle East and Africa Canned Herring Revenue (USD Million) By Application (2021-2032)
Figure 42. Middle East and Africa Canned Herring Revenue (USD Million) By Product (2021-2032)
By Type
Tomato Sauce
Hot Sauce
Mustard Sauce
Smoked
Others
By Application
Supermarkets/Hypermarkets
Convenience Stores
Online Retailers
Others
Countries Analyzed
North America (US, Canada, Mexico)
Europe (Germany, UK, France, Spain, Italy, Russia, Rest of Europe)
Asia Pacific (China, India, Japan, South Korea, Australia, South East Asia, Rest of Asia)
South America (Brazil, Argentina, Rest of South America)
Middle East and Africa (Saudi Arabia, UAE, Rest of Middle East, South Africa, Egypt, Rest of Africa)
