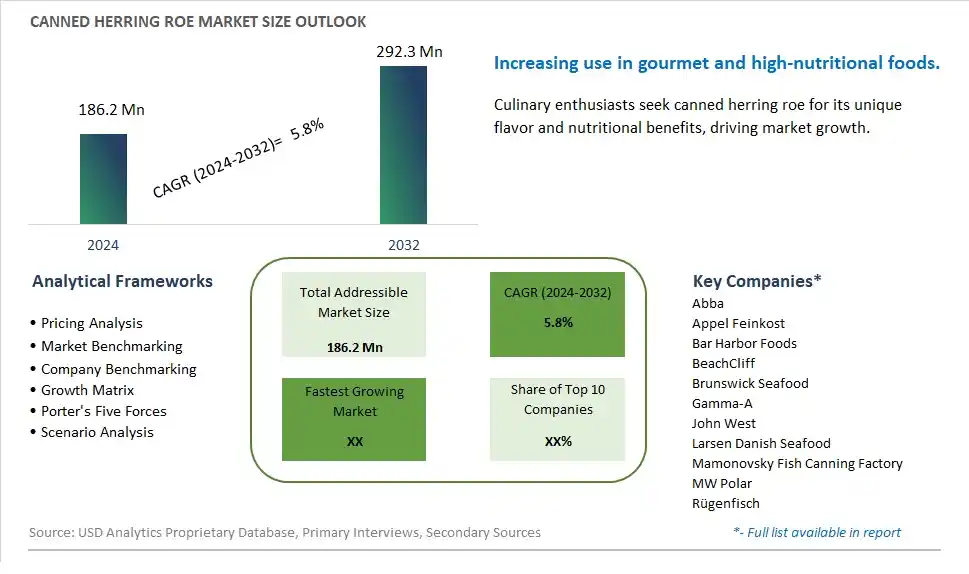
Global Canned Herring Roe Market Size is valued at $186.2 Million in 2024 and is forecast to register a growth rate (CAGR) of 5.8% to reach $292.3 Million by 2032.
The global Canned Herring Roe Market Comprehensive Study analyzes and forecasts the market size across 6 regions and 24 countries for diverse segments -By Type (Canned Sweet Herring Roe, Canned Spicy Herring Roe), By Application (Supermarkets/Hypermarkets, Convenience Stores, Online Retailers, Others)
An Introduction to Canned Herring Roe Market
In 2024, the Canned Herring Roe market is witnessing significant growth, driven by the increasing demand for gourmet and nutritious seafood delicacies. Canned herring roe, prized for its delicate flavor and rich nutrient profile, is used in various culinary applications, including appetizers, salads, and sushi. The market is supported by the growing trend towards premium and specialty foods. Advances in canning and preservation technologies are enhancing the quality, texture, and shelf life of canned herring roe. The market is also benefiting from the trend towards clean-label and sustainably sourced seafood products, appealing to discerning consumers seeking high-quality and ethically produced delicacies.
Canned Herring Roe Competitive Landscape
The market report analyses the leading companies in the industry including Abba, Appel Feinkost, Bar Harbor Foods, BeachCliff, Brunswick Seafood, Gamma-A, John West, Larsen Danish Seafood, Mamonovsky Fish Canning Factory, MW Polar, Rügenfisch, and Others.
Canned Herring Roe Market Dynamics
Canned Herring Roe Market Trend: Growing Demand for Premium Seafood Products
A prominent market trend for canned herring roe is the growing demand for premium seafood products. Consumers are increasingly seeking high-quality and gourmet seafood options, including roe, due to their unique taste, texture, and nutritional value. This trend is driven by the rising interest in culinary exploration and the desire for indulgent yet healthy food experiences, positioning canned herring roe as a desirable choice among seafood enthusiasts and food connoisseurs.
Canned Herring Roe Market Driver: Health Benefits and Culinary Versatility
The market driver for canned herring roe is its health benefits and culinary versatility. Herring roe is rich in omega-3 fatty acids, vitamins, and minerals, making it a nutritious addition to the diet. Its delicate texture and mild flavor also make it a versatile ingredient in various culinary applications, including sushi, salads, spreads, and appetizers. The growing awareness of the health benefits associated with omega-3 fatty acids and the increasing popularity of gourmet cuisine drive the demand for canned herring roe among health-conscious consumers and chefs alike.
Canned Herring Roe Market Opportunity: Premiumization and Product Differentiation
An opportunity within the canned herring roe market lies in premiumization and product differentiation. Manufacturers can focus on offering premium-quality herring roe sourced from sustainable fisheries and processed using high-quality standards to appeal to discerning consumers looking for top-notch seafood products. Additionally, exploring innovative packaging designs, such as convenient single-serve portions or gourmet gift packs, can enhance the product's perceived value and attract premium market segments. By emphasizing premiumization and product differentiation, the canned herring roe market can capitalize on the growing demand for high-quality seafood offerings and cater to consumers seeking elevated culinary experiences.
Canned Herring Roe Market Share Analysis: Canned Sweet Herring Roe segment generated the highest revenue share in the industry
Among the segments in the Canned Herring Roe Market, the largest one is Canned Sweet Herring Roe. This segment has witnessed significant growth owing to several factors. Firstly, sweet herring roe appeals to a broader consumer base due to its mild and palatable flavor profile, making it suitable for various culinary applications. It is often used as a topping or ingredient in salads, sushi, sandwiches, and other dishes, contributing to its popularity among consumers. Further, the growing demand for convenient and ready-to-eat seafood products has boosted the sales of canned sweet herring roe. Consumers appreciate the convenience and versatility offered by canned seafood, especially in busy lifestyles where quick and nutritious meal options are preferred. Additionally, advancements in packaging technology have improved the shelf life and preservation of canned herring roe, ensuring product freshness and quality. As a result, the Canned Sweet Herring Roe segment continues to dominate the market due to its widespread appeal, convenience, and culinary versatility.
Canned Herring Roe Market Share Analysis: Online Retailers is the fastest growing segment over the forecast period to 2032
The fastest-growing segment in the Canned Herring Roe Market is Online Retailers. This growth is primarily driven by shifting consumer preferences towards online shopping channels for food and beverage products. Online retailers offer a convenient and accessible platform for consumers to browse, compare, and purchase canned herring roe products from the comfort of their homes. The increasing adoption of e-commerce platforms, coupled with advancements in logistics and delivery services, has made online shopping more efficient and reliable for perishable goods like canned seafood. Additionally, online retailers often provide a wider variety of products, competitive pricing, and promotional offers, attracting more consumers to choose online channels for their canned herring roe purchases. The convenience of doorstep delivery and the ability to access a diverse range of brands and product variants contribute significantly to the rapid growth of the Online Retailers segment in the Canned Herring Roe Market.
Canned Herring Roe Market Segmentation
By Type
Canned Sweet Herring Roe
Canned Spicy Herring Roe
By Application
Supermarkets/Hypermarkets
Convenience Stores
Online Retailers
Others
Countries Analyzed
North America (US, Canada, Mexico)
Europe (Germany, UK, France, Spain, Italy, Russia, Rest of Europe)
Asia Pacific (China, India, Japan, South Korea, Australia, South East Asia, Rest of Asia)
South America (Brazil, Argentina, Rest of South America)
Middle East and Africa (Saudi Arabia, UAE, Rest of Middle East, South Africa, Egypt, Rest of Africa)
Canned Herring Roe Companies Profiled in the Study
Abba
Appel Feinkost
Bar Harbor Foods
BeachCliff
Brunswick Seafood
Gamma-A
John West
Larsen Danish Seafood
Mamonovsky Fish Canning Factory
MW Polar
Rügenfisch
*- List Not Exhaustive
Chapter 1. TABLE OF CONTENTS
Chapter 2. Introduction to Canned Herring Roe Market
2.1. Market Overview
2.2. Key Statistics and Report Highlights
2.3. Scope of the Comprehensive Study
2.3.1. Market Definition
2.3.2 Countries and Regions Covered
2.3.3 Research Objective
2.3.4 Units, Currency, and Conversions
2.3.5 Industry Value Chain
2.4. Key Market Segments
2.5. Key Companies
2.6. Study Period
Chapter 3. Strategic Analysis Review
3.1. Canned Herring Roe Pricing Analysis and Forecast
3.2. Porter’s Five Forces
3.3. Market Ecosystem
3.4. SWOT Analysis
3.5. Regulatory Scenario
3.3. Effects of Inflation, Russia-Ukraine War, moderating economic growth, and other macroeconomic factors
Chapter 4. Competitive Landscape
4.1. Market Share Analysis
4.1.1. Global Canned Herring Roe Market Share by Company, 2023
4.1.2. Product Offerings of Leading Canned Herring Roe Companies
4.2. Market Entropy
4.2.1. New Product Launches in the Industry
4.2.2. Mergers, Acquisitions, Joint ventures, and Partnerships
4.3. Key Strategies and Best Practices
Chapter 5. Global Market Projections: Best, Reference, and Low Case Scenarios
5.1. Growth Analysis- Case Scenario Definitions
5.2. Low Growth Case Scenario Forecasts
5.3. Reference Growth Case Scenario Forecasts
5.4. High Growth Case Scenario Forecasts
Chapter 6. Market Dynamics
6.1. Canned Herring Roe Market Drivers
6.2. Canned Herring Roe Market Challenges
6.6. Canned Herring Roe Market Opportunities
6.4. Canned Herring Roe Market Trends
Chapter 7. Global Canned Herring Roe Market Outlook Trends
7.1. Global Canned Herring Roe Revenue (USD Million) and CAGR (%) by Type (2021-2032)
7.2. Global Canned Herring Roe Revenue (USD Million) and CAGR (%) by Application (2021-2032)
7.3. Global Canned Herring Roe Revenue (USD Million) and CAGR (%) by Product (2021-2032)
By Type
Canned Sweet Herring Roe
Canned Spicy Herring Roe
By Application
Supermarkets/Hypermarkets
Convenience Stores
Online Retailers
Others
Chapter 8. Global Canned Herring Roe Regional Analysis and Outlook
8.1. Global Canned Herring Roe Revenue (USD Million) By Regions (2021- 2032)
8.2. North America Canned Herring Roe Revenue (USD Million) by Country (2021-2032)
8.2.1. United States Canned Herring Roe Regional Analysis and Outlook
8.2.2. Canada Canned Herring Roe Regional Analysis and Outlook
8.2.3. Mexico Canned Herring Roe Regional Analysis and Outlook
8.3. Europe Canned Herring Roe Revenue (USD Million), by Country (2021-2032)
8.3.1. Germany Canned Herring Roe Regional Analysis and Outlook
8.3.2. France Canned Herring Roe Regional Analysis and Outlook
8.3.3. United Kingdom Canned Herring Roe Regional Analysis and Outlook
8.3.4. Spain Canned Herring Roe Regional Analysis and Outlook
8.3.5. Italy Canned Herring Roe Regional Analysis and Outlook
8.3.6. Russia Canned Herring Roe Regional Analysis and Outlook
8.3.7. Rest of Europe Canned Herring Roe Regional Analysis and Outlook
8.4. Asia Pacific Canned Herring Roe Revenue (USD Million) by Country (2021-2032)
8.4.1. China Canned Herring Roe Regional Analysis and Outlook
8.4.2. Japan Canned Herring Roe Regional Analysis and Outlook
8.4.3. India Canned Herring Roe Regional Analysis and Outlook
8.4.4. South Korea Canned Herring Roe Regional Analysis and Outlook
8.4.5. Australia Canned Herring Roe Regional Analysis and Outlook
8.4.6. South East Asia Canned Herring Roe Regional Analysis and Outlook
8.4.7. Rest of Asia Pacific Canned Herring Roe Regional Analysis and Outlook
8.5. South America Canned Herring Roe Revenue (USD Million), by Country (2021-2032)
8.5.1. Brazil Canned Herring Roe Regional Analysis and Outlook
8.5.2. Argentina Canned Herring Roe Regional Analysis and Outlook
8.5.3. Rest of South America Canned Herring Roe Regional Analysis and Outlook
8.6. Middle East and Africa Canned Herring Roe Revenue (USD Million) by Country (2021-2032)
8.6.1. Middle East Canned Herring Roe Regional Analysis and Outlook
8.6.2. Africa Canned Herring Roe Regional Analysis and Outlook
Chapter 9. North America Canned Herring Roe Analysis and Outlook
9.1. North America Canned Herring Roe Revenue (USD Million) by Segments (2021-2032)
9.1.1. North America Canned Herring Roe Revenue (USD Million) by Type (2021-2032)
9.1.2. North America Canned Herring Roe Revenue (USD Million) by Application (2021-2032)
9.1.3. North America Canned Herring Roe Revenue (USD Million) by Product (2021-2032)
By Type
Canned Sweet Herring Roe
Canned Spicy Herring Roe
By Application
Supermarkets/Hypermarkets
Convenience Stores
Online Retailers
Others
Chapter 10. Europe Canned Herring Roe Analysis and Outlook
10.1. Europe Canned Herring Roe Revenue (USD Million), by Segments (USD Million) (2021-2032)
10.1.1. Europe Canned Herring Roe Revenue (USD Million) by Type (2021-2032)
10.1.2. Europe Canned Herring Roe Revenue (USD Million) by Application (2021-2032)
10.1.3. Europe Canned Herring Roe Revenue (USD Million) by Product (2021-2032)
By Type
Canned Sweet Herring Roe
Canned Spicy Herring Roe
By Application
Supermarkets/Hypermarkets
Convenience Stores
Online Retailers
Others
Chapter 11. Asia Pacific Canned Herring Roe Analysis and Outlook
11.1. Asia Pacific Canned Herring Roe Revenue (USD Million), and Revenue (USD Million) by Segments (2021-2032)
11.1.1. Asia Pacific Canned Herring Roe Revenue (USD Million) by Type (2021-2032)
11.1.2. Asia Pacific Canned Herring Roe Revenue (USD Million) by Application (2021-2032)
11.1.3. Asia Pacific Canned Herring Roe Revenue (USD Million) by Product (2021-2032)
By Type
Canned Sweet Herring Roe
Canned Spicy Herring Roe
By Application
Supermarkets/Hypermarkets
Convenience Stores
Online Retailers
Others
Chapter 12. South America Canned Herring Roe Analysis and Outlook
12.1. South America Canned Herring Roe Revenue (USD Million), by Segments (2021-2032)
12.1.1. South America Canned Herring Roe Revenue (USD Million) by Type (2021-2032)
12.1.2. South America Canned Herring Roe Revenue (USD Million) by Application (2021-2032)
12.1.3. South America Canned Herring Roe Revenue (USD Million) by Product (2021-2032)
By Type
Canned Sweet Herring Roe
Canned Spicy Herring Roe
By Application
Supermarkets/Hypermarkets
Convenience Stores
Online Retailers
Others
Chapter 13. Middle East and Africa Canned Herring Roe Analysis and Outlook
13.1. Middle East and Africa Canned Herring Roe Revenue (USD Million), by Segments (2021-2032)
13.1.1. Middle East and Africa Canned Herring Roe Revenue (USD Million) by Type (2021-2032)
13.1.2. Middle East and Africa Canned Herring Roe Revenue (USD Million) by Application (2021-2032)
13.1.3. Middle East and Africa Canned Herring Roe Revenue (USD Million) by Product (2021-2032)
By Type
Canned Sweet Herring Roe
Canned Spicy Herring Roe
By Application
Supermarkets/Hypermarkets
Convenience Stores
Online Retailers
Others
Chapter 14. Canned Herring Roe Company Profiles
14.1 Business Overview
14.2 Product Profiles
14.3 SWOT Profiles
14.5 Recent Developments
14.6 Financial Profile
List of Companies
Abba
Appel Feinkost
Bar Harbor Foods
BeachCliff
Brunswick Seafood
Gamma-A
John West
Larsen Danish Seafood
Mamonovsky Fish Canning Factory
MW Polar
Rügenfisch
15. Methodology and Data Sources
15.1 Customization Offerings
15.2 Subscription Services
15.3 Related Reports
15.4 Publisher Expertise
LIST OF TABLES
Table 1 Market Segmentation Analysis
Table 2 Global Canned Herring Roe Market Share of Leading Companies, 2023
Table 3 Product Offerings of Leading Companies
Table 4 Low Growth Scenario Forecasts
Table 5 Reference Case Growth Scenario
Table 6 High Growth Case Scenario
Table 7 Global Canned Herring Roe Revenue (USD Million) And CAGR (%) By Type (2021-2032)
Table 8 Global Canned Herring Roe Revenue (USD Million) And CAGR (%) By Application (2021-2032)
Table 9 Global Canned Herring Roe Revenue (USD Million) And CAGR (%) By Product (2021-2032)
Table 10 Global Canned Herring Roe Market Revenue (USD Million) By Regions (2021-2032)
Table 11 Global Canned Herring Roe Market Share (%) By Regions (2021-2032)
Table 12 North America Canned Herring Roe Revenue (USD Million) By Country (2021-2032)
Table 13 Europe Canned Herring Roe Revenue (USD Million) By Country (2021-2032)
Table 14 Asia Pacific Canned Herring Roe Revenue (USD Million) By Country (2021-2032)
Table 15 South America Canned Herring Roe Revenue (USD Million) By Country (2021-2032)
Table 16 Middle East and Africa Canned Herring Roe Revenue (USD Million) By Region (2021-2032)
Table 17 North America Canned Herring Roe Revenue (USD Million) By Type (2021-2032)
Table 18 North America Canned Herring Roe Revenue (USD Million) By Application (2021-2032)
Table 19 North America Canned Herring Roe Revenue (USD Million) By Product (2021-2032)
Table 20 Europe Canned Herring Roe Revenue (USD Million) By Type (2021-2032)
Table 21 Europe Canned Herring Roe Revenue (USD Million) By Application (2021-2032)
Table 22 Europe Canned Herring Roe Revenue (USD Million) By Product (2021-2032)
Table 23 Asia Pacific Canned Herring Roe Revenue (USD Million) By Type (2021-2032)
Table 24 Asia Pacific Canned Herring Roe Revenue (USD Million) By Application (2021-2032)
Table 25 Asia Pacific Canned Herring Roe Revenue (USD Million) By Product (2021-2032)
Table 26 South America Canned Herring Roe Revenue (USD Million) By Type (2021-2032)
Table 27 South America Canned Herring Roe Revenue (USD Million) By Application (2021-2032)
Table 28 South America Canned Herring Roe Revenue (USD Million) By Product (2021-2032)
Table 29 Middle East and Africa Canned Herring Roe Revenue (USD Million) By Type (2021-2032)
Table 30 Middle East and Africa Canned Herring Roe Revenue (USD Million) By Application (2021-2032)
Table 31 Middle East and Africa Canned Herring Roe Revenue (USD Million) By Product (2021-2032)
LIST OF FIGURES
Figure 1. Market Scope
Figure 2. Pricing Forecasts Per Unit, 2023- 2032
Figure 3. Porter’s Five Forces
Figure 4. Global Canned Herring Roe Market Revenue (USD Million) By Regions (2021-2032)
Figure 5. Global Canned Herring Roe Market Share (%) By Regions (2023)
Figure 6. North America Canned Herring Roe Revenue (USD Million) By Country (2021-2032)
Figure 7. United States Canned Herring Roe Revenue (USD Million) By Country (2021-2032)
Figure 8. Canada Canned Herring Roe Revenue (USD Million) By Country (2021-2032)
Figure 9. Mexico Canned Herring Roe Revenue (USD Million) By Country (2021-2032)
Figure 10. Europe Canned Herring Roe Revenue (USD Million) By Country (2021-2032)
Figure 11. Germany Canned Herring Roe Revenue (USD Million) By Country (2021-2032)
Figure 12. France Canned Herring Roe Revenue (USD Million) By Country (2021-2032)
Figure 13. United Kingdom Canned Herring Roe Revenue (USD Million) By Country (2021-2032)
Figure 14. Spain Canned Herring Roe Revenue (USD Million) By Country (2021-2032)
Figure 15. Italy Canned Herring Roe Revenue (USD Million) By Country (2021-2032)
Figure 16. Russia Canned Herring Roe Revenue (USD Million) By Country (2021-2032)
Figure 17. Rest of Europe Canned Herring Roe Revenue (USD Million) By Country (2021-2032)
Figure 11. Asia Pacific Canned Herring Roe Revenue (USD Million) By Country (2021-2032)
Figure 12. China Canned Herring Roe Revenue (USD Million) By Country (2021-2032)
Figure 13. Japan Canned Herring Roe Revenue (USD Million) By Country (2021-2032)
Figure 14. India Canned Herring Roe Revenue (USD Million) By Country (2021-2032)
Figure 15. South Korea Canned Herring Roe Revenue (USD Million) By Country (2021-2032)
Figure 16. Australia Canned Herring Roe Revenue (USD Million) By Country (2021-2032)
Figure 17. South East Asia Canned Herring Roe Revenue (USD Million) By Country (2021-2032)
Figure 18. South America Canned Herring Roe Revenue (USD Million) By Country (2021-2032)
Figure 19. Brazil Canned Herring Roe Revenue (USD Million) By Country (2021-2032)
Figure 20. Argentina Canned Herring Roe Revenue (USD Million) By Country (2021-2032)
Figure 21. Rest of Asia Pacific Canned Herring Roe Revenue (USD Million) By Country (2021-2032)
Figure 22. Middle East and Africa Canned Herring Roe Revenue (USD Million) By Region (2021-2032)
Figure 23. Saudi Arabia Canned Herring Roe Revenue (USD Million) By Region (2021-2032)
Figure 24. The UAE Canned Herring Roe Revenue (USD Million) By Region (2021-2032)
Figure 25. Rest of Middle East Canned Herring Roe Revenue (USD Million) By Region (2021-2032)
Figure 26. South Africa Canned Herring Roe Revenue (USD Million) By Region (2021-2032)
Figure 27. Africa Canned Herring Roe Revenue (USD Million) By Region (2021-2032)
Figure 28. North America Canned Herring Roe Revenue (USD Million) By Type (2021-2032)
Figure 29. North America Canned Herring Roe Revenue (USD Million) By Application (2021-2032)
Figure 30. North America Canned Herring Roe Revenue (USD Million) By Product (2021-2032)
Figure 31. Europe Canned Herring Roe Revenue (USD Million) By Type (2021-2032)
Figure 32. Europe Canned Herring Roe Revenue (USD Million) By Application (2021-2032)
Figure 33. Europe Canned Herring Roe Revenue (USD Million) By Product (2021-2032)
Figure 34. Asia Pacific Canned Herring Roe Revenue (USD Million) By Type (2021-2032)
Figure 35. Asia Pacific Canned Herring Roe Revenue (USD Million) By Application (2021-2032)
Figure 36. Asia Pacific Canned Herring Roe Revenue (USD Million) By Product (2021-2032)
Figure 37. South America Canned Herring Roe Revenue (USD Million) By Type (2021-2032)
Figure 38. South America Canned Herring Roe Revenue (USD Million) By Application (2021-2032)
Figure 39. South America Canned Herring Roe Revenue (USD Million) By Product (2021-2032)
Figure 40. Middle East and Africa Canned Herring Roe Revenue (USD Million) By Type (2021-2032)
Figure 41. Middle East and Africa Canned Herring Roe Revenue (USD Million) By Application (2021-2032)
Figure 42. Middle East and Africa Canned Herring Roe Revenue (USD Million) By Product (2021-2032)
By Type
Canned Sweet Herring Roe
Canned Spicy Herring Roe
By Application
Supermarkets/Hypermarkets
Convenience Stores
Online Retailers
Others
Countries Analyzed
North America (US, Canada, Mexico)
Europe (Germany, UK, France, Spain, Italy, Russia, Rest of Europe)
Asia Pacific (China, India, Japan, South Korea, Australia, South East Asia, Rest of Asia)
South America (Brazil, Argentina, Rest of South America)
Middle East and Africa (Saudi Arabia, UAE, Rest of Middle East, South Africa, Egypt, Rest of Africa)
