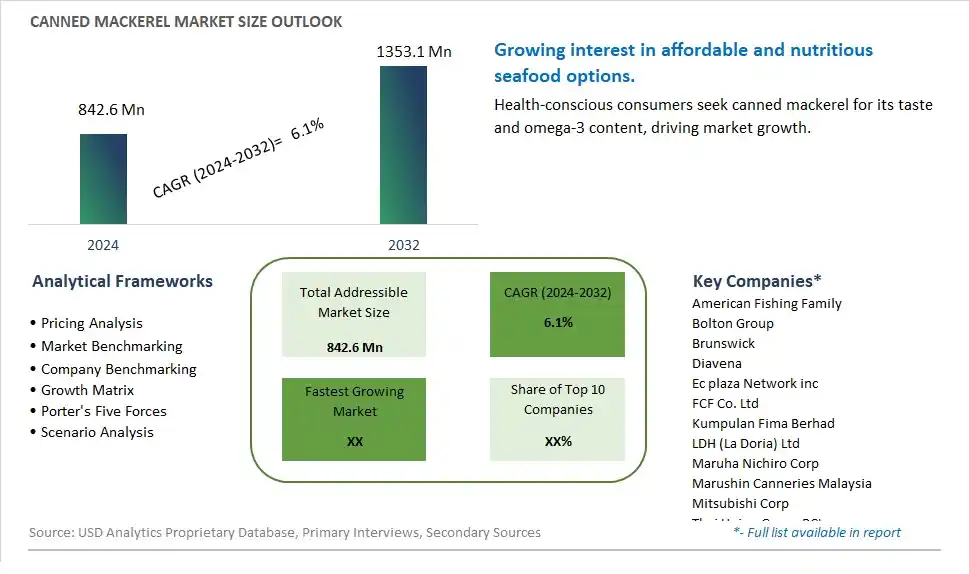
Global Canned Mackerel Market Size is valued at $842.6 Million in 2024 and is forecast to register a growth rate (CAGR) of 6.1% to reach $1353.1 Million by 2032.
The global Canned Mackerel Market Comprehensive Study analyzes and forecasts the market size across 6 regions and 24 countries for diverse segments -By Processing (Oil, Sauce, Others), By Application (Household, Commercial), By Distribution Channel (Supermarkets/Hypermarkets, Convenience stores, Specialty stores, Online sales channel)
An Introduction to Canned Mackerel Market
In 2024, the Canned Mackerel market is witnessing robust growth, driven by the increasing demand for nutritious and affordable seafood options. Canned mackerel, valued for its high omega-3 fatty acids and protein content, is popular in salads, sandwiches, and various cooked dishes. The market is supported by the growing awareness of the health benefits of fish consumption and the trend towards sustainable seafood. Advances in canning technology and sustainable fishing practices are enhancing the quality, flavor, and availability of canned mackerel. The market is also benefiting from the trend towards convenient and ready-to-eat seafood products, appealing to health-conscious consumers seeking easy-to-prepare meal options.
Canned Mackerel Competitive Landscape
The market report analyses the leading companies in the industry including American Fishing Family, Bolton Group, Brunswick, Diavena, Ec plaza Network inc, FCF Co. Ltd, Kumpulan Fima Berhad, LDH (La Doria) Ltd, Maruha Nichiro Corp, Marushin Canneries Malaysia, Mitsubishi Corp, Thai Union Group PCL, Tropical food Manufacturing co., Universal Canning Inc, Xiamen Amoytop Import & Export Co. Ltd, and Others.
Canned Mackerel Market Dynamics
Canned Mackerel Market Trend: Growing Preference for Seafood and Healthy Protein Sources
A prominent market trend for canned mackerel is the growing preference for seafood and healthy protein sources among consumers. With increased awareness of the health benefits associated with seafood consumption, including omega-3 fatty acids and lean protein content, there is a rising demand for convenient seafood options like canned mackerel. This trend is driven by health-conscious consumers seeking nutritious and sustainable food choices, positioning canned mackerel as a popular option in the seafood market segment.
Canned Mackerel Market Driver: Convenience, Long Shelf Life, and Easy Storage
The market driver for canned mackerel is its convenience, long shelf life, and easy storage. Canned mackerel offers a convenient and ready-to-eat seafood option that requires minimal preparation, making it ideal for busy lifestyles and on-the-go meals. Its long shelf life ensures product stability and quality preservation, reducing food waste and providing consumers with a pantry staple that can be stored for an extended period. The ease of storage and portability further contribute to its market appeal, driving demand among consumers looking for hassle-free meal solutions.
Canned Mackerel Market Opportunity: Flavor Innovation and Culinary Versatility
An opportunity within the canned mackerel market lies in flavor innovation and culinary versatility. Manufacturers can explore developing canned mackerel products in various flavor profiles, such as smoked, seasoned, or infused with herbs and spices, to cater to diverse consumer preferences and culinary trends. Additionally, highlighting the culinary versatility of canned mackerel in recipes like salads, sandwiches, pasta dishes, and sushi rolls can expand its usage beyond traditional applications, appealing to a wider range of consumers and culinary enthusiasts. By leveraging flavor diversity and culinary adaptability, the canned mackerel market can capitalize on consumer demand for flavorful, healthy, and convenient seafood options, driving market growth and differentiation.
Canned Mackerel Market Share Analysis: Oil Processing segment generated the highest revenue share in the industry
The largest segment in the Canned Mackerel Market is Oil Processing. This segment's prominence stems from several factors that make oil processing a preferred method for preserving and enhancing the flavor of mackerel. Oil processing involves immersing mackerel in oil, vegetable or olive oil, which acts as a preservative and helps maintain the fish's moisture and texture. The oil also imparts a rich flavor to the mackerel, enhancing its taste and making it more palatable to consumers. Additionally, oil processing extends the shelf life of mackerel, allowing for longer storage periods without compromising quality. The convenience of canned mackerel in oil, its versatility in culinary applications, and the perception of oil-preserved mackerel as a healthy source of omega-3 fatty acids contribute to its popularity among consumers. These factors collectively contribute to oil processing being the largest and most significant processing method in the Canned Mackerel Market.
Canned Mackerel Market Share Analysis: Household Application is the fastest growing segment over the forecast period to 2032
The fastest-growing segment in the Canned Mackerel Market is the Household Application segment. This surge in demand can be attributed to several key factors. Firstly, the increasing awareness among consumers about the health benefits of consuming fish, particularly oily fish like mackerel rich in omega-3 fatty acids, has driven households to incorporate more canned mackerel into their diets. This trend is further fueled by the growing emphasis on convenient and ready-to-eat food options, especially in busy urban lifestyles, where canned mackerel provides a quick and nutritious meal solution. Additionally, advancements in packaging technology have improved the shelf stability and convenience of canned mackerel products, making them more appealing to households seeking long-lasting and easy-to-store food options. The versatility of canned mackerel in various culinary preparations, including salads, sandwiches, and pasta dishes, also contributes to its popularity among households. These factors combined indicate a rapid growth trajectory for the Household Application segment in the Canned Mackerel Market, making it a pivotal focus area for industry players.
Canned Mackerel Market Share Analysis: Supermarkets/Hypermarkets segment generated the highest revenue share in the industry
The largest segment in the Canned Mackerel Market is the Supermarkets/Hypermarkets distribution channel. This segment holds a dominant position due to several key factors driving its growth. Firstly, supermarkets and hypermarkets offer a wide range of canned mackerel brands and varieties, providing consumers with ample choices and convenience in their shopping experience. These retail outlets benefit from high foot traffic and extensive marketing efforts, leading to increased visibility and sales of canned mackerel products. Further, supermarkets and hypermarkets often run promotional campaigns, discounts, and bundle offers, attracting budget-conscious consumers and further boosting sales volume. The trust and reliability associated with established supermarket chains also play a crucial role in driving consumer preference for purchasing canned mackerel from these outlets. With the convenience, variety, and promotional strategies offered by supermarkets and hypermarkets, this distribution channel continues to dominate the Canned Mackerel Market and is expected to witness sustained growth in the coming years.
Canned Mackerel Market Segmentation
By Processing
Oil
Sauce
Others
By Application
Household
Commercial
By Distribution Channel
Supermarkets/Hypermarkets
Convenience stores
Specialty stores
Online sales channel
Countries Analyzed
North America (US, Canada, Mexico)
Europe (Germany, UK, France, Spain, Italy, Russia, Rest of Europe)
Asia Pacific (China, India, Japan, South Korea, Australia, South East Asia, Rest of Asia)
South America (Brazil, Argentina, Rest of South America)
Middle East and Africa (Saudi Arabia, UAE, Rest of Middle East, South Africa, Egypt, Rest of Africa)
Canned Mackerel Companies Profiled in the Study
American Fishing Family
Bolton Group
Brunswick
Diavena
Ec plaza Network inc
FCF Co. Ltd
Kumpulan Fima Berhad
LDH (La Doria) Ltd
Maruha Nichiro Corp
Marushin Canneries Malaysia
Mitsubishi Corp
Thai Union Group PCL
Tropical food Manufacturing co.
Universal Canning Inc
Xiamen Amoytop Import & Export Co. Ltd
*- List Not Exhaustive
Chapter 1. TABLE OF CONTENTS
Chapter 2. Introduction to Canned Mackerel Market
2.1. Market Overview
2.2. Key Statistics and Report Highlights
2.3. Scope of the Comprehensive Study
2.3.1. Market Definition
2.3.2 Countries and Regions Covered
2.3.3 Research Objective
2.3.4 Units, Currency, and Conversions
2.3.5 Industry Value Chain
2.4. Key Market Segments
2.5. Key Companies
2.6. Study Period
Chapter 3. Strategic Analysis Review
3.1. Canned Mackerel Pricing Analysis and Forecast
3.2. Porter’s Five Forces
3.3. Market Ecosystem
3.4. SWOT Analysis
3.5. Regulatory Scenario
3.3. Effects of Inflation, Russia-Ukraine War, moderating economic growth, and other macroeconomic factors
Chapter 4. Competitive Landscape
4.1. Market Share Analysis
4.1.1. Global Canned Mackerel Market Share by Company, 2023
4.1.2. Product Offerings of Leading Canned Mackerel Companies
4.2. Market Entropy
4.2.1. New Product Launches in the Industry
4.2.2. Mergers, Acquisitions, Joint ventures, and Partnerships
4.3. Key Strategies and Best Practices
Chapter 5. Global Market Projections: Best, Reference, and Low Case Scenarios
5.1. Growth Analysis- Case Scenario Definitions
5.2. Low Growth Case Scenario Forecasts
5.3. Reference Growth Case Scenario Forecasts
5.4. High Growth Case Scenario Forecasts
Chapter 6. Market Dynamics
6.1. Canned Mackerel Market Drivers
6.2. Canned Mackerel Market Challenges
6.6. Canned Mackerel Market Opportunities
6.4. Canned Mackerel Market Trends
Chapter 7. Global Canned Mackerel Market Outlook Trends
7.1. Global Canned Mackerel Revenue (USD Million) and CAGR (%) by Type (2021-2032)
7.2. Global Canned Mackerel Revenue (USD Million) and CAGR (%) by Application (2021-2032)
7.3. Global Canned Mackerel Revenue (USD Million) and CAGR (%) by Product (2021-2032)
By Processing
Oil
Sauce
Others
By Application
Household
Commercial
By Distribution Channel
Supermarkets/Hypermarkets
Convenience stores
Specialty stores
Online sales channel
Chapter 8. Global Canned Mackerel Regional Analysis and Outlook
8.1. Global Canned Mackerel Revenue (USD Million) By Regions (2021- 2032)
8.2. North America Canned Mackerel Revenue (USD Million) by Country (2021-2032)
8.2.1. United States Canned Mackerel Regional Analysis and Outlook
8.2.2. Canada Canned Mackerel Regional Analysis and Outlook
8.2.3. Mexico Canned Mackerel Regional Analysis and Outlook
8.3. Europe Canned Mackerel Revenue (USD Million), by Country (2021-2032)
8.3.1. Germany Canned Mackerel Regional Analysis and Outlook
8.3.2. France Canned Mackerel Regional Analysis and Outlook
8.3.3. United Kingdom Canned Mackerel Regional Analysis and Outlook
8.3.4. Spain Canned Mackerel Regional Analysis and Outlook
8.3.5. Italy Canned Mackerel Regional Analysis and Outlook
8.3.6. Russia Canned Mackerel Regional Analysis and Outlook
8.3.7. Rest of Europe Canned Mackerel Regional Analysis and Outlook
8.4. Asia Pacific Canned Mackerel Revenue (USD Million) by Country (2021-2032)
8.4.1. China Canned Mackerel Regional Analysis and Outlook
8.4.2. Japan Canned Mackerel Regional Analysis and Outlook
8.4.3. India Canned Mackerel Regional Analysis and Outlook
8.4.4. South Korea Canned Mackerel Regional Analysis and Outlook
8.4.5. Australia Canned Mackerel Regional Analysis and Outlook
8.4.6. South East Asia Canned Mackerel Regional Analysis and Outlook
8.4.7. Rest of Asia Pacific Canned Mackerel Regional Analysis and Outlook
8.5. South America Canned Mackerel Revenue (USD Million), by Country (2021-2032)
8.5.1. Brazil Canned Mackerel Regional Analysis and Outlook
8.5.2. Argentina Canned Mackerel Regional Analysis and Outlook
8.5.3. Rest of South America Canned Mackerel Regional Analysis and Outlook
8.6. Middle East and Africa Canned Mackerel Revenue (USD Million) by Country (2021-2032)
8.6.1. Middle East Canned Mackerel Regional Analysis and Outlook
8.6.2. Africa Canned Mackerel Regional Analysis and Outlook
Chapter 9. North America Canned Mackerel Analysis and Outlook
9.1. North America Canned Mackerel Revenue (USD Million) by Segments (2021-2032)
9.1.1. North America Canned Mackerel Revenue (USD Million) by Type (2021-2032)
9.1.2. North America Canned Mackerel Revenue (USD Million) by Application (2021-2032)
9.1.3. North America Canned Mackerel Revenue (USD Million) by Product (2021-2032)
By Processing
Oil
Sauce
Others
By Application
Household
Commercial
By Distribution Channel
Supermarkets/Hypermarkets
Convenience stores
Specialty stores
Online sales channel
Chapter 10. Europe Canned Mackerel Analysis and Outlook
10.1. Europe Canned Mackerel Revenue (USD Million), by Segments (USD Million) (2021-2032)
10.1.1. Europe Canned Mackerel Revenue (USD Million) by Type (2021-2032)
10.1.2. Europe Canned Mackerel Revenue (USD Million) by Application (2021-2032)
10.1.3. Europe Canned Mackerel Revenue (USD Million) by Product (2021-2032)
By Processing
Oil
Sauce
Others
By Application
Household
Commercial
By Distribution Channel
Supermarkets/Hypermarkets
Convenience stores
Specialty stores
Online sales channel
Chapter 11. Asia Pacific Canned Mackerel Analysis and Outlook
11.1. Asia Pacific Canned Mackerel Revenue (USD Million), and Revenue (USD Million) by Segments (2021-2032)
11.1.1. Asia Pacific Canned Mackerel Revenue (USD Million) by Type (2021-2032)
11.1.2. Asia Pacific Canned Mackerel Revenue (USD Million) by Application (2021-2032)
11.1.3. Asia Pacific Canned Mackerel Revenue (USD Million) by Product (2021-2032)
By Processing
Oil
Sauce
Others
By Application
Household
Commercial
By Distribution Channel
Supermarkets/Hypermarkets
Convenience stores
Specialty stores
Online sales channel
Chapter 12. South America Canned Mackerel Analysis and Outlook
12.1. South America Canned Mackerel Revenue (USD Million), by Segments (2021-2032)
12.1.1. South America Canned Mackerel Revenue (USD Million) by Type (2021-2032)
12.1.2. South America Canned Mackerel Revenue (USD Million) by Application (2021-2032)
12.1.3. South America Canned Mackerel Revenue (USD Million) by Product (2021-2032)
By Processing
Oil
Sauce
Others
By Application
Household
Commercial
By Distribution Channel
Supermarkets/Hypermarkets
Convenience stores
Specialty stores
Online sales channel
Chapter 13. Middle East and Africa Canned Mackerel Analysis and Outlook
13.1. Middle East and Africa Canned Mackerel Revenue (USD Million), by Segments (2021-2032)
13.1.1. Middle East and Africa Canned Mackerel Revenue (USD Million) by Type (2021-2032)
13.1.2. Middle East and Africa Canned Mackerel Revenue (USD Million) by Application (2021-2032)
13.1.3. Middle East and Africa Canned Mackerel Revenue (USD Million) by Product (2021-2032)
By Processing
Oil
Sauce
Others
By Application
Household
Commercial
By Distribution Channel
Supermarkets/Hypermarkets
Convenience stores
Specialty stores
Online sales channel
Chapter 14. Canned Mackerel Company Profiles
14.1 Business Overview
14.2 Product Profiles
14.3 SWOT Profiles
14.5 Recent Developments
14.6 Financial Profile
List of Companies
American Fishing Family
Bolton Group
Brunswick
Diavena
Ec plaza Network inc
FCF Co. Ltd
Kumpulan Fima Berhad
LDH (La Doria) Ltd
Maruha Nichiro Corp
Marushin Canneries Malaysia
Mitsubishi Corp
Thai Union Group PCL
Tropical food Manufacturing co.
Universal Canning Inc
Xiamen Amoytop Import & Export Co. Ltd
15. Methodology and Data Sources
15.1 Customization Offerings
15.2 Subscription Services
15.3 Related Reports
15.4 Publisher Expertise
LIST OF TABLES
Table 1 Market Segmentation Analysis
Table 2 Global Canned Mackerel Market Share of Leading Companies, 2023
Table 3 Product Offerings of Leading Companies
Table 4 Low Growth Scenario Forecasts
Table 5 Reference Case Growth Scenario
Table 6 High Growth Case Scenario
Table 7 Global Canned Mackerel Revenue (USD Million) And CAGR (%) By Type (2021-2032)
Table 8 Global Canned Mackerel Revenue (USD Million) And CAGR (%) By Application (2021-2032)
Table 9 Global Canned Mackerel Revenue (USD Million) And CAGR (%) By Product (2021-2032)
Table 10 Global Canned Mackerel Market Revenue (USD Million) By Regions (2021-2032)
Table 11 Global Canned Mackerel Market Share (%) By Regions (2021-2032)
Table 12 North America Canned Mackerel Revenue (USD Million) By Country (2021-2032)
Table 13 Europe Canned Mackerel Revenue (USD Million) By Country (2021-2032)
Table 14 Asia Pacific Canned Mackerel Revenue (USD Million) By Country (2021-2032)
Table 15 South America Canned Mackerel Revenue (USD Million) By Country (2021-2032)
Table 16 Middle East and Africa Canned Mackerel Revenue (USD Million) By Region (2021-2032)
Table 17 North America Canned Mackerel Revenue (USD Million) By Type (2021-2032)
Table 18 North America Canned Mackerel Revenue (USD Million) By Application (2021-2032)
Table 19 North America Canned Mackerel Revenue (USD Million) By Product (2021-2032)
Table 20 Europe Canned Mackerel Revenue (USD Million) By Type (2021-2032)
Table 21 Europe Canned Mackerel Revenue (USD Million) By Application (2021-2032)
Table 22 Europe Canned Mackerel Revenue (USD Million) By Product (2021-2032)
Table 23 Asia Pacific Canned Mackerel Revenue (USD Million) By Type (2021-2032)
Table 24 Asia Pacific Canned Mackerel Revenue (USD Million) By Application (2021-2032)
Table 25 Asia Pacific Canned Mackerel Revenue (USD Million) By Product (2021-2032)
Table 26 South America Canned Mackerel Revenue (USD Million) By Type (2021-2032)
Table 27 South America Canned Mackerel Revenue (USD Million) By Application (2021-2032)
Table 28 South America Canned Mackerel Revenue (USD Million) By Product (2021-2032)
Table 29 Middle East and Africa Canned Mackerel Revenue (USD Million) By Type (2021-2032)
Table 30 Middle East and Africa Canned Mackerel Revenue (USD Million) By Application (2021-2032)
Table 31 Middle East and Africa Canned Mackerel Revenue (USD Million) By Product (2021-2032)
LIST OF FIGURES
Figure 1. Market Scope
Figure 2. Pricing Forecasts Per Unit, 2023- 2032
Figure 3. Porter’s Five Forces
Figure 4. Global Canned Mackerel Market Revenue (USD Million) By Regions (2021-2032)
Figure 5. Global Canned Mackerel Market Share (%) By Regions (2023)
Figure 6. North America Canned Mackerel Revenue (USD Million) By Country (2021-2032)
Figure 7. United States Canned Mackerel Revenue (USD Million) By Country (2021-2032)
Figure 8. Canada Canned Mackerel Revenue (USD Million) By Country (2021-2032)
Figure 9. Mexico Canned Mackerel Revenue (USD Million) By Country (2021-2032)
Figure 10. Europe Canned Mackerel Revenue (USD Million) By Country (2021-2032)
Figure 11. Germany Canned Mackerel Revenue (USD Million) By Country (2021-2032)
Figure 12. France Canned Mackerel Revenue (USD Million) By Country (2021-2032)
Figure 13. United Kingdom Canned Mackerel Revenue (USD Million) By Country (2021-2032)
Figure 14. Spain Canned Mackerel Revenue (USD Million) By Country (2021-2032)
Figure 15. Italy Canned Mackerel Revenue (USD Million) By Country (2021-2032)
Figure 16. Russia Canned Mackerel Revenue (USD Million) By Country (2021-2032)
Figure 17. Rest of Europe Canned Mackerel Revenue (USD Million) By Country (2021-2032)
Figure 11. Asia Pacific Canned Mackerel Revenue (USD Million) By Country (2021-2032)
Figure 12. China Canned Mackerel Revenue (USD Million) By Country (2021-2032)
Figure 13. Japan Canned Mackerel Revenue (USD Million) By Country (2021-2032)
Figure 14. India Canned Mackerel Revenue (USD Million) By Country (2021-2032)
Figure 15. South Korea Canned Mackerel Revenue (USD Million) By Country (2021-2032)
Figure 16. Australia Canned Mackerel Revenue (USD Million) By Country (2021-2032)
Figure 17. South East Asia Canned Mackerel Revenue (USD Million) By Country (2021-2032)
Figure 18. South America Canned Mackerel Revenue (USD Million) By Country (2021-2032)
Figure 19. Brazil Canned Mackerel Revenue (USD Million) By Country (2021-2032)
Figure 20. Argentina Canned Mackerel Revenue (USD Million) By Country (2021-2032)
Figure 21. Rest of Asia Pacific Canned Mackerel Revenue (USD Million) By Country (2021-2032)
Figure 22. Middle East and Africa Canned Mackerel Revenue (USD Million) By Region (2021-2032)
Figure 23. Saudi Arabia Canned Mackerel Revenue (USD Million) By Region (2021-2032)
Figure 24. The UAE Canned Mackerel Revenue (USD Million) By Region (2021-2032)
Figure 25. Rest of Middle East Canned Mackerel Revenue (USD Million) By Region (2021-2032)
Figure 26. South Africa Canned Mackerel Revenue (USD Million) By Region (2021-2032)
Figure 27. Africa Canned Mackerel Revenue (USD Million) By Region (2021-2032)
Figure 28. North America Canned Mackerel Revenue (USD Million) By Type (2021-2032)
Figure 29. North America Canned Mackerel Revenue (USD Million) By Application (2021-2032)
Figure 30. North America Canned Mackerel Revenue (USD Million) By Product (2021-2032)
Figure 31. Europe Canned Mackerel Revenue (USD Million) By Type (2021-2032)
Figure 32. Europe Canned Mackerel Revenue (USD Million) By Application (2021-2032)
Figure 33. Europe Canned Mackerel Revenue (USD Million) By Product (2021-2032)
Figure 34. Asia Pacific Canned Mackerel Revenue (USD Million) By Type (2021-2032)
Figure 35. Asia Pacific Canned Mackerel Revenue (USD Million) By Application (2021-2032)
Figure 36. Asia Pacific Canned Mackerel Revenue (USD Million) By Product (2021-2032)
Figure 37. South America Canned Mackerel Revenue (USD Million) By Type (2021-2032)
Figure 38. South America Canned Mackerel Revenue (USD Million) By Application (2021-2032)
Figure 39. South America Canned Mackerel Revenue (USD Million) By Product (2021-2032)
Figure 40. Middle East and Africa Canned Mackerel Revenue (USD Million) By Type (2021-2032)
Figure 41. Middle East and Africa Canned Mackerel Revenue (USD Million) By Application (2021-2032)
Figure 42. Middle East and Africa Canned Mackerel Revenue (USD Million) By Product (2021-2032)
By Processing
Oil
Sauce
Others
By Application
Household
Commercial
By Distribution Channel
Supermarkets/Hypermarkets
Convenience stores
Specialty stores
Online sales channel
Countries Analyzed
North America (US, Canada, Mexico)
Europe (Germany, UK, France, Spain, Italy, Russia, Rest of Europe)
Asia Pacific (China, India, Japan, South Korea, Australia, South East Asia, Rest of Asia)
South America (Brazil, Argentina, Rest of South America)
Middle East and Africa (Saudi Arabia, UAE, Rest of Middle East, South Africa, Egypt, Rest of Africa)
