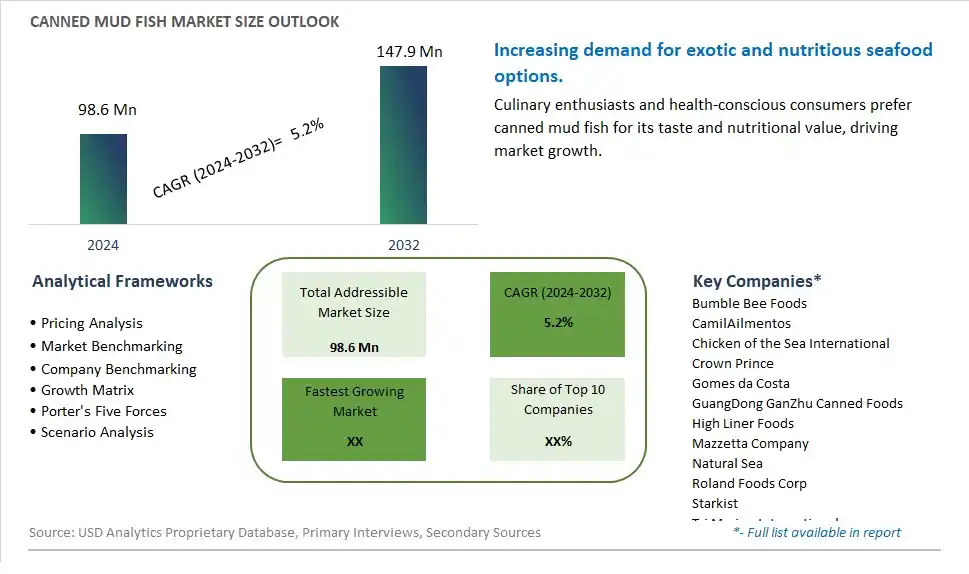
Global Canned Mud Fish Market Size is valued at $98.6 Million in 2024 and is forecast to register a growth rate (CAGR) of 5.2% to reach $147.9 Million by 2032.
The global Canned Mud Fish Market Comprehensive Study analyzes and forecasts the market size across 6 regions and 24 countries for diverse segments -By Type (Fresh, Frozen), By Application (Supermarkets/Hypermarkets, Convenience Stores, Online Retailers, Others)
An Introduction to Canned Mud Fish Market
The Canned Mud Fish market in 2024 is expanding, driven by the demand for convenient and exotic seafood options. Canned mud fish, known for its distinctive flavor and versatility, is used in a variety of traditional and contemporary dishes. The market is supported by the growing popularity of ethnic and gourmet cuisines. Advances in canning technology and sustainable fishing practices are enhancing the quality, flavor, and shelf life of canned mud fish. The market is also benefiting from the trend towards clean-label and naturally sourced seafood products, appealing to consumers seeking unique and nutritious meal options.
Canned Mud Fish Competitive Landscape
The market report analyses the leading companies in the industry including Bumble Bee Foods, CamilAilmentos, Chicken of the Sea International, Crown Prince, Gomes da Costa, GuangDong GanZhu Canned Foods, High Liner Foods, Mazzetta Company, Natural Sea, Roland Foods Corp, Starkist, Tri Marine International, Wild Planet, and Others.
Canned Mud Fish Market Dynamics
Canned Mud Fish Market Trend: Growing Demand for Ready-to-Eat Seafood
A prominent market trend for canned mud fish is the growing demand for ready-to-eat seafood products. Consumers are increasingly seeking convenient and time-saving meal options, and canned mud fish provides a hassle-free solution as it requires minimal preparation and cooking time. This trend is driven by busy lifestyles and the need for convenient yet nutritious food choices, positioning canned mud fish as a popular option in the seafood market segment.
Canned Mud Fish Market Driver: Long Shelf Life and Preservation of Freshness
The market driver for canned mud fish is its long shelf life and the ability to preserve freshness. Canning technology allows for the sealing of the product in airtight containers, preventing spoilage and maintaining the quality and flavor of the fish over an extended period. This ensures that consumers can enjoy the nutritional benefits of mud fish without concerns about freshness, contributing to the market's growth by offering a reliable and shelf-stable seafood option.
Canned Mud Fish Market Opportunity: Health-Conscious and Ethnic Cuisine Markets
An opportunity within the canned mud fish market lies in targeting health-conscious consumers and tapping into ethnic cuisine markets. Mud fish is rich in protein, vitamins, and omega-3 fatty acids, making it a nutritious choice for health-conscious individuals looking for protein-rich foods. Additionally, canned mud fish can be marketed to ethnic communities that appreciate the unique flavor and culinary versatility of mud fish in traditional dishes. By leveraging these opportunities and promoting the nutritional value and culinary diversity of canned mud fish, manufacturers can expand their consumer base and drive sales growth in the market.
Canned Mud Fish Market Share Analysis: Fresh segment generated the highest revenue share in the industry
The largest segment in the Canned Mud Fish Market is the Fresh type. This segment represents a substantial portion of the market share due to several key factors driving its prominence. Firstly, fresh canned mud fish offers consumers the perception of higher quality and freshness compared to frozen alternatives. This perception aligns with the preferences of many consumers who prioritize the taste and texture of fresh fish in their meals. Additionally, the fresh canned mud fish segment caters to a broader range of culinary applications, including traditional dishes and gourmet recipes, further expanding its market reach. The demand for fresh canned mud fish is also fueled by health-conscious consumers seeking nutritious and minimally processed food options. With its appeal to taste, versatility, and health benefits, the fresh canned mud fish segment continues to lead the market and is expected to experience continued growth as consumer preferences evolve.
Canned Mud Fish Market Share Analysis: Online Retailers is the fastest growing segment over the forecast period to 2032
The Online Retailers segment is experiencing rapid growth in the Canned Mud Fish Market. This growth can be attributed to several factors driving the shift towards online purchasing patterns. Firstly, the convenience and accessibility offered by online platforms have made it increasingly convenient for consumers to buy canned mud fish products from the comfort of their homes. This trend has been further accelerated by the global digitalization of retail and the widespread availability of e-commerce platforms. Further, online retailers often offer a wide range of product options, competitive pricing, and promotional deals, attracting a large pool of customers seeking value and convenience. Additionally, the growing consumer preference for contactless shopping, especially in light of recent events impacting physical retail, has contributed to the surge in online sales of canned mud fish. As a result, the Online Retailers segment is expected to continue its robust growth trajectory, making it a significant player in the market landscape by 2032.
Canned Mud Fish Market Segmentation
By Type
Fresh
Frozen
By Application
Supermarkets/Hypermarkets
Convenience Stores
Online Retailers
Others
Countries Analyzed
North America (US, Canada, Mexico)
Europe (Germany, UK, France, Spain, Italy, Russia, Rest of Europe)
Asia Pacific (China, India, Japan, South Korea, Australia, South East Asia, Rest of Asia)
South America (Brazil, Argentina, Rest of South America)
Middle East and Africa (Saudi Arabia, UAE, Rest of Middle East, South Africa, Egypt, Rest of Africa)
Canned Mud Fish Companies Profiled in the Study
Bumble Bee Foods
CamilAilmentos
Chicken of the Sea International
Crown Prince
Gomes da Costa
GuangDong GanZhu Canned Foods
High Liner Foods
Mazzetta Company
Natural Sea
Roland Foods Corp
Starkist
Tri Marine International
Wild Planet
*- List Not Exhaustive
Chapter 1. TABLE OF CONTENTS
Chapter 2. Introduction to Canned Mud Fish Market
2.1. Market Overview
2.2. Key Statistics and Report Highlights
2.3. Scope of the Comprehensive Study
2.3.1. Market Definition
2.3.2 Countries and Regions Covered
2.3.3 Research Objective
2.3.4 Units, Currency, and Conversions
2.3.5 Industry Value Chain
2.4. Key Market Segments
2.5. Key Companies
2.6. Study Period
Chapter 3. Strategic Analysis Review
3.1. Canned Mud Fish Pricing Analysis and Forecast
3.2. Porter’s Five Forces
3.3. Market Ecosystem
3.4. SWOT Analysis
3.5. Regulatory Scenario
3.3. Effects of Inflation, Russia-Ukraine War, moderating economic growth, and other macroeconomic factors
Chapter 4. Competitive Landscape
4.1. Market Share Analysis
4.1.1. Global Canned Mud Fish Market Share by Company, 2023
4.1.2. Product Offerings of Leading Canned Mud Fish Companies
4.2. Market Entropy
4.2.1. New Product Launches in the Industry
4.2.2. Mergers, Acquisitions, Joint ventures, and Partnerships
4.3. Key Strategies and Best Practices
Chapter 5. Global Market Projections: Best, Reference, and Low Case Scenarios
5.1. Growth Analysis- Case Scenario Definitions
5.2. Low Growth Case Scenario Forecasts
5.3. Reference Growth Case Scenario Forecasts
5.4. High Growth Case Scenario Forecasts
Chapter 6. Market Dynamics
6.1. Canned Mud Fish Market Drivers
6.2. Canned Mud Fish Market Challenges
6.6. Canned Mud Fish Market Opportunities
6.4. Canned Mud Fish Market Trends
Chapter 7. Global Canned Mud Fish Market Outlook Trends
7.1. Global Canned Mud Fish Revenue (USD Million) and CAGR (%) by Type (2021-2032)
7.2. Global Canned Mud Fish Revenue (USD Million) and CAGR (%) by Application (2021-2032)
7.3. Global Canned Mud Fish Revenue (USD Million) and CAGR (%) by Product (2021-2032)
By Type
Fresh
Frozen
By Application
Supermarkets/Hypermarkets
Convenience Stores
Online Retailers
Others
Chapter 8. Global Canned Mud Fish Regional Analysis and Outlook
8.1. Global Canned Mud Fish Revenue (USD Million) By Regions (2021- 2032)
8.2. North America Canned Mud Fish Revenue (USD Million) by Country (2021-2032)
8.2.1. United States Canned Mud Fish Regional Analysis and Outlook
8.2.2. Canada Canned Mud Fish Regional Analysis and Outlook
8.2.3. Mexico Canned Mud Fish Regional Analysis and Outlook
8.3. Europe Canned Mud Fish Revenue (USD Million), by Country (2021-2032)
8.3.1. Germany Canned Mud Fish Regional Analysis and Outlook
8.3.2. France Canned Mud Fish Regional Analysis and Outlook
8.3.3. United Kingdom Canned Mud Fish Regional Analysis and Outlook
8.3.4. Spain Canned Mud Fish Regional Analysis and Outlook
8.3.5. Italy Canned Mud Fish Regional Analysis and Outlook
8.3.6. Russia Canned Mud Fish Regional Analysis and Outlook
8.3.7. Rest of Europe Canned Mud Fish Regional Analysis and Outlook
8.4. Asia Pacific Canned Mud Fish Revenue (USD Million) by Country (2021-2032)
8.4.1. China Canned Mud Fish Regional Analysis and Outlook
8.4.2. Japan Canned Mud Fish Regional Analysis and Outlook
8.4.3. India Canned Mud Fish Regional Analysis and Outlook
8.4.4. South Korea Canned Mud Fish Regional Analysis and Outlook
8.4.5. Australia Canned Mud Fish Regional Analysis and Outlook
8.4.6. South East Asia Canned Mud Fish Regional Analysis and Outlook
8.4.7. Rest of Asia Pacific Canned Mud Fish Regional Analysis and Outlook
8.5. South America Canned Mud Fish Revenue (USD Million), by Country (2021-2032)
8.5.1. Brazil Canned Mud Fish Regional Analysis and Outlook
8.5.2. Argentina Canned Mud Fish Regional Analysis and Outlook
8.5.3. Rest of South America Canned Mud Fish Regional Analysis and Outlook
8.6. Middle East and Africa Canned Mud Fish Revenue (USD Million) by Country (2021-2032)
8.6.1. Middle East Canned Mud Fish Regional Analysis and Outlook
8.6.2. Africa Canned Mud Fish Regional Analysis and Outlook
Chapter 9. North America Canned Mud Fish Analysis and Outlook
9.1. North America Canned Mud Fish Revenue (USD Million) by Segments (2021-2032)
9.1.1. North America Canned Mud Fish Revenue (USD Million) by Type (2021-2032)
9.1.2. North America Canned Mud Fish Revenue (USD Million) by Application (2021-2032)
9.1.3. North America Canned Mud Fish Revenue (USD Million) by Product (2021-2032)
By Type
Fresh
Frozen
By Application
Supermarkets/Hypermarkets
Convenience Stores
Online Retailers
Others
Chapter 10. Europe Canned Mud Fish Analysis and Outlook
10.1. Europe Canned Mud Fish Revenue (USD Million), by Segments (USD Million) (2021-2032)
10.1.1. Europe Canned Mud Fish Revenue (USD Million) by Type (2021-2032)
10.1.2. Europe Canned Mud Fish Revenue (USD Million) by Application (2021-2032)
10.1.3. Europe Canned Mud Fish Revenue (USD Million) by Product (2021-2032)
By Type
Fresh
Frozen
By Application
Supermarkets/Hypermarkets
Convenience Stores
Online Retailers
Others
Chapter 11. Asia Pacific Canned Mud Fish Analysis and Outlook
11.1. Asia Pacific Canned Mud Fish Revenue (USD Million), and Revenue (USD Million) by Segments (2021-2032)
11.1.1. Asia Pacific Canned Mud Fish Revenue (USD Million) by Type (2021-2032)
11.1.2. Asia Pacific Canned Mud Fish Revenue (USD Million) by Application (2021-2032)
11.1.3. Asia Pacific Canned Mud Fish Revenue (USD Million) by Product (2021-2032)
By Type
Fresh
Frozen
By Application
Supermarkets/Hypermarkets
Convenience Stores
Online Retailers
Others
Chapter 12. South America Canned Mud Fish Analysis and Outlook
12.1. South America Canned Mud Fish Revenue (USD Million), by Segments (2021-2032)
12.1.1. South America Canned Mud Fish Revenue (USD Million) by Type (2021-2032)
12.1.2. South America Canned Mud Fish Revenue (USD Million) by Application (2021-2032)
12.1.3. South America Canned Mud Fish Revenue (USD Million) by Product (2021-2032)
By Type
Fresh
Frozen
By Application
Supermarkets/Hypermarkets
Convenience Stores
Online Retailers
Others
Chapter 13. Middle East and Africa Canned Mud Fish Analysis and Outlook
13.1. Middle East and Africa Canned Mud Fish Revenue (USD Million), by Segments (2021-2032)
13.1.1. Middle East and Africa Canned Mud Fish Revenue (USD Million) by Type (2021-2032)
13.1.2. Middle East and Africa Canned Mud Fish Revenue (USD Million) by Application (2021-2032)
13.1.3. Middle East and Africa Canned Mud Fish Revenue (USD Million) by Product (2021-2032)
By Type
Fresh
Frozen
By Application
Supermarkets/Hypermarkets
Convenience Stores
Online Retailers
Others
Chapter 14. Canned Mud Fish Company Profiles
14.1 Business Overview
14.2 Product Profiles
14.3 SWOT Profiles
14.5 Recent Developments
14.6 Financial Profile
List of Companies
Bumble Bee Foods
CamilAilmentos
Chicken of the Sea International
Crown Prince
Gomes da Costa
GuangDong GanZhu Canned Foods
High Liner Foods
Mazzetta Company
Natural Sea
Roland Foods Corp
Starkist
Tri Marine International
Wild Planet
15. Methodology and Data Sources
15.1 Customization Offerings
15.2 Subscription Services
15.3 Related Reports
15.4 Publisher Expertise
LIST OF TABLES
Table 1 Market Segmentation Analysis
Table 2 Global Canned Mud Fish Market Share of Leading Companies, 2023
Table 3 Product Offerings of Leading Companies
Table 4 Low Growth Scenario Forecasts
Table 5 Reference Case Growth Scenario
Table 6 High Growth Case Scenario
Table 7 Global Canned Mud Fish Revenue (USD Million) And CAGR (%) By Type (2021-2032)
Table 8 Global Canned Mud Fish Revenue (USD Million) And CAGR (%) By Application (2021-2032)
Table 9 Global Canned Mud Fish Revenue (USD Million) And CAGR (%) By Product (2021-2032)
Table 10 Global Canned Mud Fish Market Revenue (USD Million) By Regions (2021-2032)
Table 11 Global Canned Mud Fish Market Share (%) By Regions (2021-2032)
Table 12 North America Canned Mud Fish Revenue (USD Million) By Country (2021-2032)
Table 13 Europe Canned Mud Fish Revenue (USD Million) By Country (2021-2032)
Table 14 Asia Pacific Canned Mud Fish Revenue (USD Million) By Country (2021-2032)
Table 15 South America Canned Mud Fish Revenue (USD Million) By Country (2021-2032)
Table 16 Middle East and Africa Canned Mud Fish Revenue (USD Million) By Region (2021-2032)
Table 17 North America Canned Mud Fish Revenue (USD Million) By Type (2021-2032)
Table 18 North America Canned Mud Fish Revenue (USD Million) By Application (2021-2032)
Table 19 North America Canned Mud Fish Revenue (USD Million) By Product (2021-2032)
Table 20 Europe Canned Mud Fish Revenue (USD Million) By Type (2021-2032)
Table 21 Europe Canned Mud Fish Revenue (USD Million) By Application (2021-2032)
Table 22 Europe Canned Mud Fish Revenue (USD Million) By Product (2021-2032)
Table 23 Asia Pacific Canned Mud Fish Revenue (USD Million) By Type (2021-2032)
Table 24 Asia Pacific Canned Mud Fish Revenue (USD Million) By Application (2021-2032)
Table 25 Asia Pacific Canned Mud Fish Revenue (USD Million) By Product (2021-2032)
Table 26 South America Canned Mud Fish Revenue (USD Million) By Type (2021-2032)
Table 27 South America Canned Mud Fish Revenue (USD Million) By Application (2021-2032)
Table 28 South America Canned Mud Fish Revenue (USD Million) By Product (2021-2032)
Table 29 Middle East and Africa Canned Mud Fish Revenue (USD Million) By Type (2021-2032)
Table 30 Middle East and Africa Canned Mud Fish Revenue (USD Million) By Application (2021-2032)
Table 31 Middle East and Africa Canned Mud Fish Revenue (USD Million) By Product (2021-2032)
LIST OF FIGURES
Figure 1. Market Scope
Figure 2. Pricing Forecasts Per Unit, 2023- 2032
Figure 3. Porter’s Five Forces
Figure 4. Global Canned Mud Fish Market Revenue (USD Million) By Regions (2021-2032)
Figure 5. Global Canned Mud Fish Market Share (%) By Regions (2023)
Figure 6. North America Canned Mud Fish Revenue (USD Million) By Country (2021-2032)
Figure 7. United States Canned Mud Fish Revenue (USD Million) By Country (2021-2032)
Figure 8. Canada Canned Mud Fish Revenue (USD Million) By Country (2021-2032)
Figure 9. Mexico Canned Mud Fish Revenue (USD Million) By Country (2021-2032)
Figure 10. Europe Canned Mud Fish Revenue (USD Million) By Country (2021-2032)
Figure 11. Germany Canned Mud Fish Revenue (USD Million) By Country (2021-2032)
Figure 12. France Canned Mud Fish Revenue (USD Million) By Country (2021-2032)
Figure 13. United Kingdom Canned Mud Fish Revenue (USD Million) By Country (2021-2032)
Figure 14. Spain Canned Mud Fish Revenue (USD Million) By Country (2021-2032)
Figure 15. Italy Canned Mud Fish Revenue (USD Million) By Country (2021-2032)
Figure 16. Russia Canned Mud Fish Revenue (USD Million) By Country (2021-2032)
Figure 17. Rest of Europe Canned Mud Fish Revenue (USD Million) By Country (2021-2032)
Figure 11. Asia Pacific Canned Mud Fish Revenue (USD Million) By Country (2021-2032)
Figure 12. China Canned Mud Fish Revenue (USD Million) By Country (2021-2032)
Figure 13. Japan Canned Mud Fish Revenue (USD Million) By Country (2021-2032)
Figure 14. India Canned Mud Fish Revenue (USD Million) By Country (2021-2032)
Figure 15. South Korea Canned Mud Fish Revenue (USD Million) By Country (2021-2032)
Figure 16. Australia Canned Mud Fish Revenue (USD Million) By Country (2021-2032)
Figure 17. South East Asia Canned Mud Fish Revenue (USD Million) By Country (2021-2032)
Figure 18. South America Canned Mud Fish Revenue (USD Million) By Country (2021-2032)
Figure 19. Brazil Canned Mud Fish Revenue (USD Million) By Country (2021-2032)
Figure 20. Argentina Canned Mud Fish Revenue (USD Million) By Country (2021-2032)
Figure 21. Rest of Asia Pacific Canned Mud Fish Revenue (USD Million) By Country (2021-2032)
Figure 22. Middle East and Africa Canned Mud Fish Revenue (USD Million) By Region (2021-2032)
Figure 23. Saudi Arabia Canned Mud Fish Revenue (USD Million) By Region (2021-2032)
Figure 24. The UAE Canned Mud Fish Revenue (USD Million) By Region (2021-2032)
Figure 25. Rest of Middle East Canned Mud Fish Revenue (USD Million) By Region (2021-2032)
Figure 26. South Africa Canned Mud Fish Revenue (USD Million) By Region (2021-2032)
Figure 27. Africa Canned Mud Fish Revenue (USD Million) By Region (2021-2032)
Figure 28. North America Canned Mud Fish Revenue (USD Million) By Type (2021-2032)
Figure 29. North America Canned Mud Fish Revenue (USD Million) By Application (2021-2032)
Figure 30. North America Canned Mud Fish Revenue (USD Million) By Product (2021-2032)
Figure 31. Europe Canned Mud Fish Revenue (USD Million) By Type (2021-2032)
Figure 32. Europe Canned Mud Fish Revenue (USD Million) By Application (2021-2032)
Figure 33. Europe Canned Mud Fish Revenue (USD Million) By Product (2021-2032)
Figure 34. Asia Pacific Canned Mud Fish Revenue (USD Million) By Type (2021-2032)
Figure 35. Asia Pacific Canned Mud Fish Revenue (USD Million) By Application (2021-2032)
Figure 36. Asia Pacific Canned Mud Fish Revenue (USD Million) By Product (2021-2032)
Figure 37. South America Canned Mud Fish Revenue (USD Million) By Type (2021-2032)
Figure 38. South America Canned Mud Fish Revenue (USD Million) By Application (2021-2032)
Figure 39. South America Canned Mud Fish Revenue (USD Million) By Product (2021-2032)
Figure 40. Middle East and Africa Canned Mud Fish Revenue (USD Million) By Type (2021-2032)
Figure 41. Middle East and Africa Canned Mud Fish Revenue (USD Million) By Application (2021-2032)
Figure 42. Middle East and Africa Canned Mud Fish Revenue (USD Million) By Product (2021-2032)
By Type
Fresh
Frozen
By Application
Supermarkets/Hypermarkets
Convenience Stores
Online Retailers
Others
Countries Analyzed
North America (US, Canada, Mexico)
Europe (Germany, UK, France, Spain, Italy, Russia, Rest of Europe)
Asia Pacific (China, India, Japan, South Korea, Australia, South East Asia, Rest of Asia)
South America (Brazil, Argentina, Rest of South America)
Middle East and Africa (Saudi Arabia, UAE, Rest of Middle East, South Africa, Egypt, Rest of Africa)
