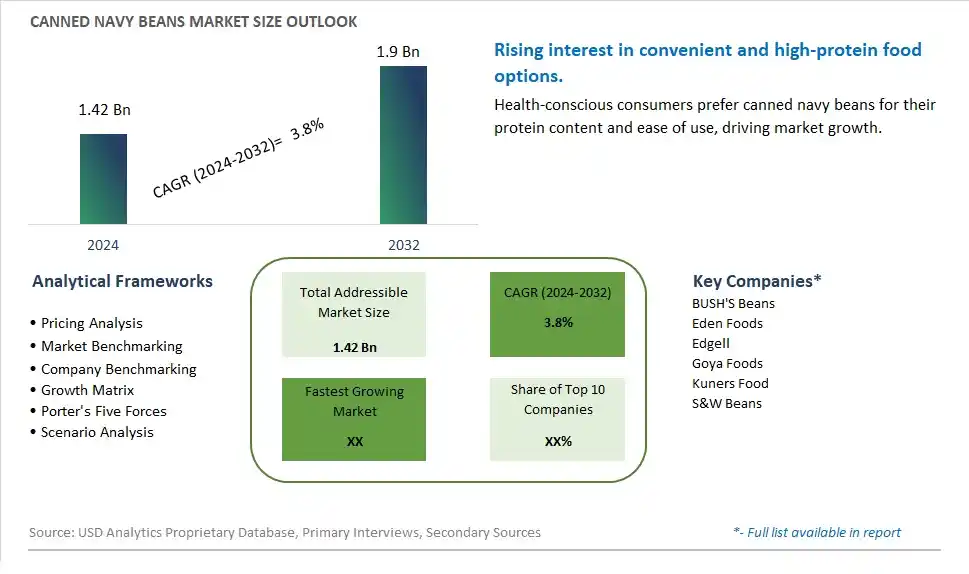
Global Canned Navy Beans Market Size is valued at $1.42 Billion in 2024 and is forecast to register a growth rate (CAGR) of 3.8% to reach $1.9 Billion by 2032.
The global Canned Navy Beans Market Comprehensive Study analyzes and forecasts the market size across 6 regions and 24 countries for diverse segments -By Type (Dry Beans, Wet Beans), By Sales Channel (Online, Offline)
An Introduction to Canned Navy Beans Market
In 2024, the Canned Navy Beans market is witnessing significant growth, driven by the increasing demand for plant-based protein and fiber-rich foods. Canned navy beans, known for their mild flavor and creamy texture, are used in a variety of dishes such as soups, stews, and salads. The market is supported by the growing trend towards vegetarian and vegan diets and the demand for convenient and nutritious food options. Advances in canning technology and sustainable farming practices are enhancing the quality and availability of canned navy beans. The market is also benefiting from the trend towards clean-label and organic products, appealing to health-conscious consumers seeking high-quality plant-based foods.
Canned Navy Beans Competitive Landscape
The market report analyses the leading companies in the industry including BUSH'S Beans, Eden Foods, Edgell, Goya Foods, Kuners Food, S&W Beans, and Others.
Canned Navy Beans Market Dynamics
Canned Navy Beans Market Trend: Increased Demand for Plant-Based Proteins
A prominent market trend for canned navy beans is the increased demand for plant-based proteins. With growing awareness of the health benefits associated with plant-based diets, consumers are actively seeking protein sources that are not only nutritious but also sustainable and environmentally friendly. Canned navy beans, being a rich source of protein, fiber, and various nutrients, are well-positioned to capitalize on this trend as a versatile ingredient in vegetarian and vegan meal options.
Canned Navy Beans Market Driver: Convenience and Time-Saving Solutions
The market driver for canned navy beans is the convenience and time-saving solutions they offer to consumers. Canned navy beans eliminate the need for soaking and lengthy cooking times required for dried beans, making them a convenient pantry staple for quick and easy meal preparation. This aspect appeals to busy individuals and families looking for nutritious ingredients that can be incorporated into a variety of dishes with minimal effort.
Canned Navy Beans Market Opportunity: Health-Conscious and Ethnic Cuisine Markets
An opportunity within the canned navy beans market lies in targeting health-conscious consumers and exploring opportunities in ethnic cuisine markets. Navy beans are known for their nutritional value, including high protein content, fiber, and essential minerals. By highlighting these health benefits and promoting navy beans as a versatile ingredient for diverse cuisines, manufacturers can attract health-conscious consumers seeking plant-based protein alternatives. Furthermore, canned navy beans can be marketed to ethnic communities that incorporate beans into traditional dishes, expanding the market reach and appealing to a wider range of culinary preferences.
Canned Navy Beans Market Share Analysis: Dry Beans segment generated the highest revenue share in the industry
The Dry Beans segment stands out as the largest segment in the Canned Navy Beans Market. This segment comprises navy beans that have undergone a drying process before being canned, ensuring long shelf life and preservation of nutritional value. Dry beans are favored for their versatility in various culinary applications, including soups, stews, salads, and side dishes, making them a staple ingredient in many cuisines worldwide. The popularity of dry navy beans can be attributed to their convenience, affordability, and nutritional benefits, such as being a good source of protein, fiber, and essential nutrients. Additionally, the long shelf life of canned dry beans makes them a preferred choice for consumers looking for pantry staples that can be stored for extended periods without compromising quality. With increasing consumer awareness of healthy eating habits and the convenience of canned products, the Dry Beans segment is poised for continued growth in the Canned Navy Beans Market.
Canned Navy Beans Market Share Analysis: Online Sales Channel is the fastest growing segment over the forecast period to 2032
The Online Sales Channel segment is experiencing rapid growth in the Canned Navy Beans Market, becoming the fastest-growing segment leading up to 2032. This surge in online sales can be attributed to several key factors driving consumer behavior. Firstly, the convenience of online shopping allows consumers to browse and purchase canned navy beans from the comfort of their homes, saving time and effort spent on traditional offline shopping trips. Additionally, the widespread availability of e-commerce platforms and digital marketplaces has expanded the reach of canned bean products to a broader audience, including those in remote or underserved areas. The increasing adoption of smartphones and internet connectivity has further facilitated online purchases, making it easier for consumers to explore and compare different brands and offerings. Further, online platforms often offer competitive pricing, promotions, and discounts, attracting price-conscious consumers seeking value for their money. As a result of these trends and consumer preferences, the Online Sales Channel segment is poised for significant growth, driving the overall expansion of the Canned Navy Beans Market in the digital age.
Canned Navy Beans Market Segmentation
By Type
Dry Beans
Wet Beans
By Sales Channel
Online
Offline
Countries Analyzed
North America (US, Canada, Mexico)
Europe (Germany, UK, France, Spain, Italy, Russia, Rest of Europe)
Asia Pacific (China, India, Japan, South Korea, Australia, South East Asia, Rest of Asia)
South America (Brazil, Argentina, Rest of South America)
Middle East and Africa (Saudi Arabia, UAE, Rest of Middle East, South Africa, Egypt, Rest of Africa)
Canned Navy Beans Companies Profiled in the Study
BUSH'S Beans
Eden Foods
Edgell
Goya Foods
Kuners Food
S&W Beans
*- List Not Exhaustive
Chapter 1. TABLE OF CONTENTS
Chapter 2. Introduction to Canned Navy Beans Market
2.1. Market Overview
2.2. Key Statistics and Report Highlights
2.3. Scope of the Comprehensive Study
2.3.1. Market Definition
2.3.2 Countries and Regions Covered
2.3.3 Research Objective
2.3.4 Units, Currency, and Conversions
2.3.5 Industry Value Chain
2.4. Key Market Segments
2.5. Key Companies
2.6. Study Period
Chapter 3. Strategic Analysis Review
3.1. Canned Navy Beans Pricing Analysis and Forecast
3.2. Porter’s Five Forces
3.3. Market Ecosystem
3.4. SWOT Analysis
3.5. Regulatory Scenario
3.3. Effects of Inflation, Russia-Ukraine War, moderating economic growth, and other macroeconomic factors
Chapter 4. Competitive Landscape
4.1. Market Share Analysis
4.1.1. Global Canned Navy Beans Market Share by Company, 2023
4.1.2. Product Offerings of Leading Canned Navy Beans Companies
4.2. Market Entropy
4.2.1. New Product Launches in the Industry
4.2.2. Mergers, Acquisitions, Joint ventures, and Partnerships
4.3. Key Strategies and Best Practices
Chapter 5. Global Market Projections: Best, Reference, and Low Case Scenarios
5.1. Growth Analysis- Case Scenario Definitions
5.2. Low Growth Case Scenario Forecasts
5.3. Reference Growth Case Scenario Forecasts
5.4. High Growth Case Scenario Forecasts
Chapter 6. Market Dynamics
6.1. Canned Navy Beans Market Drivers
6.2. Canned Navy Beans Market Challenges
6.6. Canned Navy Beans Market Opportunities
6.4. Canned Navy Beans Market Trends
Chapter 7. Global Canned Navy Beans Market Outlook Trends
7.1. Global Canned Navy Beans Revenue (USD Million) and CAGR (%) by Type (2021-2032)
7.2. Global Canned Navy Beans Revenue (USD Million) and CAGR (%) by Application (2021-2032)
7.3. Global Canned Navy Beans Revenue (USD Million) and CAGR (%) by Product (2021-2032)
By Type
Dry Beans
Wet Beans
By Sales Channel
Online
Offline
Chapter 8. Global Canned Navy Beans Regional Analysis and Outlook
8.1. Global Canned Navy Beans Revenue (USD Million) By Regions (2021- 2032)
8.2. North America Canned Navy Beans Revenue (USD Million) by Country (2021-2032)
8.2.1. United States Canned Navy Beans Regional Analysis and Outlook
8.2.2. Canada Canned Navy Beans Regional Analysis and Outlook
8.2.3. Mexico Canned Navy Beans Regional Analysis and Outlook
8.3. Europe Canned Navy Beans Revenue (USD Million), by Country (2021-2032)
8.3.1. Germany Canned Navy Beans Regional Analysis and Outlook
8.3.2. France Canned Navy Beans Regional Analysis and Outlook
8.3.3. United Kingdom Canned Navy Beans Regional Analysis and Outlook
8.3.4. Spain Canned Navy Beans Regional Analysis and Outlook
8.3.5. Italy Canned Navy Beans Regional Analysis and Outlook
8.3.6. Russia Canned Navy Beans Regional Analysis and Outlook
8.3.7. Rest of Europe Canned Navy Beans Regional Analysis and Outlook
8.4. Asia Pacific Canned Navy Beans Revenue (USD Million) by Country (2021-2032)
8.4.1. China Canned Navy Beans Regional Analysis and Outlook
8.4.2. Japan Canned Navy Beans Regional Analysis and Outlook
8.4.3. India Canned Navy Beans Regional Analysis and Outlook
8.4.4. South Korea Canned Navy Beans Regional Analysis and Outlook
8.4.5. Australia Canned Navy Beans Regional Analysis and Outlook
8.4.6. South East Asia Canned Navy Beans Regional Analysis and Outlook
8.4.7. Rest of Asia Pacific Canned Navy Beans Regional Analysis and Outlook
8.5. South America Canned Navy Beans Revenue (USD Million), by Country (2021-2032)
8.5.1. Brazil Canned Navy Beans Regional Analysis and Outlook
8.5.2. Argentina Canned Navy Beans Regional Analysis and Outlook
8.5.3. Rest of South America Canned Navy Beans Regional Analysis and Outlook
8.6. Middle East and Africa Canned Navy Beans Revenue (USD Million) by Country (2021-2032)
8.6.1. Middle East Canned Navy Beans Regional Analysis and Outlook
8.6.2. Africa Canned Navy Beans Regional Analysis and Outlook
Chapter 9. North America Canned Navy Beans Analysis and Outlook
9.1. North America Canned Navy Beans Revenue (USD Million) by Segments (2021-2032)
9.1.1. North America Canned Navy Beans Revenue (USD Million) by Type (2021-2032)
9.1.2. North America Canned Navy Beans Revenue (USD Million) by Application (2021-2032)
9.1.3. North America Canned Navy Beans Revenue (USD Million) by Product (2021-2032)
By Type
Dry Beans
Wet Beans
By Sales Channel
Online
Offline
Chapter 10. Europe Canned Navy Beans Analysis and Outlook
10.1. Europe Canned Navy Beans Revenue (USD Million), by Segments (USD Million) (2021-2032)
10.1.1. Europe Canned Navy Beans Revenue (USD Million) by Type (2021-2032)
10.1.2. Europe Canned Navy Beans Revenue (USD Million) by Application (2021-2032)
10.1.3. Europe Canned Navy Beans Revenue (USD Million) by Product (2021-2032)
By Type
Dry Beans
Wet Beans
By Sales Channel
Online
Offline
Chapter 11. Asia Pacific Canned Navy Beans Analysis and Outlook
11.1. Asia Pacific Canned Navy Beans Revenue (USD Million), and Revenue (USD Million) by Segments (2021-2032)
11.1.1. Asia Pacific Canned Navy Beans Revenue (USD Million) by Type (2021-2032)
11.1.2. Asia Pacific Canned Navy Beans Revenue (USD Million) by Application (2021-2032)
11.1.3. Asia Pacific Canned Navy Beans Revenue (USD Million) by Product (2021-2032)
By Type
Dry Beans
Wet Beans
By Sales Channel
Online
Offline
Chapter 12. South America Canned Navy Beans Analysis and Outlook
12.1. South America Canned Navy Beans Revenue (USD Million), by Segments (2021-2032)
12.1.1. South America Canned Navy Beans Revenue (USD Million) by Type (2021-2032)
12.1.2. South America Canned Navy Beans Revenue (USD Million) by Application (2021-2032)
12.1.3. South America Canned Navy Beans Revenue (USD Million) by Product (2021-2032)
By Type
Dry Beans
Wet Beans
By Sales Channel
Online
Offline
Chapter 13. Middle East and Africa Canned Navy Beans Analysis and Outlook
13.1. Middle East and Africa Canned Navy Beans Revenue (USD Million), by Segments (2021-2032)
13.1.1. Middle East and Africa Canned Navy Beans Revenue (USD Million) by Type (2021-2032)
13.1.2. Middle East and Africa Canned Navy Beans Revenue (USD Million) by Application (2021-2032)
13.1.3. Middle East and Africa Canned Navy Beans Revenue (USD Million) by Product (2021-2032)
By Type
Dry Beans
Wet Beans
By Sales Channel
Online
Offline
Chapter 14. Canned Navy Beans Company Profiles
14.1 Business Overview
14.2 Product Profiles
14.3 SWOT Profiles
14.5 Recent Developments
14.6 Financial Profile
List of Companies
BUSH'S Beans
Eden Foods
Edgell
Goya Foods
Kuners Food
S&W Beans
15. Methodology and Data Sources
15.1 Customization Offerings
15.2 Subscription Services
15.3 Related Reports
15.4 Publisher Expertise
LIST OF TABLES
Table 1 Market Segmentation Analysis
Table 2 Global Canned Navy Beans Market Share of Leading Companies, 2023
Table 3 Product Offerings of Leading Companies
Table 4 Low Growth Scenario Forecasts
Table 5 Reference Case Growth Scenario
Table 6 High Growth Case Scenario
Table 7 Global Canned Navy Beans Revenue (USD Million) And CAGR (%) By Type (2021-2032)
Table 8 Global Canned Navy Beans Revenue (USD Million) And CAGR (%) By Application (2021-2032)
Table 9 Global Canned Navy Beans Revenue (USD Million) And CAGR (%) By Product (2021-2032)
Table 10 Global Canned Navy Beans Market Revenue (USD Million) By Regions (2021-2032)
Table 11 Global Canned Navy Beans Market Share (%) By Regions (2021-2032)
Table 12 North America Canned Navy Beans Revenue (USD Million) By Country (2021-2032)
Table 13 Europe Canned Navy Beans Revenue (USD Million) By Country (2021-2032)
Table 14 Asia Pacific Canned Navy Beans Revenue (USD Million) By Country (2021-2032)
Table 15 South America Canned Navy Beans Revenue (USD Million) By Country (2021-2032)
Table 16 Middle East and Africa Canned Navy Beans Revenue (USD Million) By Region (2021-2032)
Table 17 North America Canned Navy Beans Revenue (USD Million) By Type (2021-2032)
Table 18 North America Canned Navy Beans Revenue (USD Million) By Application (2021-2032)
Table 19 North America Canned Navy Beans Revenue (USD Million) By Product (2021-2032)
Table 20 Europe Canned Navy Beans Revenue (USD Million) By Type (2021-2032)
Table 21 Europe Canned Navy Beans Revenue (USD Million) By Application (2021-2032)
Table 22 Europe Canned Navy Beans Revenue (USD Million) By Product (2021-2032)
Table 23 Asia Pacific Canned Navy Beans Revenue (USD Million) By Type (2021-2032)
Table 24 Asia Pacific Canned Navy Beans Revenue (USD Million) By Application (2021-2032)
Table 25 Asia Pacific Canned Navy Beans Revenue (USD Million) By Product (2021-2032)
Table 26 South America Canned Navy Beans Revenue (USD Million) By Type (2021-2032)
Table 27 South America Canned Navy Beans Revenue (USD Million) By Application (2021-2032)
Table 28 South America Canned Navy Beans Revenue (USD Million) By Product (2021-2032)
Table 29 Middle East and Africa Canned Navy Beans Revenue (USD Million) By Type (2021-2032)
Table 30 Middle East and Africa Canned Navy Beans Revenue (USD Million) By Application (2021-2032)
Table 31 Middle East and Africa Canned Navy Beans Revenue (USD Million) By Product (2021-2032)
LIST OF FIGURES
Figure 1. Market Scope
Figure 2. Pricing Forecasts Per Unit, 2023- 2032
Figure 3. Porter’s Five Forces
Figure 4. Global Canned Navy Beans Market Revenue (USD Million) By Regions (2021-2032)
Figure 5. Global Canned Navy Beans Market Share (%) By Regions (2023)
Figure 6. North America Canned Navy Beans Revenue (USD Million) By Country (2021-2032)
Figure 7. United States Canned Navy Beans Revenue (USD Million) By Country (2021-2032)
Figure 8. Canada Canned Navy Beans Revenue (USD Million) By Country (2021-2032)
Figure 9. Mexico Canned Navy Beans Revenue (USD Million) By Country (2021-2032)
Figure 10. Europe Canned Navy Beans Revenue (USD Million) By Country (2021-2032)
Figure 11. Germany Canned Navy Beans Revenue (USD Million) By Country (2021-2032)
Figure 12. France Canned Navy Beans Revenue (USD Million) By Country (2021-2032)
Figure 13. United Kingdom Canned Navy Beans Revenue (USD Million) By Country (2021-2032)
Figure 14. Spain Canned Navy Beans Revenue (USD Million) By Country (2021-2032)
Figure 15. Italy Canned Navy Beans Revenue (USD Million) By Country (2021-2032)
Figure 16. Russia Canned Navy Beans Revenue (USD Million) By Country (2021-2032)
Figure 17. Rest of Europe Canned Navy Beans Revenue (USD Million) By Country (2021-2032)
Figure 11. Asia Pacific Canned Navy Beans Revenue (USD Million) By Country (2021-2032)
Figure 12. China Canned Navy Beans Revenue (USD Million) By Country (2021-2032)
Figure 13. Japan Canned Navy Beans Revenue (USD Million) By Country (2021-2032)
Figure 14. India Canned Navy Beans Revenue (USD Million) By Country (2021-2032)
Figure 15. South Korea Canned Navy Beans Revenue (USD Million) By Country (2021-2032)
Figure 16. Australia Canned Navy Beans Revenue (USD Million) By Country (2021-2032)
Figure 17. South East Asia Canned Navy Beans Revenue (USD Million) By Country (2021-2032)
Figure 18. South America Canned Navy Beans Revenue (USD Million) By Country (2021-2032)
Figure 19. Brazil Canned Navy Beans Revenue (USD Million) By Country (2021-2032)
Figure 20. Argentina Canned Navy Beans Revenue (USD Million) By Country (2021-2032)
Figure 21. Rest of Asia Pacific Canned Navy Beans Revenue (USD Million) By Country (2021-2032)
Figure 22. Middle East and Africa Canned Navy Beans Revenue (USD Million) By Region (2021-2032)
Figure 23. Saudi Arabia Canned Navy Beans Revenue (USD Million) By Region (2021-2032)
Figure 24. The UAE Canned Navy Beans Revenue (USD Million) By Region (2021-2032)
Figure 25. Rest of Middle East Canned Navy Beans Revenue (USD Million) By Region (2021-2032)
Figure 26. South Africa Canned Navy Beans Revenue (USD Million) By Region (2021-2032)
Figure 27. Africa Canned Navy Beans Revenue (USD Million) By Region (2021-2032)
Figure 28. North America Canned Navy Beans Revenue (USD Million) By Type (2021-2032)
Figure 29. North America Canned Navy Beans Revenue (USD Million) By Application (2021-2032)
Figure 30. North America Canned Navy Beans Revenue (USD Million) By Product (2021-2032)
Figure 31. Europe Canned Navy Beans Revenue (USD Million) By Type (2021-2032)
Figure 32. Europe Canned Navy Beans Revenue (USD Million) By Application (2021-2032)
Figure 33. Europe Canned Navy Beans Revenue (USD Million) By Product (2021-2032)
Figure 34. Asia Pacific Canned Navy Beans Revenue (USD Million) By Type (2021-2032)
Figure 35. Asia Pacific Canned Navy Beans Revenue (USD Million) By Application (2021-2032)
Figure 36. Asia Pacific Canned Navy Beans Revenue (USD Million) By Product (2021-2032)
Figure 37. South America Canned Navy Beans Revenue (USD Million) By Type (2021-2032)
Figure 38. South America Canned Navy Beans Revenue (USD Million) By Application (2021-2032)
Figure 39. South America Canned Navy Beans Revenue (USD Million) By Product (2021-2032)
Figure 40. Middle East and Africa Canned Navy Beans Revenue (USD Million) By Type (2021-2032)
Figure 41. Middle East and Africa Canned Navy Beans Revenue (USD Million) By Application (2021-2032)
Figure 42. Middle East and Africa Canned Navy Beans Revenue (USD Million) By Product (2021-2032)
By Type
Dry Beans
Wet Beans
By Sales Channel
Online
Offline
Countries Analyzed
North America (US, Canada, Mexico)
Europe (Germany, UK, France, Spain, Italy, Russia, Rest of Europe)
Asia Pacific (China, India, Japan, South Korea, Australia, South East Asia, Rest of Asia)
South America (Brazil, Argentina, Rest of South America)
Middle East and Africa (Saudi Arabia, UAE, Rest of Middle East, South Africa, Egypt, Rest of Africa)
