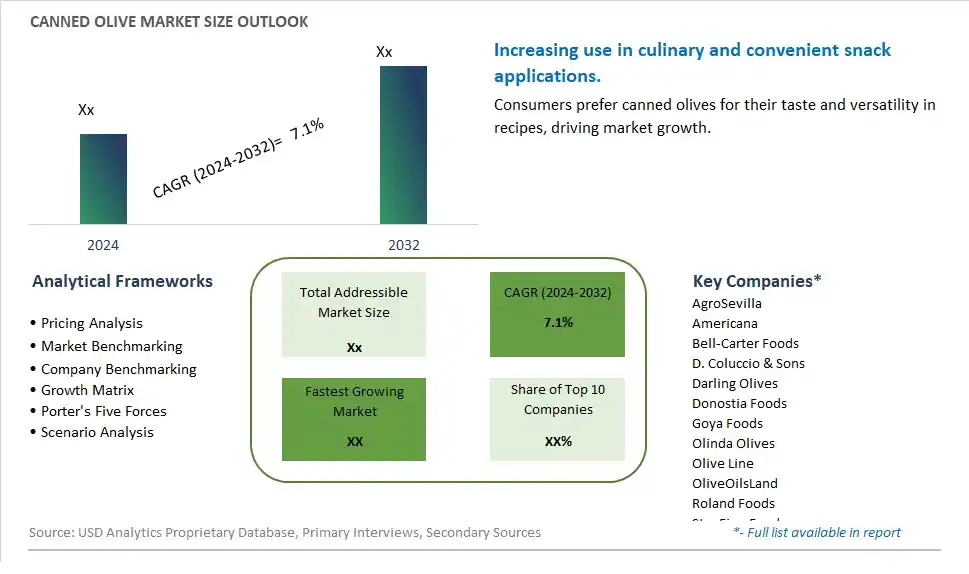
Global Canned Olive Market Size is valued at $XX Million in 2024 and is forecast to register a growth rate (CAGR) of 7.1% to reach $XX Million by 2032.
The global Canned Olive Market Comprehensive Study analyzes and forecasts the market size across 6 regions and 24 countries for diverse segments -By Type (Black Olive, Green Olive), By Application (Supermarkets/Hypermarkets, Convenience Stores, Online Retail, Others)
An Introduction to Canned Olive Market
In 2024, the Canned Olive market is witnessing robust growth, driven by the increasing demand for versatile and flavorful culinary ingredients. Canned olives, available in a variety of types and flavors, are used in salads, pizzas, pastas, and as snacks. The market is supported by the growing popularity of Mediterranean cuisine and the trend towards healthy eating. Advances in canning technology and preservation methods are enhancing the quality, flavor, and shelf life of canned olives. The market is also benefiting from the trend towards clean-label and organic products, appealing to health-conscious consumers seeking high-quality and convenient food options.
Canned Olive Competitive Landscape
The market report analyses the leading companies in the industry including AgroSevilla, Americana, Bell-Carter Foods, D. Coluccio & Sons, Darling Olives, Donostia Foods, Goya Foods, Olinda Olives, Olive Line, OliveOilsLand, Roland Foods, Star Fine Foods, Sysco, Tesoro Del Rio, Transmed Foods, Wadi Food, Ybarra, and Others.
Canned Olive Market Dynamics
Canned Olive Market Trend: Growing Demand for Healthy and Flavorful Ingredients
A prominent market trend for canned olives is the growing demand for healthy and flavorful ingredients. Consumers are increasingly conscious of their diet choices and are seeking natural, nutritious, and delicious options. Canned olives, known for their rich flavor profile and health benefits, such as being a good source of healthy fats and antioxidants, are gaining popularity among health-conscious consumers looking to enhance the taste and nutritional value of their meals.
Canned Olive Market Driver: Rising Preference for Mediterranean Cuisine
The market driver for canned olives is the rising preference for Mediterranean cuisine. Olives are a key ingredient in Mediterranean dishes like salads, pasta, pizzas, and tapenades. As the popularity of Mediterranean cuisine continues to grow globally, the demand for canned olives as a convenient and versatile ingredient is also increasing. This culinary trend is driving the consumption of canned olives among consumers who enjoy Mediterranean flavors and cooking styles.
Canned Olive Market Opportunity: Innovation in Flavors and Packaging
An opportunity within the canned olive market lies in innovation in flavors and packaging. Manufacturers can capitalize on consumer preferences for unique and exotic flavors by introducing new varieties of canned olives infused with herbs, spices, or marinades. Additionally, offering convenient packaging options such as resealable pouches or single-serve portions can attract consumers looking for on-the-go snacking solutions or portion-controlled servings. By focusing on product innovation and packaging convenience, companies can expand their market reach and cater to diverse consumer needs and preferences.
Canned Olive Market Share Analysis: Green Olive segment generated the highest revenue share in the industry
The largest segment in the Canned Olive Market is the Green Olive category. Green olives are harvested before they ripen fully, giving them a firmer texture and a slightly bitter taste compared to ripe black olives. This segment's dominance can be attributed to several factors. Firstly, green olives are versatile and widely used in various culinary applications, including salads, pizzas, sandwiches, and tapenades, contributing to their high demand across different cuisines globally. Further, green olives are preferred by consumers who enjoy a tangier and less intense flavor profile compared to black olives, making them a popular choice in both home cooking and food service establishments. Lastly, green olives are known for their nutritional benefits, being rich in antioxidants, healthy fats, and vitamins, which adds to their appeal among health-conscious consumers. With increasing consumer awareness about Mediterranean diets and the health benefits of olives, the Green Olive segment is expected to maintain its position as the largest segment in the Canned Olive Market, driving steady growth in the coming years.
Canned Olive Market Share Analysis: Online Retail is the fastest growing segment over the forecast period to 2032
The fastest-growing segment in the Canned Olive Market is Online Retail. This growth can be attributed to several factors. Firstly, the increasing adoption of e-commerce platforms and the convenience they offer have made online shopping for groceries and food products more accessible and preferred by consumers. With the proliferation of online grocery stores and specialty food retailers, consumers can now easily access a wide range of canned olive products from the comfort of their homes, contributing to the growth of online sales. Further, the Past few yearshas further accelerated the shift towards online shopping as consumers prioritize safety and contactless delivery options. This trend is expected to continue even post-pandemic as consumers have become accustomed to the convenience and benefits of online shopping. Lastly, online retailers often offer a broader selection of canned olive products, including specialty and gourmet varieties, catering to diverse consumer preferences and driving demand. As a result, the Online Retail segment is poised for significant growth in the Canned Olive Market, offering convenience, variety, and accessibility to consumers globally.
Canned Olive Market Segmentation
By Type
Black Olive
Green Olive
By Application
Supermarkets/Hypermarkets
Convenience Stores
Online Retail
Others
Countries Analyzed
North America (US, Canada, Mexico)
Europe (Germany, UK, France, Spain, Italy, Russia, Rest of Europe)
Asia Pacific (China, India, Japan, South Korea, Australia, South East Asia, Rest of Asia)
South America (Brazil, Argentina, Rest of South America)
Middle East and Africa (Saudi Arabia, UAE, Rest of Middle East, South Africa, Egypt, Rest of Africa)
Canned Olive Companies Profiled in the Study
AgroSevilla
Americana
Bell-Carter Foods
D. Coluccio & Sons
Darling Olives
Donostia Foods
Goya Foods
Olinda Olives
Olive Line
OliveOilsLand
Roland Foods
Star Fine Foods
Sysco
Tesoro Del Rio
Transmed Foods
Wadi Food
Ybarra
*- List Not Exhaustive
Chapter 1. TABLE OF CONTENTS
Chapter 2. Introduction to Canned Olive Market
2.1. Market Overview
2.2. Key Statistics and Report Highlights
2.3. Scope of the Comprehensive Study
2.3.1. Market Definition
2.3.2 Countries and Regions Covered
2.3.3 Research Objective
2.3.4 Units, Currency, and Conversions
2.3.5 Industry Value Chain
2.4. Key Market Segments
2.5. Key Companies
2.6. Study Period
Chapter 3. Strategic Analysis Review
3.1. Canned Olive Pricing Analysis and Forecast
3.2. Porter’s Five Forces
3.3. Market Ecosystem
3.4. SWOT Analysis
3.5. Regulatory Scenario
3.3. Effects of Inflation, Russia-Ukraine War, moderating economic growth, and other macroeconomic factors
Chapter 4. Competitive Landscape
4.1. Market Share Analysis
4.1.1. Global Canned Olive Market Share by Company, 2023
4.1.2. Product Offerings of Leading Canned Olive Companies
4.2. Market Entropy
4.2.1. New Product Launches in the Industry
4.2.2. Mergers, Acquisitions, Joint ventures, and Partnerships
4.3. Key Strategies and Best Practices
Chapter 5. Global Market Projections: Best, Reference, and Low Case Scenarios
5.1. Growth Analysis- Case Scenario Definitions
5.2. Low Growth Case Scenario Forecasts
5.3. Reference Growth Case Scenario Forecasts
5.4. High Growth Case Scenario Forecasts
Chapter 6. Market Dynamics
6.1. Canned Olive Market Drivers
6.2. Canned Olive Market Challenges
6.6. Canned Olive Market Opportunities
6.4. Canned Olive Market Trends
Chapter 7. Global Canned Olive Market Outlook Trends
7.1. Global Canned Olive Revenue (USD Million) and CAGR (%) by Type (2021-2032)
7.2. Global Canned Olive Revenue (USD Million) and CAGR (%) by Application (2021-2032)
7.3. Global Canned Olive Revenue (USD Million) and CAGR (%) by Product (2021-2032)
By Type
Black Olive
Green Olive
By Application
Supermarkets/Hypermarkets
Convenience Stores
Online Retail
Others
Chapter 8. Global Canned Olive Regional Analysis and Outlook
8.1. Global Canned Olive Revenue (USD Million) By Regions (2021- 2032)
8.2. North America Canned Olive Revenue (USD Million) by Country (2021-2032)
8.2.1. United States Canned Olive Regional Analysis and Outlook
8.2.2. Canada Canned Olive Regional Analysis and Outlook
8.2.3. Mexico Canned Olive Regional Analysis and Outlook
8.3. Europe Canned Olive Revenue (USD Million), by Country (2021-2032)
8.3.1. Germany Canned Olive Regional Analysis and Outlook
8.3.2. France Canned Olive Regional Analysis and Outlook
8.3.3. United Kingdom Canned Olive Regional Analysis and Outlook
8.3.4. Spain Canned Olive Regional Analysis and Outlook
8.3.5. Italy Canned Olive Regional Analysis and Outlook
8.3.6. Russia Canned Olive Regional Analysis and Outlook
8.3.7. Rest of Europe Canned Olive Regional Analysis and Outlook
8.4. Asia Pacific Canned Olive Revenue (USD Million) by Country (2021-2032)
8.4.1. China Canned Olive Regional Analysis and Outlook
8.4.2. Japan Canned Olive Regional Analysis and Outlook
8.4.3. India Canned Olive Regional Analysis and Outlook
8.4.4. South Korea Canned Olive Regional Analysis and Outlook
8.4.5. Australia Canned Olive Regional Analysis and Outlook
8.4.6. South East Asia Canned Olive Regional Analysis and Outlook
8.4.7. Rest of Asia Pacific Canned Olive Regional Analysis and Outlook
8.5. South America Canned Olive Revenue (USD Million), by Country (2021-2032)
8.5.1. Brazil Canned Olive Regional Analysis and Outlook
8.5.2. Argentina Canned Olive Regional Analysis and Outlook
8.5.3. Rest of South America Canned Olive Regional Analysis and Outlook
8.6. Middle East and Africa Canned Olive Revenue (USD Million) by Country (2021-2032)
8.6.1. Middle East Canned Olive Regional Analysis and Outlook
8.6.2. Africa Canned Olive Regional Analysis and Outlook
Chapter 9. North America Canned Olive Analysis and Outlook
9.1. North America Canned Olive Revenue (USD Million) by Segments (2021-2032)
9.1.1. North America Canned Olive Revenue (USD Million) by Type (2021-2032)
9.1.2. North America Canned Olive Revenue (USD Million) by Application (2021-2032)
9.1.3. North America Canned Olive Revenue (USD Million) by Product (2021-2032)
By Type
Black Olive
Green Olive
By Application
Supermarkets/Hypermarkets
Convenience Stores
Online Retail
Others
Chapter 10. Europe Canned Olive Analysis and Outlook
10.1. Europe Canned Olive Revenue (USD Million), by Segments (USD Million) (2021-2032)
10.1.1. Europe Canned Olive Revenue (USD Million) by Type (2021-2032)
10.1.2. Europe Canned Olive Revenue (USD Million) by Application (2021-2032)
10.1.3. Europe Canned Olive Revenue (USD Million) by Product (2021-2032)
By Type
Black Olive
Green Olive
By Application
Supermarkets/Hypermarkets
Convenience Stores
Online Retail
Others
Chapter 11. Asia Pacific Canned Olive Analysis and Outlook
11.1. Asia Pacific Canned Olive Revenue (USD Million), and Revenue (USD Million) by Segments (2021-2032)
11.1.1. Asia Pacific Canned Olive Revenue (USD Million) by Type (2021-2032)
11.1.2. Asia Pacific Canned Olive Revenue (USD Million) by Application (2021-2032)
11.1.3. Asia Pacific Canned Olive Revenue (USD Million) by Product (2021-2032)
By Type
Black Olive
Green Olive
By Application
Supermarkets/Hypermarkets
Convenience Stores
Online Retail
Others
Chapter 12. South America Canned Olive Analysis and Outlook
12.1. South America Canned Olive Revenue (USD Million), by Segments (2021-2032)
12.1.1. South America Canned Olive Revenue (USD Million) by Type (2021-2032)
12.1.2. South America Canned Olive Revenue (USD Million) by Application (2021-2032)
12.1.3. South America Canned Olive Revenue (USD Million) by Product (2021-2032)
By Type
Black Olive
Green Olive
By Application
Supermarkets/Hypermarkets
Convenience Stores
Online Retail
Others
Chapter 13. Middle East and Africa Canned Olive Analysis and Outlook
13.1. Middle East and Africa Canned Olive Revenue (USD Million), by Segments (2021-2032)
13.1.1. Middle East and Africa Canned Olive Revenue (USD Million) by Type (2021-2032)
13.1.2. Middle East and Africa Canned Olive Revenue (USD Million) by Application (2021-2032)
13.1.3. Middle East and Africa Canned Olive Revenue (USD Million) by Product (2021-2032)
By Type
Black Olive
Green Olive
By Application
Supermarkets/Hypermarkets
Convenience Stores
Online Retail
Others
Chapter 14. Canned Olive Company Profiles
14.1 Business Overview
14.2 Product Profiles
14.3 SWOT Profiles
14.5 Recent Developments
14.6 Financial Profile
List of Companies
AgroSevilla
Americana
Bell-Carter Foods
D. Coluccio & Sons
Darling Olives
Donostia Foods
Goya Foods
Olinda Olives
Olive Line
OliveOilsLand
Roland Foods
Star Fine Foods
Sysco
Tesoro Del Rio
Transmed Foods
Wadi Food
Ybarra
15. Methodology and Data Sources
15.1 Customization Offerings
15.2 Subscription Services
15.3 Related Reports
15.4 Publisher Expertise
LIST OF TABLES
Table 1 Market Segmentation Analysis
Table 2 Global Canned Olive Market Share of Leading Companies, 2023
Table 3 Product Offerings of Leading Companies
Table 4 Low Growth Scenario Forecasts
Table 5 Reference Case Growth Scenario
Table 6 High Growth Case Scenario
Table 7 Global Canned Olive Revenue (USD Million) And CAGR (%) By Type (2021-2032)
Table 8 Global Canned Olive Revenue (USD Million) And CAGR (%) By Application (2021-2032)
Table 9 Global Canned Olive Revenue (USD Million) And CAGR (%) By Product (2021-2032)
Table 10 Global Canned Olive Market Revenue (USD Million) By Regions (2021-2032)
Table 11 Global Canned Olive Market Share (%) By Regions (2021-2032)
Table 12 North America Canned Olive Revenue (USD Million) By Country (2021-2032)
Table 13 Europe Canned Olive Revenue (USD Million) By Country (2021-2032)
Table 14 Asia Pacific Canned Olive Revenue (USD Million) By Country (2021-2032)
Table 15 South America Canned Olive Revenue (USD Million) By Country (2021-2032)
Table 16 Middle East and Africa Canned Olive Revenue (USD Million) By Region (2021-2032)
Table 17 North America Canned Olive Revenue (USD Million) By Type (2021-2032)
Table 18 North America Canned Olive Revenue (USD Million) By Application (2021-2032)
Table 19 North America Canned Olive Revenue (USD Million) By Product (2021-2032)
Table 20 Europe Canned Olive Revenue (USD Million) By Type (2021-2032)
Table 21 Europe Canned Olive Revenue (USD Million) By Application (2021-2032)
Table 22 Europe Canned Olive Revenue (USD Million) By Product (2021-2032)
Table 23 Asia Pacific Canned Olive Revenue (USD Million) By Type (2021-2032)
Table 24 Asia Pacific Canned Olive Revenue (USD Million) By Application (2021-2032)
Table 25 Asia Pacific Canned Olive Revenue (USD Million) By Product (2021-2032)
Table 26 South America Canned Olive Revenue (USD Million) By Type (2021-2032)
Table 27 South America Canned Olive Revenue (USD Million) By Application (2021-2032)
Table 28 South America Canned Olive Revenue (USD Million) By Product (2021-2032)
Table 29 Middle East and Africa Canned Olive Revenue (USD Million) By Type (2021-2032)
Table 30 Middle East and Africa Canned Olive Revenue (USD Million) By Application (2021-2032)
Table 31 Middle East and Africa Canned Olive Revenue (USD Million) By Product (2021-2032)
LIST OF FIGURES
Figure 1. Market Scope
Figure 2. Pricing Forecasts Per Unit, 2023- 2032
Figure 3. Porter’s Five Forces
Figure 4. Global Canned Olive Market Revenue (USD Million) By Regions (2021-2032)
Figure 5. Global Canned Olive Market Share (%) By Regions (2023)
Figure 6. North America Canned Olive Revenue (USD Million) By Country (2021-2032)
Figure 7. United States Canned Olive Revenue (USD Million) By Country (2021-2032)
Figure 8. Canada Canned Olive Revenue (USD Million) By Country (2021-2032)
Figure 9. Mexico Canned Olive Revenue (USD Million) By Country (2021-2032)
Figure 10. Europe Canned Olive Revenue (USD Million) By Country (2021-2032)
Figure 11. Germany Canned Olive Revenue (USD Million) By Country (2021-2032)
Figure 12. France Canned Olive Revenue (USD Million) By Country (2021-2032)
Figure 13. United Kingdom Canned Olive Revenue (USD Million) By Country (2021-2032)
Figure 14. Spain Canned Olive Revenue (USD Million) By Country (2021-2032)
Figure 15. Italy Canned Olive Revenue (USD Million) By Country (2021-2032)
Figure 16. Russia Canned Olive Revenue (USD Million) By Country (2021-2032)
Figure 17. Rest of Europe Canned Olive Revenue (USD Million) By Country (2021-2032)
Figure 11. Asia Pacific Canned Olive Revenue (USD Million) By Country (2021-2032)
Figure 12. China Canned Olive Revenue (USD Million) By Country (2021-2032)
Figure 13. Japan Canned Olive Revenue (USD Million) By Country (2021-2032)
Figure 14. India Canned Olive Revenue (USD Million) By Country (2021-2032)
Figure 15. South Korea Canned Olive Revenue (USD Million) By Country (2021-2032)
Figure 16. Australia Canned Olive Revenue (USD Million) By Country (2021-2032)
Figure 17. South East Asia Canned Olive Revenue (USD Million) By Country (2021-2032)
Figure 18. South America Canned Olive Revenue (USD Million) By Country (2021-2032)
Figure 19. Brazil Canned Olive Revenue (USD Million) By Country (2021-2032)
Figure 20. Argentina Canned Olive Revenue (USD Million) By Country (2021-2032)
Figure 21. Rest of Asia Pacific Canned Olive Revenue (USD Million) By Country (2021-2032)
Figure 22. Middle East and Africa Canned Olive Revenue (USD Million) By Region (2021-2032)
Figure 23. Saudi Arabia Canned Olive Revenue (USD Million) By Region (2021-2032)
Figure 24. The UAE Canned Olive Revenue (USD Million) By Region (2021-2032)
Figure 25. Rest of Middle East Canned Olive Revenue (USD Million) By Region (2021-2032)
Figure 26. South Africa Canned Olive Revenue (USD Million) By Region (2021-2032)
Figure 27. Africa Canned Olive Revenue (USD Million) By Region (2021-2032)
Figure 28. North America Canned Olive Revenue (USD Million) By Type (2021-2032)
Figure 29. North America Canned Olive Revenue (USD Million) By Application (2021-2032)
Figure 30. North America Canned Olive Revenue (USD Million) By Product (2021-2032)
Figure 31. Europe Canned Olive Revenue (USD Million) By Type (2021-2032)
Figure 32. Europe Canned Olive Revenue (USD Million) By Application (2021-2032)
Figure 33. Europe Canned Olive Revenue (USD Million) By Product (2021-2032)
Figure 34. Asia Pacific Canned Olive Revenue (USD Million) By Type (2021-2032)
Figure 35. Asia Pacific Canned Olive Revenue (USD Million) By Application (2021-2032)
Figure 36. Asia Pacific Canned Olive Revenue (USD Million) By Product (2021-2032)
Figure 37. South America Canned Olive Revenue (USD Million) By Type (2021-2032)
Figure 38. South America Canned Olive Revenue (USD Million) By Application (2021-2032)
Figure 39. South America Canned Olive Revenue (USD Million) By Product (2021-2032)
Figure 40. Middle East and Africa Canned Olive Revenue (USD Million) By Type (2021-2032)
Figure 41. Middle East and Africa Canned Olive Revenue (USD Million) By Application (2021-2032)
Figure 42. Middle East and Africa Canned Olive Revenue (USD Million) By Product (2021-2032)
By Type
Black Olive
Green Olive
By Application
Supermarkets/Hypermarkets
Convenience Stores
Online Retail
Others
Countries Analyzed
North America (US, Canada, Mexico)
Europe (Germany, UK, France, Spain, Italy, Russia, Rest of Europe)
Asia Pacific (China, India, Japan, South Korea, Australia, South East Asia, Rest of Asia)
South America (Brazil, Argentina, Rest of South America)
Middle East and Africa (Saudi Arabia, UAE, Rest of Middle East, South Africa, Egypt, Rest of Africa)
