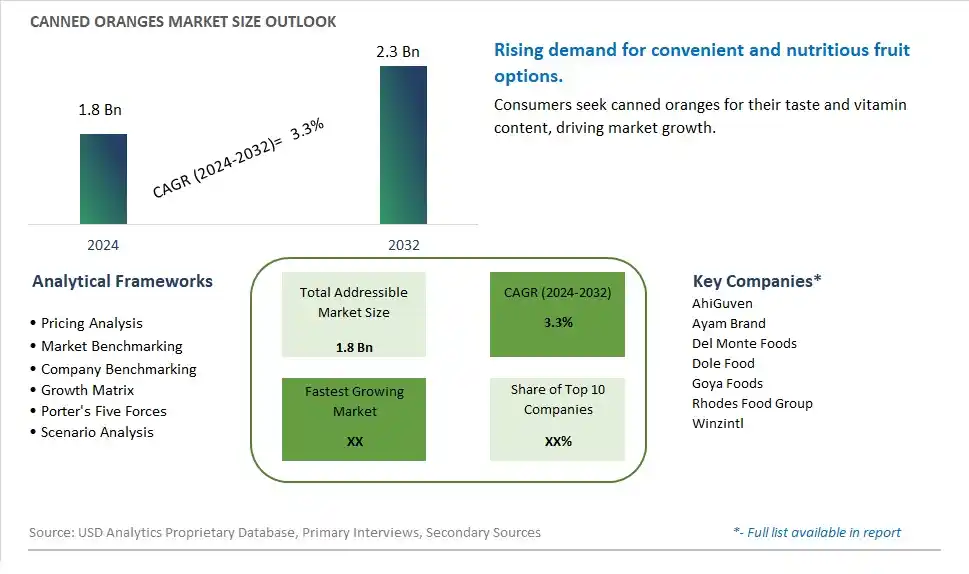
Global Canned Oranges Market Size is valued at $1.8 Billion in 2024 and is forecast to register a growth rate (CAGR) of 3.3% to reach $2.3 Billion by 2032.
The global Canned Oranges Market Comprehensive Study analyzes and forecasts the market size across 6 regions and 24 countries for diverse segments -By Type (Whole, Segment, Others), By Application (Supermarkets/Hypermarkets, Convenience Stores, Independent Retailers, Online Sales, Others)
An Introduction to Canned Oranges Market
The Canned Oranges market in 2024 is expanding steadily, driven by the demand for convenient and nutritious fruit options. Canned oranges, known for their refreshing flavor and high vitamin C content, are popular in desserts, salads, and as a snack. The market is supported by the growing trend towards healthy eating and the demand for ready-to-eat fruit products. Advances in canning technology and preservation methods are enhancing the flavor, texture, and nutritional content of canned oranges. The market is also benefiting from the trend towards clean-label and organic fruit products, appealing to health-conscious consumers seeking convenient and high-quality fruit options.
Canned Oranges Competitive Landscape
The market report analyses the leading companies in the industry including AhiGuven, Ayam Brand, Del Monte Foods, Dole Food, Goya Foods, Rhodes Food Group, Winzintl, and Others.
Canned Oranges Market Dynamics
Canned Oranges Market Trend: Growing Demand for Convenience and Ready-to-Eat Foods
A significant market trend for canned oranges is the growing demand for convenience and ready-to-eat foods. Consumers are increasingly seeking convenient food options that require minimal preparation time. Canned oranges provide a convenient solution as they are pre-sliced or segmented, eliminating the need for peeling and slicing fresh fruit. This trend is driven by busy lifestyles, a desire for quick and easy meal solutions, and the increasing preference for on-the-go snacks.
Canned Oranges Market Driver: Seasonality and Supply Chain Stability
The market driver for canned oranges is the seasonality of fresh oranges and the need for supply chain stability. Oranges are a seasonal fruit, with peak production periods leading to fluctuations in availability and pricing of fresh oranges. Canning oranges allows for year-round availability, ensuring a stable supply chain and consistent product quality. This driver is fueled by the desire for reliable sourcing and consistent product availability, especially in regions where fresh oranges may not be readily accessible year-round.
Canned Oranges Market Opportunity: Diversification of Product Offerings
An opportunity within the canned oranges market lies in the diversification of product offerings. Manufacturers can explore different varieties of canned oranges, such as mandarin oranges, blood oranges, or organic options, to cater to diverse consumer preferences. Additionally, introducing canned oranges in various formats, such as natural juice, syrup, or fruit cups, can appeal to different consumption occasions and usage preferences. By diversifying product offerings, companies can expand their market reach and capture a wider consumer base, including health-conscious consumers and those seeking flavorful and convenient fruit options.
Canned Oranges Market Share Analysis: Whole segment generated the highest revenue share in the industry
The largest segment in the Canned Oranges Market is Whole oranges. This segment comprises canned oranges that are preserved whole, including the peel, flesh, and juice. The popularity of whole canned oranges can be attributed to several factors. Firstly, whole canned oranges offer convenience to consumers as they can be readily used in various recipes, such as desserts, salads, and beverages, without the need for additional preparation. This convenience factor appeals to busy households and commercial food establishments looking for quick and easy solutions. Further, whole canned oranges retain their natural flavor, texture, and nutritional benefits, making them a preferred choice for health-conscious consumers seeking natural and wholesome food options. The whole segment also caters to consumers looking for versatile ingredients that can be used in both sweet and savory dishes, enhancing their culinary experience. As a result, the Whole segment dominates the Canned Oranges Market, offering convenience, flavor, and versatility to a wide range of consumers.
Canned Oranges Market Share Analysis: Online Sales is the fastest growing segment over the forecast period to 2032
The fastest-growing segment in the Canned Oranges Market is Online Sales. With the increasing digitalization of retail and the rise of e-commerce platforms, online sales of canned oranges are experiencing rapid growth. Several factors contribute to this trend. Firstly, the convenience of online shopping appeals to consumers looking for hassle-free purchasing experiences. They can browse a wide variety of canned oranges, compare prices, read reviews, and make purchases from the comfort of their homes or on-the-go through mobile devices. Further, online platforms offer a vast reach, allowing canned orange suppliers to target a global audience and tap into new markets beyond their geographical boundaries. This expansion in reach contributes significantly to the growth of online sales in the canned oranges segment. Additionally, the availability of promotional offers, discounts, and bundled deals on online platforms incentivizes consumers to buy canned oranges in bulk, further driving sales growth. As consumer preferences continue to shift towards online shopping, the Online Sales segment is poised to be the fastest-growing segment in the Canned Oranges Market, showcasing substantial potential for suppliers and retailers alike.
Canned Oranges Market Segmentation
By Type
Whole
Segment
Others
By Application
Supermarkets/Hypermarkets
Convenience Stores
Independent Retailers
Online Sales
Others
Countries Analyzed
North America (US, Canada, Mexico)
Europe (Germany, UK, France, Spain, Italy, Russia, Rest of Europe)
Asia Pacific (China, India, Japan, South Korea, Australia, South East Asia, Rest of Asia)
South America (Brazil, Argentina, Rest of South America)
Middle East and Africa (Saudi Arabia, UAE, Rest of Middle East, South Africa, Egypt, Rest of Africa)
Canned Oranges Companies Profiled in the Study
AhiGuven
Ayam Brand
Del Monte Foods
Dole Food
Goya Foods
Rhodes Food Group
Winzintl
*- List Not Exhaustive
Chapter 1. TABLE OF CONTENTS
Chapter 2. Introduction to Canned Oranges Market
2.1. Market Overview
2.2. Key Statistics and Report Highlights
2.3. Scope of the Comprehensive Study
2.3.1. Market Definition
2.3.2 Countries and Regions Covered
2.3.3 Research Objective
2.3.4 Units, Currency, and Conversions
2.3.5 Industry Value Chain
2.4. Key Market Segments
2.5. Key Companies
2.6. Study Period
Chapter 3. Strategic Analysis Review
3.1. Canned Oranges Pricing Analysis and Forecast
3.2. Porter’s Five Forces
3.3. Market Ecosystem
3.4. SWOT Analysis
3.5. Regulatory Scenario
3.3. Effects of Inflation, Russia-Ukraine War, moderating economic growth, and other macroeconomic factors
Chapter 4. Competitive Landscape
4.1. Market Share Analysis
4.1.1. Global Canned Oranges Market Share by Company, 2023
4.1.2. Product Offerings of Leading Canned Oranges Companies
4.2. Market Entropy
4.2.1. New Product Launches in the Industry
4.2.2. Mergers, Acquisitions, Joint ventures, and Partnerships
4.3. Key Strategies and Best Practices
Chapter 5. Global Market Projections: Best, Reference, and Low Case Scenarios
5.1. Growth Analysis- Case Scenario Definitions
5.2. Low Growth Case Scenario Forecasts
5.3. Reference Growth Case Scenario Forecasts
5.4. High Growth Case Scenario Forecasts
Chapter 6. Market Dynamics
6.1. Canned Oranges Market Drivers
6.2. Canned Oranges Market Challenges
6.6. Canned Oranges Market Opportunities
6.4. Canned Oranges Market Trends
Chapter 7. Global Canned Oranges Market Outlook Trends
7.1. Global Canned Oranges Revenue (USD Million) and CAGR (%) by Type (2021-2032)
7.2. Global Canned Oranges Revenue (USD Million) and CAGR (%) by Application (2021-2032)
7.3. Global Canned Oranges Revenue (USD Million) and CAGR (%) by Product (2021-2032)
By Type
Whole
Segment
Others
By Application
Supermarkets/Hypermarkets
Convenience Stores
Independent Retailers
Online Sales
Others
Chapter 8. Global Canned Oranges Regional Analysis and Outlook
8.1. Global Canned Oranges Revenue (USD Million) By Regions (2021- 2032)
8.2. North America Canned Oranges Revenue (USD Million) by Country (2021-2032)
8.2.1. United States Canned Oranges Regional Analysis and Outlook
8.2.2. Canada Canned Oranges Regional Analysis and Outlook
8.2.3. Mexico Canned Oranges Regional Analysis and Outlook
8.3. Europe Canned Oranges Revenue (USD Million), by Country (2021-2032)
8.3.1. Germany Canned Oranges Regional Analysis and Outlook
8.3.2. France Canned Oranges Regional Analysis and Outlook
8.3.3. United Kingdom Canned Oranges Regional Analysis and Outlook
8.3.4. Spain Canned Oranges Regional Analysis and Outlook
8.3.5. Italy Canned Oranges Regional Analysis and Outlook
8.3.6. Russia Canned Oranges Regional Analysis and Outlook
8.3.7. Rest of Europe Canned Oranges Regional Analysis and Outlook
8.4. Asia Pacific Canned Oranges Revenue (USD Million) by Country (2021-2032)
8.4.1. China Canned Oranges Regional Analysis and Outlook
8.4.2. Japan Canned Oranges Regional Analysis and Outlook
8.4.3. India Canned Oranges Regional Analysis and Outlook
8.4.4. South Korea Canned Oranges Regional Analysis and Outlook
8.4.5. Australia Canned Oranges Regional Analysis and Outlook
8.4.6. South East Asia Canned Oranges Regional Analysis and Outlook
8.4.7. Rest of Asia Pacific Canned Oranges Regional Analysis and Outlook
8.5. South America Canned Oranges Revenue (USD Million), by Country (2021-2032)
8.5.1. Brazil Canned Oranges Regional Analysis and Outlook
8.5.2. Argentina Canned Oranges Regional Analysis and Outlook
8.5.3. Rest of South America Canned Oranges Regional Analysis and Outlook
8.6. Middle East and Africa Canned Oranges Revenue (USD Million) by Country (2021-2032)
8.6.1. Middle East Canned Oranges Regional Analysis and Outlook
8.6.2. Africa Canned Oranges Regional Analysis and Outlook
Chapter 9. North America Canned Oranges Analysis and Outlook
9.1. North America Canned Oranges Revenue (USD Million) by Segments (2021-2032)
9.1.1. North America Canned Oranges Revenue (USD Million) by Type (2021-2032)
9.1.2. North America Canned Oranges Revenue (USD Million) by Application (2021-2032)
9.1.3. North America Canned Oranges Revenue (USD Million) by Product (2021-2032)
By Type
Whole
Segment
Others
By Application
Supermarkets/Hypermarkets
Convenience Stores
Independent Retailers
Online Sales
Others
Chapter 10. Europe Canned Oranges Analysis and Outlook
10.1. Europe Canned Oranges Revenue (USD Million), by Segments (USD Million) (2021-2032)
10.1.1. Europe Canned Oranges Revenue (USD Million) by Type (2021-2032)
10.1.2. Europe Canned Oranges Revenue (USD Million) by Application (2021-2032)
10.1.3. Europe Canned Oranges Revenue (USD Million) by Product (2021-2032)
By Type
Whole
Segment
Others
By Application
Supermarkets/Hypermarkets
Convenience Stores
Independent Retailers
Online Sales
Others
Chapter 11. Asia Pacific Canned Oranges Analysis and Outlook
11.1. Asia Pacific Canned Oranges Revenue (USD Million), and Revenue (USD Million) by Segments (2021-2032)
11.1.1. Asia Pacific Canned Oranges Revenue (USD Million) by Type (2021-2032)
11.1.2. Asia Pacific Canned Oranges Revenue (USD Million) by Application (2021-2032)
11.1.3. Asia Pacific Canned Oranges Revenue (USD Million) by Product (2021-2032)
By Type
Whole
Segment
Others
By Application
Supermarkets/Hypermarkets
Convenience Stores
Independent Retailers
Online Sales
Others
Chapter 12. South America Canned Oranges Analysis and Outlook
12.1. South America Canned Oranges Revenue (USD Million), by Segments (2021-2032)
12.1.1. South America Canned Oranges Revenue (USD Million) by Type (2021-2032)
12.1.2. South America Canned Oranges Revenue (USD Million) by Application (2021-2032)
12.1.3. South America Canned Oranges Revenue (USD Million) by Product (2021-2032)
By Type
Whole
Segment
Others
By Application
Supermarkets/Hypermarkets
Convenience Stores
Independent Retailers
Online Sales
Others
Chapter 13. Middle East and Africa Canned Oranges Analysis and Outlook
13.1. Middle East and Africa Canned Oranges Revenue (USD Million), by Segments (2021-2032)
13.1.1. Middle East and Africa Canned Oranges Revenue (USD Million) by Type (2021-2032)
13.1.2. Middle East and Africa Canned Oranges Revenue (USD Million) by Application (2021-2032)
13.1.3. Middle East and Africa Canned Oranges Revenue (USD Million) by Product (2021-2032)
By Type
Whole
Segment
Others
By Application
Supermarkets/Hypermarkets
Convenience Stores
Independent Retailers
Online Sales
Others
Chapter 14. Canned Oranges Company Profiles
14.1 Business Overview
14.2 Product Profiles
14.3 SWOT Profiles
14.5 Recent Developments
14.6 Financial Profile
List of Companies
AhiGuven
Ayam Brand
Del Monte Foods
Dole Food
Goya Foods
Rhodes Food Group
Winzintl
15. Methodology and Data Sources
15.1 Customization Offerings
15.2 Subscription Services
15.3 Related Reports
15.4 Publisher Expertise
LIST OF TABLES
Table 1 Market Segmentation Analysis
Table 2 Global Canned Oranges Market Share of Leading Companies, 2023
Table 3 Product Offerings of Leading Companies
Table 4 Low Growth Scenario Forecasts
Table 5 Reference Case Growth Scenario
Table 6 High Growth Case Scenario
Table 7 Global Canned Oranges Revenue (USD Million) And CAGR (%) By Type (2021-2032)
Table 8 Global Canned Oranges Revenue (USD Million) And CAGR (%) By Application (2021-2032)
Table 9 Global Canned Oranges Revenue (USD Million) And CAGR (%) By Product (2021-2032)
Table 10 Global Canned Oranges Market Revenue (USD Million) By Regions (2021-2032)
Table 11 Global Canned Oranges Market Share (%) By Regions (2021-2032)
Table 12 North America Canned Oranges Revenue (USD Million) By Country (2021-2032)
Table 13 Europe Canned Oranges Revenue (USD Million) By Country (2021-2032)
Table 14 Asia Pacific Canned Oranges Revenue (USD Million) By Country (2021-2032)
Table 15 South America Canned Oranges Revenue (USD Million) By Country (2021-2032)
Table 16 Middle East and Africa Canned Oranges Revenue (USD Million) By Region (2021-2032)
Table 17 North America Canned Oranges Revenue (USD Million) By Type (2021-2032)
Table 18 North America Canned Oranges Revenue (USD Million) By Application (2021-2032)
Table 19 North America Canned Oranges Revenue (USD Million) By Product (2021-2032)
Table 20 Europe Canned Oranges Revenue (USD Million) By Type (2021-2032)
Table 21 Europe Canned Oranges Revenue (USD Million) By Application (2021-2032)
Table 22 Europe Canned Oranges Revenue (USD Million) By Product (2021-2032)
Table 23 Asia Pacific Canned Oranges Revenue (USD Million) By Type (2021-2032)
Table 24 Asia Pacific Canned Oranges Revenue (USD Million) By Application (2021-2032)
Table 25 Asia Pacific Canned Oranges Revenue (USD Million) By Product (2021-2032)
Table 26 South America Canned Oranges Revenue (USD Million) By Type (2021-2032)
Table 27 South America Canned Oranges Revenue (USD Million) By Application (2021-2032)
Table 28 South America Canned Oranges Revenue (USD Million) By Product (2021-2032)
Table 29 Middle East and Africa Canned Oranges Revenue (USD Million) By Type (2021-2032)
Table 30 Middle East and Africa Canned Oranges Revenue (USD Million) By Application (2021-2032)
Table 31 Middle East and Africa Canned Oranges Revenue (USD Million) By Product (2021-2032)
LIST OF FIGURES
Figure 1. Market Scope
Figure 2. Pricing Forecasts Per Unit, 2023- 2032
Figure 3. Porter’s Five Forces
Figure 4. Global Canned Oranges Market Revenue (USD Million) By Regions (2021-2032)
Figure 5. Global Canned Oranges Market Share (%) By Regions (2023)
Figure 6. North America Canned Oranges Revenue (USD Million) By Country (2021-2032)
Figure 7. United States Canned Oranges Revenue (USD Million) By Country (2021-2032)
Figure 8. Canada Canned Oranges Revenue (USD Million) By Country (2021-2032)
Figure 9. Mexico Canned Oranges Revenue (USD Million) By Country (2021-2032)
Figure 10. Europe Canned Oranges Revenue (USD Million) By Country (2021-2032)
Figure 11. Germany Canned Oranges Revenue (USD Million) By Country (2021-2032)
Figure 12. France Canned Oranges Revenue (USD Million) By Country (2021-2032)
Figure 13. United Kingdom Canned Oranges Revenue (USD Million) By Country (2021-2032)
Figure 14. Spain Canned Oranges Revenue (USD Million) By Country (2021-2032)
Figure 15. Italy Canned Oranges Revenue (USD Million) By Country (2021-2032)
Figure 16. Russia Canned Oranges Revenue (USD Million) By Country (2021-2032)
Figure 17. Rest of Europe Canned Oranges Revenue (USD Million) By Country (2021-2032)
Figure 11. Asia Pacific Canned Oranges Revenue (USD Million) By Country (2021-2032)
Figure 12. China Canned Oranges Revenue (USD Million) By Country (2021-2032)
Figure 13. Japan Canned Oranges Revenue (USD Million) By Country (2021-2032)
Figure 14. India Canned Oranges Revenue (USD Million) By Country (2021-2032)
Figure 15. South Korea Canned Oranges Revenue (USD Million) By Country (2021-2032)
Figure 16. Australia Canned Oranges Revenue (USD Million) By Country (2021-2032)
Figure 17. South East Asia Canned Oranges Revenue (USD Million) By Country (2021-2032)
Figure 18. South America Canned Oranges Revenue (USD Million) By Country (2021-2032)
Figure 19. Brazil Canned Oranges Revenue (USD Million) By Country (2021-2032)
Figure 20. Argentina Canned Oranges Revenue (USD Million) By Country (2021-2032)
Figure 21. Rest of Asia Pacific Canned Oranges Revenue (USD Million) By Country (2021-2032)
Figure 22. Middle East and Africa Canned Oranges Revenue (USD Million) By Region (2021-2032)
Figure 23. Saudi Arabia Canned Oranges Revenue (USD Million) By Region (2021-2032)
Figure 24. The UAE Canned Oranges Revenue (USD Million) By Region (2021-2032)
Figure 25. Rest of Middle East Canned Oranges Revenue (USD Million) By Region (2021-2032)
Figure 26. South Africa Canned Oranges Revenue (USD Million) By Region (2021-2032)
Figure 27. Africa Canned Oranges Revenue (USD Million) By Region (2021-2032)
Figure 28. North America Canned Oranges Revenue (USD Million) By Type (2021-2032)
Figure 29. North America Canned Oranges Revenue (USD Million) By Application (2021-2032)
Figure 30. North America Canned Oranges Revenue (USD Million) By Product (2021-2032)
Figure 31. Europe Canned Oranges Revenue (USD Million) By Type (2021-2032)
Figure 32. Europe Canned Oranges Revenue (USD Million) By Application (2021-2032)
Figure 33. Europe Canned Oranges Revenue (USD Million) By Product (2021-2032)
Figure 34. Asia Pacific Canned Oranges Revenue (USD Million) By Type (2021-2032)
Figure 35. Asia Pacific Canned Oranges Revenue (USD Million) By Application (2021-2032)
Figure 36. Asia Pacific Canned Oranges Revenue (USD Million) By Product (2021-2032)
Figure 37. South America Canned Oranges Revenue (USD Million) By Type (2021-2032)
Figure 38. South America Canned Oranges Revenue (USD Million) By Application (2021-2032)
Figure 39. South America Canned Oranges Revenue (USD Million) By Product (2021-2032)
Figure 40. Middle East and Africa Canned Oranges Revenue (USD Million) By Type (2021-2032)
Figure 41. Middle East and Africa Canned Oranges Revenue (USD Million) By Application (2021-2032)
Figure 42. Middle East and Africa Canned Oranges Revenue (USD Million) By Product (2021-2032)
By Type
Whole
Segment
Others
By Application
Supermarkets/Hypermarkets
Convenience Stores
Independent Retailers
Online Sales
Others
Countries Analyzed
North America (US, Canada, Mexico)
Europe (Germany, UK, France, Spain, Italy, Russia, Rest of Europe)
Asia Pacific (China, India, Japan, South Korea, Australia, South East Asia, Rest of Asia)
South America (Brazil, Argentina, Rest of South America)
Middle East and Africa (Saudi Arabia, UAE, Rest of Middle East, South Africa, Egypt, Rest of Africa)
