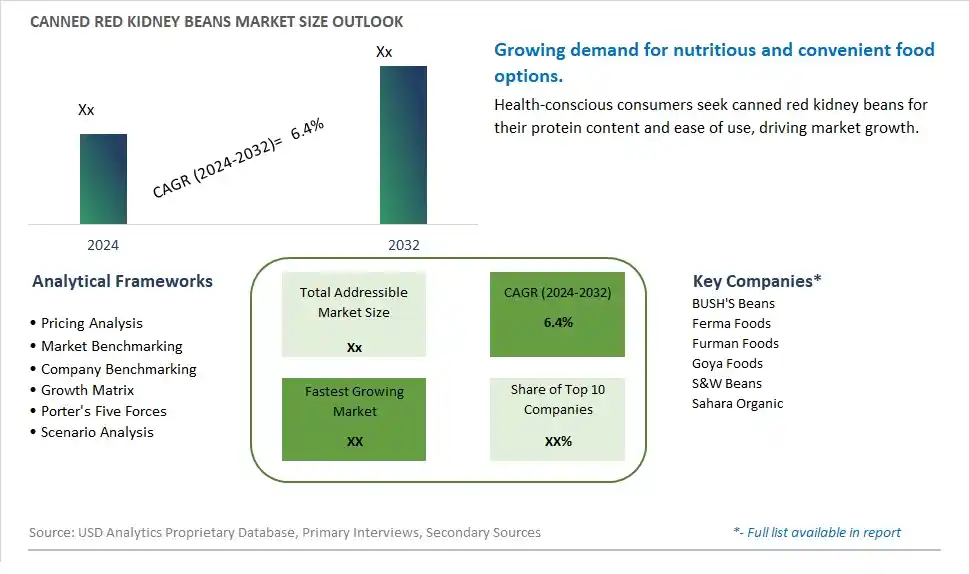
Global Canned Red Kidney Beans Market Size is valued at $XX Million in 2024 and is forecast to register a growth rate (CAGR) of 6.4% to reach $XX Million by 2032.
The global Canned Red Kidney Beans Market Comprehensive Study analyzes and forecasts the market size across 6 regions and 24 countries for diverse segments -By Type (Dry Beans, Wet Beans), By Distribution Channel (Supermarkets/Hypermarkets, Convenience Stores, Online Retail, Others)
An Introduction to Canned Red Kidney Beans Market
The Canned Red Kidney Beans market in 2024 is witnessing robust growth, driven by the increasing demand for nutritious and versatile food options. Canned red kidney beans, known for their rich flavor and high protein and fiber content, are used in a variety of dishes such as soups, stews, and chili. The market is supported by the growing trend towards plant-based diets and the demand for convenient and healthy food options. Advances in canning technology and sustainable farming practices are enhancing the quality and availability of canned red kidney beans. The market is also benefiting from the trend towards clean-label and organic products, appealing to health-conscious consumers seeking high-quality and nutritious plant-based foods.
Canned Red Kidney Beans Competitive Landscape
The market report analyses the leading companies in the industry including BUSH'S Beans, Ferma Foods, Furman Foods, Goya Foods, S&W Beans, Sahara Organic, and Others.
Canned Red Kidney Beans Market Dynamics
Canned Red Kidney Beans Market Trend: Rising Demand for Plant-Based Proteins
One prominent market trend for canned red kidney beans is the rising demand for plant-based proteins. As more consumers adopt vegetarian, vegan, and flexitarian lifestyles, there is a growing preference for plant-based protein sources like red kidney beans. These beans are not only rich in protein but also provide essential nutrients, making them a popular choice for health-conscious individuals seeking meat alternatives.
Canned Red Kidney Beans Market Driver: Convenience and Versatility in Cooking
The market driver for canned red kidney beans is their convenience and versatility in cooking. Canned beans are pre-cooked and ready-to-use, saving consumers time and effort in meal preparation. They can be easily incorporated into a variety of dishes such as chili, soups, salads, and stews, making them a staple ingredient in many cuisines worldwide. The convenience and adaptability of canned red kidney beans drive their demand among consumers looking for quick, nutritious meal options.
Canned Red Kidney Beans Market Opportunity: Promoting Health Benefits and Recipe Innovation
An opportunity within the canned red kidney beans market lies in promoting their health benefits and encouraging recipe innovation. Companies can highlight the nutritional value of red kidney beans, including their high fiber content, low fat, and cholesterol-free nature. By emphasizing these health benefits, manufacturers can target health-conscious consumers and position canned red kidney beans as a wholesome dietary choice. Furthermore, promoting recipe innovation by sharing creative and delicious ways to use red kidney beans in cooking can expand their usage beyond traditional dishes, attracting new consumers and driving market growth.
Canned Red Kidney Beans Market Share Analysis: Wet Red Kidney Beans segment generated the highest revenue share in the industry
The largest segment in the Canned Red Kidney Beans Market is the Wet Beans category, particularly Wet Red Kidney Beans. These beans are processed and canned while still retaining their moisture content, making them convenient for immediate use in various dishes. The popularity of Wet Red Kidney Beans stems from their versatility and ease of preparation. They are commonly used in chili, salads, soups, and as a side dish in many cuisines worldwide. The demand for Wet Red Kidney Beans has seen steady growth due to factors such as changing consumer lifestyles, increasing awareness of plant-based diets, and the convenience of canned foods. Further, the nutritional benefits of red kidney beans, such as being a good source of protein, fiber, and essential nutrients, contribute to their appeal among health-conscious consumers. As a result of these factors, the Wet Red Kidney Beans segment has emerged as the largest and most prominent category within the Canned Red Kidney Beans Market.
Canned Red Kidney Beans Market Share Analysis: Online Retail is the fastest growing segment over the forecast period to 2032
The Online Retail segment within the Canned Red Kidney Beans Market is experiencing rapid growth and is projected to be the fastest-growing segment by 2032. With the increasing adoption of e-commerce platforms and the convenience they offer, consumers are turning to online channels for purchasing canned food items like red kidney beans. Online retail provides a convenient shopping experience, allowing consumers to browse a wide range of products, compare prices, and make purchases from the comfort of their homes. Further, online platforms often offer discounts, promotions, and subscription services that attract consumers and encourage repeat purchases. The growth of online retail in the Canned Red Kidney Beans Market is also fueled by factors such as digitalization, improved logistics and delivery services, and the rising trend of online grocery shopping. As a result, the Online Retail segment is poised to witness substantial growth and capture a significant share of the market by 2032.
Canned Red Kidney Beans Market Segmentation
By Type
Dry Beans
Wet Beans
By Distribution Channel
Supermarkets/Hypermarkets
Convenience Stores
Online Retail
Others
Countries Analyzed
North America (US, Canada, Mexico)
Europe (Germany, UK, France, Spain, Italy, Russia, Rest of Europe)
Asia Pacific (China, India, Japan, South Korea, Australia, South East Asia, Rest of Asia)
South America (Brazil, Argentina, Rest of South America)
Middle East and Africa (Saudi Arabia, UAE, Rest of Middle East, South Africa, Egypt, Rest of Africa)
Canned Red Kidney Beans Companies Profiled in the Study
BUSH'S Beans
Ferma Foods
Furman Foods
Goya Foods
S&W Beans
Sahara Organic
*- List Not Exhaustive
Chapter 1. TABLE OF CONTENTS
Chapter 2. Introduction to Canned Red Kidney Beans Market
2.1. Market Overview
2.2. Key Statistics and Report Highlights
2.3. Scope of the Comprehensive Study
2.3.1. Market Definition
2.3.2 Countries and Regions Covered
2.3.3 Research Objective
2.3.4 Units, Currency, and Conversions
2.3.5 Industry Value Chain
2.4. Key Market Segments
2.5. Key Companies
2.6. Study Period
Chapter 3. Strategic Analysis Review
3.1. Canned Red Kidney Beans Pricing Analysis and Forecast
3.2. Porter’s Five Forces
3.3. Market Ecosystem
3.4. SWOT Analysis
3.5. Regulatory Scenario
3.3. Effects of Inflation, Russia-Ukraine War, moderating economic growth, and other macroeconomic factors
Chapter 4. Competitive Landscape
4.1. Market Share Analysis
4.1.1. Global Canned Red Kidney Beans Market Share by Company, 2023
4.1.2. Product Offerings of Leading Canned Red Kidney Beans Companies
4.2. Market Entropy
4.2.1. New Product Launches in the Industry
4.2.2. Mergers, Acquisitions, Joint ventures, and Partnerships
4.3. Key Strategies and Best Practices
Chapter 5. Global Market Projections: Best, Reference, and Low Case Scenarios
5.1. Growth Analysis- Case Scenario Definitions
5.2. Low Growth Case Scenario Forecasts
5.3. Reference Growth Case Scenario Forecasts
5.4. High Growth Case Scenario Forecasts
Chapter 6. Market Dynamics
6.1. Canned Red Kidney Beans Market Drivers
6.2. Canned Red Kidney Beans Market Challenges
6.6. Canned Red Kidney Beans Market Opportunities
6.4. Canned Red Kidney Beans Market Trends
Chapter 7. Global Canned Red Kidney Beans Market Outlook Trends
7.1. Global Canned Red Kidney Beans Revenue (USD Million) and CAGR (%) by Type (2021-2032)
7.2. Global Canned Red Kidney Beans Revenue (USD Million) and CAGR (%) by Application (2021-2032)
7.3. Global Canned Red Kidney Beans Revenue (USD Million) and CAGR (%) by Product (2021-2032)
By Type
Dry Beans
Wet Beans
By Distribution Channel
Supermarkets/Hypermarkets
Convenience Stores
Online Retail
Others
Chapter 8. Global Canned Red Kidney Beans Regional Analysis and Outlook
8.1. Global Canned Red Kidney Beans Revenue (USD Million) By Regions (2021- 2032)
8.2. North America Canned Red Kidney Beans Revenue (USD Million) by Country (2021-2032)
8.2.1. United States Canned Red Kidney Beans Regional Analysis and Outlook
8.2.2. Canada Canned Red Kidney Beans Regional Analysis and Outlook
8.2.3. Mexico Canned Red Kidney Beans Regional Analysis and Outlook
8.3. Europe Canned Red Kidney Beans Revenue (USD Million), by Country (2021-2032)
8.3.1. Germany Canned Red Kidney Beans Regional Analysis and Outlook
8.3.2. France Canned Red Kidney Beans Regional Analysis and Outlook
8.3.3. United Kingdom Canned Red Kidney Beans Regional Analysis and Outlook
8.3.4. Spain Canned Red Kidney Beans Regional Analysis and Outlook
8.3.5. Italy Canned Red Kidney Beans Regional Analysis and Outlook
8.3.6. Russia Canned Red Kidney Beans Regional Analysis and Outlook
8.3.7. Rest of Europe Canned Red Kidney Beans Regional Analysis and Outlook
8.4. Asia Pacific Canned Red Kidney Beans Revenue (USD Million) by Country (2021-2032)
8.4.1. China Canned Red Kidney Beans Regional Analysis and Outlook
8.4.2. Japan Canned Red Kidney Beans Regional Analysis and Outlook
8.4.3. India Canned Red Kidney Beans Regional Analysis and Outlook
8.4.4. South Korea Canned Red Kidney Beans Regional Analysis and Outlook
8.4.5. Australia Canned Red Kidney Beans Regional Analysis and Outlook
8.4.6. South East Asia Canned Red Kidney Beans Regional Analysis and Outlook
8.4.7. Rest of Asia Pacific Canned Red Kidney Beans Regional Analysis and Outlook
8.5. South America Canned Red Kidney Beans Revenue (USD Million), by Country (2021-2032)
8.5.1. Brazil Canned Red Kidney Beans Regional Analysis and Outlook
8.5.2. Argentina Canned Red Kidney Beans Regional Analysis and Outlook
8.5.3. Rest of South America Canned Red Kidney Beans Regional Analysis and Outlook
8.6. Middle East and Africa Canned Red Kidney Beans Revenue (USD Million) by Country (2021-2032)
8.6.1. Middle East Canned Red Kidney Beans Regional Analysis and Outlook
8.6.2. Africa Canned Red Kidney Beans Regional Analysis and Outlook
Chapter 9. North America Canned Red Kidney Beans Analysis and Outlook
9.1. North America Canned Red Kidney Beans Revenue (USD Million) by Segments (2021-2032)
9.1.1. North America Canned Red Kidney Beans Revenue (USD Million) by Type (2021-2032)
9.1.2. North America Canned Red Kidney Beans Revenue (USD Million) by Application (2021-2032)
9.1.3. North America Canned Red Kidney Beans Revenue (USD Million) by Product (2021-2032)
By Type
Dry Beans
Wet Beans
By Distribution Channel
Supermarkets/Hypermarkets
Convenience Stores
Online Retail
Others
Chapter 10. Europe Canned Red Kidney Beans Analysis and Outlook
10.1. Europe Canned Red Kidney Beans Revenue (USD Million), by Segments (USD Million) (2021-2032)
10.1.1. Europe Canned Red Kidney Beans Revenue (USD Million) by Type (2021-2032)
10.1.2. Europe Canned Red Kidney Beans Revenue (USD Million) by Application (2021-2032)
10.1.3. Europe Canned Red Kidney Beans Revenue (USD Million) by Product (2021-2032)
By Type
Dry Beans
Wet Beans
By Distribution Channel
Supermarkets/Hypermarkets
Convenience Stores
Online Retail
Others
Chapter 11. Asia Pacific Canned Red Kidney Beans Analysis and Outlook
11.1. Asia Pacific Canned Red Kidney Beans Revenue (USD Million), and Revenue (USD Million) by Segments (2021-2032)
11.1.1. Asia Pacific Canned Red Kidney Beans Revenue (USD Million) by Type (2021-2032)
11.1.2. Asia Pacific Canned Red Kidney Beans Revenue (USD Million) by Application (2021-2032)
11.1.3. Asia Pacific Canned Red Kidney Beans Revenue (USD Million) by Product (2021-2032)
By Type
Dry Beans
Wet Beans
By Distribution Channel
Supermarkets/Hypermarkets
Convenience Stores
Online Retail
Others
Chapter 12. South America Canned Red Kidney Beans Analysis and Outlook
12.1. South America Canned Red Kidney Beans Revenue (USD Million), by Segments (2021-2032)
12.1.1. South America Canned Red Kidney Beans Revenue (USD Million) by Type (2021-2032)
12.1.2. South America Canned Red Kidney Beans Revenue (USD Million) by Application (2021-2032)
12.1.3. South America Canned Red Kidney Beans Revenue (USD Million) by Product (2021-2032)
By Type
Dry Beans
Wet Beans
By Distribution Channel
Supermarkets/Hypermarkets
Convenience Stores
Online Retail
Others
Chapter 13. Middle East and Africa Canned Red Kidney Beans Analysis and Outlook
13.1. Middle East and Africa Canned Red Kidney Beans Revenue (USD Million), by Segments (2021-2032)
13.1.1. Middle East and Africa Canned Red Kidney Beans Revenue (USD Million) by Type (2021-2032)
13.1.2. Middle East and Africa Canned Red Kidney Beans Revenue (USD Million) by Application (2021-2032)
13.1.3. Middle East and Africa Canned Red Kidney Beans Revenue (USD Million) by Product (2021-2032)
By Type
Dry Beans
Wet Beans
By Distribution Channel
Supermarkets/Hypermarkets
Convenience Stores
Online Retail
Others
Chapter 14. Canned Red Kidney Beans Company Profiles
14.1 Business Overview
14.2 Product Profiles
14.3 SWOT Profiles
14.5 Recent Developments
14.6 Financial Profile
List of Companies
BUSH'S Beans
Ferma Foods
Furman Foods
Goya Foods
S&W Beans
Sahara Organic
15. Methodology and Data Sources
15.1 Customization Offerings
15.2 Subscription Services
15.3 Related Reports
15.4 Publisher Expertise
LIST OF TABLES
Table 1 Market Segmentation Analysis
Table 2 Global Canned Red Kidney Beans Market Share of Leading Companies, 2023
Table 3 Product Offerings of Leading Companies
Table 4 Low Growth Scenario Forecasts
Table 5 Reference Case Growth Scenario
Table 6 High Growth Case Scenario
Table 7 Global Canned Red Kidney Beans Revenue (USD Million) And CAGR (%) By Type (2021-2032)
Table 8 Global Canned Red Kidney Beans Revenue (USD Million) And CAGR (%) By Application (2021-2032)
Table 9 Global Canned Red Kidney Beans Revenue (USD Million) And CAGR (%) By Product (2021-2032)
Table 10 Global Canned Red Kidney Beans Market Revenue (USD Million) By Regions (2021-2032)
Table 11 Global Canned Red Kidney Beans Market Share (%) By Regions (2021-2032)
Table 12 North America Canned Red Kidney Beans Revenue (USD Million) By Country (2021-2032)
Table 13 Europe Canned Red Kidney Beans Revenue (USD Million) By Country (2021-2032)
Table 14 Asia Pacific Canned Red Kidney Beans Revenue (USD Million) By Country (2021-2032)
Table 15 South America Canned Red Kidney Beans Revenue (USD Million) By Country (2021-2032)
Table 16 Middle East and Africa Canned Red Kidney Beans Revenue (USD Million) By Region (2021-2032)
Table 17 North America Canned Red Kidney Beans Revenue (USD Million) By Type (2021-2032)
Table 18 North America Canned Red Kidney Beans Revenue (USD Million) By Application (2021-2032)
Table 19 North America Canned Red Kidney Beans Revenue (USD Million) By Product (2021-2032)
Table 20 Europe Canned Red Kidney Beans Revenue (USD Million) By Type (2021-2032)
Table 21 Europe Canned Red Kidney Beans Revenue (USD Million) By Application (2021-2032)
Table 22 Europe Canned Red Kidney Beans Revenue (USD Million) By Product (2021-2032)
Table 23 Asia Pacific Canned Red Kidney Beans Revenue (USD Million) By Type (2021-2032)
Table 24 Asia Pacific Canned Red Kidney Beans Revenue (USD Million) By Application (2021-2032)
Table 25 Asia Pacific Canned Red Kidney Beans Revenue (USD Million) By Product (2021-2032)
Table 26 South America Canned Red Kidney Beans Revenue (USD Million) By Type (2021-2032)
Table 27 South America Canned Red Kidney Beans Revenue (USD Million) By Application (2021-2032)
Table 28 South America Canned Red Kidney Beans Revenue (USD Million) By Product (2021-2032)
Table 29 Middle East and Africa Canned Red Kidney Beans Revenue (USD Million) By Type (2021-2032)
Table 30 Middle East and Africa Canned Red Kidney Beans Revenue (USD Million) By Application (2021-2032)
Table 31 Middle East and Africa Canned Red Kidney Beans Revenue (USD Million) By Product (2021-2032)
LIST OF FIGURES
Figure 1. Market Scope
Figure 2. Pricing Forecasts Per Unit, 2023- 2032
Figure 3. Porter’s Five Forces
Figure 4. Global Canned Red Kidney Beans Market Revenue (USD Million) By Regions (2021-2032)
Figure 5. Global Canned Red Kidney Beans Market Share (%) By Regions (2023)
Figure 6. North America Canned Red Kidney Beans Revenue (USD Million) By Country (2021-2032)
Figure 7. United States Canned Red Kidney Beans Revenue (USD Million) By Country (2021-2032)
Figure 8. Canada Canned Red Kidney Beans Revenue (USD Million) By Country (2021-2032)
Figure 9. Mexico Canned Red Kidney Beans Revenue (USD Million) By Country (2021-2032)
Figure 10. Europe Canned Red Kidney Beans Revenue (USD Million) By Country (2021-2032)
Figure 11. Germany Canned Red Kidney Beans Revenue (USD Million) By Country (2021-2032)
Figure 12. France Canned Red Kidney Beans Revenue (USD Million) By Country (2021-2032)
Figure 13. United Kingdom Canned Red Kidney Beans Revenue (USD Million) By Country (2021-2032)
Figure 14. Spain Canned Red Kidney Beans Revenue (USD Million) By Country (2021-2032)
Figure 15. Italy Canned Red Kidney Beans Revenue (USD Million) By Country (2021-2032)
Figure 16. Russia Canned Red Kidney Beans Revenue (USD Million) By Country (2021-2032)
Figure 17. Rest of Europe Canned Red Kidney Beans Revenue (USD Million) By Country (2021-2032)
Figure 11. Asia Pacific Canned Red Kidney Beans Revenue (USD Million) By Country (2021-2032)
Figure 12. China Canned Red Kidney Beans Revenue (USD Million) By Country (2021-2032)
Figure 13. Japan Canned Red Kidney Beans Revenue (USD Million) By Country (2021-2032)
Figure 14. India Canned Red Kidney Beans Revenue (USD Million) By Country (2021-2032)
Figure 15. South Korea Canned Red Kidney Beans Revenue (USD Million) By Country (2021-2032)
Figure 16. Australia Canned Red Kidney Beans Revenue (USD Million) By Country (2021-2032)
Figure 17. South East Asia Canned Red Kidney Beans Revenue (USD Million) By Country (2021-2032)
Figure 18. South America Canned Red Kidney Beans Revenue (USD Million) By Country (2021-2032)
Figure 19. Brazil Canned Red Kidney Beans Revenue (USD Million) By Country (2021-2032)
Figure 20. Argentina Canned Red Kidney Beans Revenue (USD Million) By Country (2021-2032)
Figure 21. Rest of Asia Pacific Canned Red Kidney Beans Revenue (USD Million) By Country (2021-2032)
Figure 22. Middle East and Africa Canned Red Kidney Beans Revenue (USD Million) By Region (2021-2032)
Figure 23. Saudi Arabia Canned Red Kidney Beans Revenue (USD Million) By Region (2021-2032)
Figure 24. The UAE Canned Red Kidney Beans Revenue (USD Million) By Region (2021-2032)
Figure 25. Rest of Middle East Canned Red Kidney Beans Revenue (USD Million) By Region (2021-2032)
Figure 26. South Africa Canned Red Kidney Beans Revenue (USD Million) By Region (2021-2032)
Figure 27. Africa Canned Red Kidney Beans Revenue (USD Million) By Region (2021-2032)
Figure 28. North America Canned Red Kidney Beans Revenue (USD Million) By Type (2021-2032)
Figure 29. North America Canned Red Kidney Beans Revenue (USD Million) By Application (2021-2032)
Figure 30. North America Canned Red Kidney Beans Revenue (USD Million) By Product (2021-2032)
Figure 31. Europe Canned Red Kidney Beans Revenue (USD Million) By Type (2021-2032)
Figure 32. Europe Canned Red Kidney Beans Revenue (USD Million) By Application (2021-2032)
Figure 33. Europe Canned Red Kidney Beans Revenue (USD Million) By Product (2021-2032)
Figure 34. Asia Pacific Canned Red Kidney Beans Revenue (USD Million) By Type (2021-2032)
Figure 35. Asia Pacific Canned Red Kidney Beans Revenue (USD Million) By Application (2021-2032)
Figure 36. Asia Pacific Canned Red Kidney Beans Revenue (USD Million) By Product (2021-2032)
Figure 37. South America Canned Red Kidney Beans Revenue (USD Million) By Type (2021-2032)
Figure 38. South America Canned Red Kidney Beans Revenue (USD Million) By Application (2021-2032)
Figure 39. South America Canned Red Kidney Beans Revenue (USD Million) By Product (2021-2032)
Figure 40. Middle East and Africa Canned Red Kidney Beans Revenue (USD Million) By Type (2021-2032)
Figure 41. Middle East and Africa Canned Red Kidney Beans Revenue (USD Million) By Application (2021-2032)
Figure 42. Middle East and Africa Canned Red Kidney Beans Revenue (USD Million) By Product (2021-2032)
By Type
Dry Beans
Wet Beans
By Distribution Channel
Supermarkets/Hypermarkets
Convenience Stores
Online Retail
Others
Countries Analyzed
North America (US, Canada, Mexico)
Europe (Germany, UK, France, Spain, Italy, Russia, Rest of Europe)
Asia Pacific (China, India, Japan, South Korea, Australia, South East Asia, Rest of Asia)
South America (Brazil, Argentina, Rest of South America)
Middle East and Africa (Saudi Arabia, UAE, Rest of Middle East, South Africa, Egypt, Rest of Africa)
