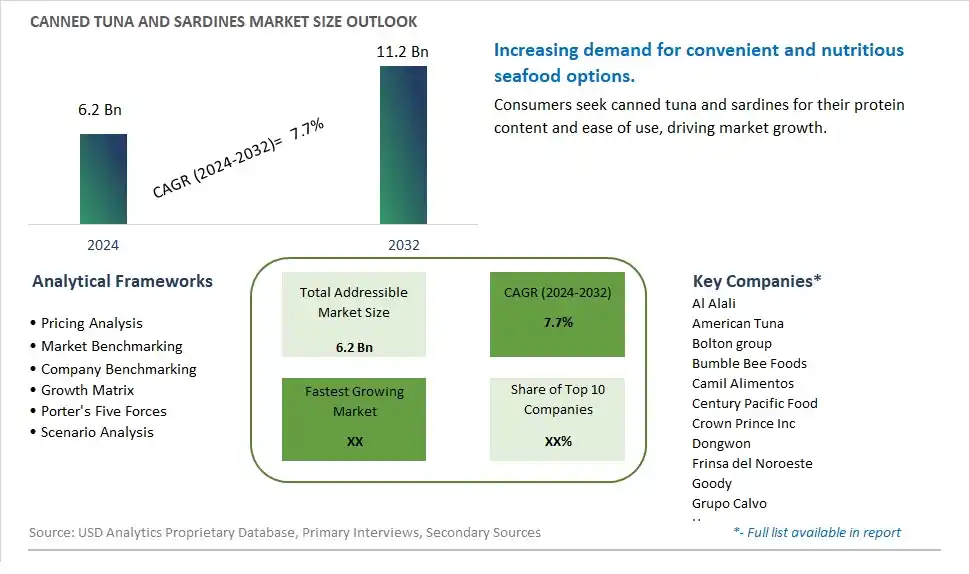
Global Canned Tuna and Sardines Market Size is valued at $6.2 Billion in 2024 and is forecast to register a growth rate (CAGR) of 7.7% to reach $11.2 Billion by 2032.
The global Canned Tuna and Sardines Market Comprehensive Study analyzes and forecasts the market size across 6 regions and 24 countries for diverse segments -By Type (Canned Tuna, Canned Sardines), By Application (Supermarkets/Hypermarkets, Convenience Stores, Online Retailers, Others)
An Introduction to Canned Tuna and Sardines Market
In 2024, the Canned Tuna and Sardines market is witnessing significant growth, driven by the increasing demand for nutritious, convenient, and affordable protein sources. Canned tuna and sardines are popular for their high omega-3 fatty acid content and versatility in various dishes, including salads, sandwiches, and casseroles. The market is supported by the growing awareness of the health benefits of seafood and the trend towards convenient, ready-to-eat foods. Advances in canning technology and sustainable fishing practices are enhancing the quality, flavor, and availability of canned tuna and sardines. The market is also benefiting from the trend towards clean-label and sustainably sourced seafood products.
Canned Tuna and Sardines Competitive Landscape
The market report analyses the leading companies in the industry including Al Alali, American Tuna, Bolton group, Bumble Bee Foods, Camil Alimentos, Century Pacific Food, Crown Prince Inc, Dongwon, Frinsa del Noroeste, Goody, Grupo Calvo, Hagoromo, Natural Sea, Thai Union Group (TUF), Wild Planet, and Others.
Canned Tuna and Sardines Market Dynamics
Canned Tuna and Sardines Market Trend: Growing Demand for Healthy and Convenient Protein Sources
One prominent market trend for canned tuna and sardines is the growing demand for healthy and convenient protein sources. With increasing awareness of the importance of a balanced diet, consumers are seeking nutritious options that are easy to prepare and store. Canned tuna and sardines provide a convenient way to incorporate lean protein, omega-3 fatty acids, and essential nutrients into meals, making them popular choices among health-conscious individuals and busy consumers looking for quick meal solutions.
Canned Tuna and Sardines Market Driver: Shelf-Stable Packaging and Longevity
The market driver for canned tuna and sardines is their shelf-stable packaging and longevity. Canning preserves the freshness and flavor of seafood while extending its shelf life, allowing consumers to stock up on these products and have a reliable protein source available whenever needed. The convenience of long-lasting storage and the assurance of quality contribute to the steady demand for canned tuna and sardines, particularly among households and foodservice establishments looking for versatile ingredients.
Canned Tuna and Sardines Market Opportunity: Diversification of Product Varieties and Flavor Profiles
An opportunity within the canned tuna and sardines market lies in the diversification of product varieties and flavor profiles. Companies can explore introducing new flavors, such as smoked, spicy, or herb-infused options, to cater to diverse taste preferences and culinary trends. Additionally, offering sustainably sourced products, eco-friendly packaging, and convenient single-serve portions can appeal to environmentally conscious consumers and those seeking portion-controlled options. By expanding product ranges and addressing consumer preferences, businesses can capitalize on the growing demand for canned tuna and sardines and enhance market competitiveness.
Canned Tuna and Sardines Market Share Analysis: Canned Tuna segment generated the highest revenue share in the industry
In the Canned Tuna and Sardines Market, the largest segment is Canned Tuna. Tuna holds a dominant position due to several key factors. Firstly, tuna is widely consumed globally, making it a staple in many diets worldwide. Its versatility as an ingredient in various dishes, such as salads, sandwiches, and pasta, contributes to its popularity among consumers. Additionally, canned tuna is known for its long shelf life and convenience, making it a preferred choice for households and foodservice establishments alike. The market for canned tuna continues to grow steadily due to increasing health awareness among consumers, as tuna is rich in omega-3 fatty acids and protein, making it a nutritious option. Further, innovative product developments, such as flavored tuna varieties and sustainable fishing practices, further contribute to the growth of the Canned Tuna segment. As a result, Canned Tuna maintains its position as the largest segment in the Canned Tuna and Sardines Market, showcasing consistent demand and consumer preference.
Canned Tuna and Sardines Market Share Analysis: Online Retailers is the fastest growing segment over the forecast period to 2032
The fastest-growing segment in the Canned Tuna and Sardines Market is Online Retailers. Online retail has witnessed remarkable growth in recent years, driven by factors such as convenience, wider product variety, and increasing digitalization of shopping habits. Consumers are increasingly turning to online platforms to purchase canned tuna and sardines due to the ease of browsing, ordering, and doorstep delivery. This trend is further amplified by the Past few years, which accelerated the shift towards e-commerce as more people opted for contactless shopping experiences. Online retailers offer a diverse range of brands, flavors, and packaging options, catering to different consumer preferences. Additionally, the availability of discounts, promotions, and subscription services on online platforms attracts price-conscious consumers and encourages repeat purchases. As technology continues to evolve and online shopping platforms enhance their user experiences, the Online Retailers segment is expected to sustain its rapid growth trajectory, emerging as a significant contributor to the Canned Tuna and Sardines Market by 2032.
Canned Tuna and Sardines Market Segmentation
By Type
Canned Tuna
Canned Sardines
By Application
Supermarkets/Hypermarkets
Convenience Stores
Online Retailers
Others
Countries Analyzed
North America (US, Canada, Mexico)
Europe (Germany, UK, France, Spain, Italy, Russia, Rest of Europe)
Asia Pacific (China, India, Japan, South Korea, Australia, South East Asia, Rest of Asia)
South America (Brazil, Argentina, Rest of South America)
Middle East and Africa (Saudi Arabia, UAE, Rest of Middle East, South Africa, Egypt, Rest of Africa)
Canned Tuna and Sardines Companies Profiled in the Study
Al Alali
American Tuna
Bolton group
Bumble Bee Foods
Camil Alimentos
Century Pacific Food
Crown Prince Inc
Dongwon
Frinsa del Noroeste
Goody
Grupo Calvo
Hagoromo
Natural Sea
Thai Union Group (TUF)
Wild Planet
*- List Not Exhaustive
Chapter 1. TABLE OF CONTENTS
Chapter 2. Introduction to Canned Tuna and Sardines Market
2.1. Market Overview
2.2. Key Statistics and Report Highlights
2.3. Scope of the Comprehensive Study
2.3.1. Market Definition
2.3.2 Countries and Regions Covered
2.3.3 Research Objective
2.3.4 Units, Currency, and Conversions
2.3.5 Industry Value Chain
2.4. Key Market Segments
2.5. Key Companies
2.6. Study Period
Chapter 3. Strategic Analysis Review
3.1. Canned Tuna and Sardines Pricing Analysis and Forecast
3.2. Porter’s Five Forces
3.3. Market Ecosystem
3.4. SWOT Analysis
3.5. Regulatory Scenario
3.3. Effects of Inflation, Russia-Ukraine War, moderating economic growth, and other macroeconomic factors
Chapter 4. Competitive Landscape
4.1. Market Share Analysis
4.1.1. Global Canned Tuna and Sardines Market Share by Company, 2023
4.1.2. Product Offerings of Leading Canned Tuna and Sardines Companies
4.2. Market Entropy
4.2.1. New Product Launches in the Industry
4.2.2. Mergers, Acquisitions, Joint ventures, and Partnerships
4.3. Key Strategies and Best Practices
Chapter 5. Global Market Projections: Best, Reference, and Low Case Scenarios
5.1. Growth Analysis- Case Scenario Definitions
5.2. Low Growth Case Scenario Forecasts
5.3. Reference Growth Case Scenario Forecasts
5.4. High Growth Case Scenario Forecasts
Chapter 6. Market Dynamics
6.1. Canned Tuna and Sardines Market Drivers
6.2. Canned Tuna and Sardines Market Challenges
6.6. Canned Tuna and Sardines Market Opportunities
6.4. Canned Tuna and Sardines Market Trends
Chapter 7. Global Canned Tuna and Sardines Market Outlook Trends
7.1. Global Canned Tuna and Sardines Revenue (USD Million) and CAGR (%) by Type (2021-2032)
7.2. Global Canned Tuna and Sardines Revenue (USD Million) and CAGR (%) by Application (2021-2032)
7.3. Global Canned Tuna and Sardines Revenue (USD Million) and CAGR (%) by Product (2021-2032)
By Type
Canned Tuna
Canned Sardines
By Application
Supermarkets/Hypermarkets
Convenience Stores
Online Retailers
Others
Chapter 8. Global Canned Tuna and Sardines Regional Analysis and Outlook
8.1. Global Canned Tuna and Sardines Revenue (USD Million) By Regions (2021- 2032)
8.2. North America Canned Tuna and Sardines Revenue (USD Million) by Country (2021-2032)
8.2.1. United States Canned Tuna and Sardines Regional Analysis and Outlook
8.2.2. Canada Canned Tuna and Sardines Regional Analysis and Outlook
8.2.3. Mexico Canned Tuna and Sardines Regional Analysis and Outlook
8.3. Europe Canned Tuna and Sardines Revenue (USD Million), by Country (2021-2032)
8.3.1. Germany Canned Tuna and Sardines Regional Analysis and Outlook
8.3.2. France Canned Tuna and Sardines Regional Analysis and Outlook
8.3.3. United Kingdom Canned Tuna and Sardines Regional Analysis and Outlook
8.3.4. Spain Canned Tuna and Sardines Regional Analysis and Outlook
8.3.5. Italy Canned Tuna and Sardines Regional Analysis and Outlook
8.3.6. Russia Canned Tuna and Sardines Regional Analysis and Outlook
8.3.7. Rest of Europe Canned Tuna and Sardines Regional Analysis and Outlook
8.4. Asia Pacific Canned Tuna and Sardines Revenue (USD Million) by Country (2021-2032)
8.4.1. China Canned Tuna and Sardines Regional Analysis and Outlook
8.4.2. Japan Canned Tuna and Sardines Regional Analysis and Outlook
8.4.3. India Canned Tuna and Sardines Regional Analysis and Outlook
8.4.4. South Korea Canned Tuna and Sardines Regional Analysis and Outlook
8.4.5. Australia Canned Tuna and Sardines Regional Analysis and Outlook
8.4.6. South East Asia Canned Tuna and Sardines Regional Analysis and Outlook
8.4.7. Rest of Asia Pacific Canned Tuna and Sardines Regional Analysis and Outlook
8.5. South America Canned Tuna and Sardines Revenue (USD Million), by Country (2021-2032)
8.5.1. Brazil Canned Tuna and Sardines Regional Analysis and Outlook
8.5.2. Argentina Canned Tuna and Sardines Regional Analysis and Outlook
8.5.3. Rest of South America Canned Tuna and Sardines Regional Analysis and Outlook
8.6. Middle East and Africa Canned Tuna and Sardines Revenue (USD Million) by Country (2021-2032)
8.6.1. Middle East Canned Tuna and Sardines Regional Analysis and Outlook
8.6.2. Africa Canned Tuna and Sardines Regional Analysis and Outlook
Chapter 9. North America Canned Tuna and Sardines Analysis and Outlook
9.1. North America Canned Tuna and Sardines Revenue (USD Million) by Segments (2021-2032)
9.1.1. North America Canned Tuna and Sardines Revenue (USD Million) by Type (2021-2032)
9.1.2. North America Canned Tuna and Sardines Revenue (USD Million) by Application (2021-2032)
9.1.3. North America Canned Tuna and Sardines Revenue (USD Million) by Product (2021-2032)
By Type
Canned Tuna
Canned Sardines
By Application
Supermarkets/Hypermarkets
Convenience Stores
Online Retailers
Others
Chapter 10. Europe Canned Tuna and Sardines Analysis and Outlook
10.1. Europe Canned Tuna and Sardines Revenue (USD Million), by Segments (USD Million) (2021-2032)
10.1.1. Europe Canned Tuna and Sardines Revenue (USD Million) by Type (2021-2032)
10.1.2. Europe Canned Tuna and Sardines Revenue (USD Million) by Application (2021-2032)
10.1.3. Europe Canned Tuna and Sardines Revenue (USD Million) by Product (2021-2032)
By Type
Canned Tuna
Canned Sardines
By Application
Supermarkets/Hypermarkets
Convenience Stores
Online Retailers
Others
Chapter 11. Asia Pacific Canned Tuna and Sardines Analysis and Outlook
11.1. Asia Pacific Canned Tuna and Sardines Revenue (USD Million), and Revenue (USD Million) by Segments (2021-2032)
11.1.1. Asia Pacific Canned Tuna and Sardines Revenue (USD Million) by Type (2021-2032)
11.1.2. Asia Pacific Canned Tuna and Sardines Revenue (USD Million) by Application (2021-2032)
11.1.3. Asia Pacific Canned Tuna and Sardines Revenue (USD Million) by Product (2021-2032)
By Type
Canned Tuna
Canned Sardines
By Application
Supermarkets/Hypermarkets
Convenience Stores
Online Retailers
Others
Chapter 12. South America Canned Tuna and Sardines Analysis and Outlook
12.1. South America Canned Tuna and Sardines Revenue (USD Million), by Segments (2021-2032)
12.1.1. South America Canned Tuna and Sardines Revenue (USD Million) by Type (2021-2032)
12.1.2. South America Canned Tuna and Sardines Revenue (USD Million) by Application (2021-2032)
12.1.3. South America Canned Tuna and Sardines Revenue (USD Million) by Product (2021-2032)
By Type
Canned Tuna
Canned Sardines
By Application
Supermarkets/Hypermarkets
Convenience Stores
Online Retailers
Others
Chapter 13. Middle East and Africa Canned Tuna and Sardines Analysis and Outlook
13.1. Middle East and Africa Canned Tuna and Sardines Revenue (USD Million), by Segments (2021-2032)
13.1.1. Middle East and Africa Canned Tuna and Sardines Revenue (USD Million) by Type (2021-2032)
13.1.2. Middle East and Africa Canned Tuna and Sardines Revenue (USD Million) by Application (2021-2032)
13.1.3. Middle East and Africa Canned Tuna and Sardines Revenue (USD Million) by Product (2021-2032)
By Type
Canned Tuna
Canned Sardines
By Application
Supermarkets/Hypermarkets
Convenience Stores
Online Retailers
Others
Chapter 14. Canned Tuna and Sardines Company Profiles
14.1 Business Overview
14.2 Product Profiles
14.3 SWOT Profiles
14.5 Recent Developments
14.6 Financial Profile
List of Companies
Al Alali
American Tuna
Bolton group
Bumble Bee Foods
Camil Alimentos
Century Pacific Food
Crown Prince Inc
Dongwon
Frinsa del Noroeste
Goody
Grupo Calvo
Hagoromo
Natural Sea
Thai Union Group (TUF)
Wild Planet
15. Methodology and Data Sources
15.1 Customization Offerings
15.2 Subscription Services
15.3 Related Reports
15.4 Publisher Expertise
LIST OF TABLES
Table 1 Market Segmentation Analysis
Table 2 Global Canned Tuna and Sardines Market Share of Leading Companies, 2023
Table 3 Product Offerings of Leading Companies
Table 4 Low Growth Scenario Forecasts
Table 5 Reference Case Growth Scenario
Table 6 High Growth Case Scenario
Table 7 Global Canned Tuna and Sardines Revenue (USD Million) And CAGR (%) By Type (2021-2032)
Table 8 Global Canned Tuna and Sardines Revenue (USD Million) And CAGR (%) By Application (2021-2032)
Table 9 Global Canned Tuna and Sardines Revenue (USD Million) And CAGR (%) By Product (2021-2032)
Table 10 Global Canned Tuna and Sardines Market Revenue (USD Million) By Regions (2021-2032)
Table 11 Global Canned Tuna and Sardines Market Share (%) By Regions (2021-2032)
Table 12 North America Canned Tuna and Sardines Revenue (USD Million) By Country (2021-2032)
Table 13 Europe Canned Tuna and Sardines Revenue (USD Million) By Country (2021-2032)
Table 14 Asia Pacific Canned Tuna and Sardines Revenue (USD Million) By Country (2021-2032)
Table 15 South America Canned Tuna and Sardines Revenue (USD Million) By Country (2021-2032)
Table 16 Middle East and Africa Canned Tuna and Sardines Revenue (USD Million) By Region (2021-2032)
Table 17 North America Canned Tuna and Sardines Revenue (USD Million) By Type (2021-2032)
Table 18 North America Canned Tuna and Sardines Revenue (USD Million) By Application (2021-2032)
Table 19 North America Canned Tuna and Sardines Revenue (USD Million) By Product (2021-2032)
Table 20 Europe Canned Tuna and Sardines Revenue (USD Million) By Type (2021-2032)
Table 21 Europe Canned Tuna and Sardines Revenue (USD Million) By Application (2021-2032)
Table 22 Europe Canned Tuna and Sardines Revenue (USD Million) By Product (2021-2032)
Table 23 Asia Pacific Canned Tuna and Sardines Revenue (USD Million) By Type (2021-2032)
Table 24 Asia Pacific Canned Tuna and Sardines Revenue (USD Million) By Application (2021-2032)
Table 25 Asia Pacific Canned Tuna and Sardines Revenue (USD Million) By Product (2021-2032)
Table 26 South America Canned Tuna and Sardines Revenue (USD Million) By Type (2021-2032)
Table 27 South America Canned Tuna and Sardines Revenue (USD Million) By Application (2021-2032)
Table 28 South America Canned Tuna and Sardines Revenue (USD Million) By Product (2021-2032)
Table 29 Middle East and Africa Canned Tuna and Sardines Revenue (USD Million) By Type (2021-2032)
Table 30 Middle East and Africa Canned Tuna and Sardines Revenue (USD Million) By Application (2021-2032)
Table 31 Middle East and Africa Canned Tuna and Sardines Revenue (USD Million) By Product (2021-2032)
LIST OF FIGURES
Figure 1. Market Scope
Figure 2. Pricing Forecasts Per Unit, 2023- 2032
Figure 3. Porter’s Five Forces
Figure 4. Global Canned Tuna and Sardines Market Revenue (USD Million) By Regions (2021-2032)
Figure 5. Global Canned Tuna and Sardines Market Share (%) By Regions (2023)
Figure 6. North America Canned Tuna and Sardines Revenue (USD Million) By Country (2021-2032)
Figure 7. United States Canned Tuna and Sardines Revenue (USD Million) By Country (2021-2032)
Figure 8. Canada Canned Tuna and Sardines Revenue (USD Million) By Country (2021-2032)
Figure 9. Mexico Canned Tuna and Sardines Revenue (USD Million) By Country (2021-2032)
Figure 10. Europe Canned Tuna and Sardines Revenue (USD Million) By Country (2021-2032)
Figure 11. Germany Canned Tuna and Sardines Revenue (USD Million) By Country (2021-2032)
Figure 12. France Canned Tuna and Sardines Revenue (USD Million) By Country (2021-2032)
Figure 13. United Kingdom Canned Tuna and Sardines Revenue (USD Million) By Country (2021-2032)
Figure 14. Spain Canned Tuna and Sardines Revenue (USD Million) By Country (2021-2032)
Figure 15. Italy Canned Tuna and Sardines Revenue (USD Million) By Country (2021-2032)
Figure 16. Russia Canned Tuna and Sardines Revenue (USD Million) By Country (2021-2032)
Figure 17. Rest of Europe Canned Tuna and Sardines Revenue (USD Million) By Country (2021-2032)
Figure 11. Asia Pacific Canned Tuna and Sardines Revenue (USD Million) By Country (2021-2032)
Figure 12. China Canned Tuna and Sardines Revenue (USD Million) By Country (2021-2032)
Figure 13. Japan Canned Tuna and Sardines Revenue (USD Million) By Country (2021-2032)
Figure 14. India Canned Tuna and Sardines Revenue (USD Million) By Country (2021-2032)
Figure 15. South Korea Canned Tuna and Sardines Revenue (USD Million) By Country (2021-2032)
Figure 16. Australia Canned Tuna and Sardines Revenue (USD Million) By Country (2021-2032)
Figure 17. South East Asia Canned Tuna and Sardines Revenue (USD Million) By Country (2021-2032)
Figure 18. South America Canned Tuna and Sardines Revenue (USD Million) By Country (2021-2032)
Figure 19. Brazil Canned Tuna and Sardines Revenue (USD Million) By Country (2021-2032)
Figure 20. Argentina Canned Tuna and Sardines Revenue (USD Million) By Country (2021-2032)
Figure 21. Rest of Asia Pacific Canned Tuna and Sardines Revenue (USD Million) By Country (2021-2032)
Figure 22. Middle East and Africa Canned Tuna and Sardines Revenue (USD Million) By Region (2021-2032)
Figure 23. Saudi Arabia Canned Tuna and Sardines Revenue (USD Million) By Region (2021-2032)
Figure 24. The UAE Canned Tuna and Sardines Revenue (USD Million) By Region (2021-2032)
Figure 25. Rest of Middle East Canned Tuna and Sardines Revenue (USD Million) By Region (2021-2032)
Figure 26. South Africa Canned Tuna and Sardines Revenue (USD Million) By Region (2021-2032)
Figure 27. Africa Canned Tuna and Sardines Revenue (USD Million) By Region (2021-2032)
Figure 28. North America Canned Tuna and Sardines Revenue (USD Million) By Type (2021-2032)
Figure 29. North America Canned Tuna and Sardines Revenue (USD Million) By Application (2021-2032)
Figure 30. North America Canned Tuna and Sardines Revenue (USD Million) By Product (2021-2032)
Figure 31. Europe Canned Tuna and Sardines Revenue (USD Million) By Type (2021-2032)
Figure 32. Europe Canned Tuna and Sardines Revenue (USD Million) By Application (2021-2032)
Figure 33. Europe Canned Tuna and Sardines Revenue (USD Million) By Product (2021-2032)
Figure 34. Asia Pacific Canned Tuna and Sardines Revenue (USD Million) By Type (2021-2032)
Figure 35. Asia Pacific Canned Tuna and Sardines Revenue (USD Million) By Application (2021-2032)
Figure 36. Asia Pacific Canned Tuna and Sardines Revenue (USD Million) By Product (2021-2032)
Figure 37. South America Canned Tuna and Sardines Revenue (USD Million) By Type (2021-2032)
Figure 38. South America Canned Tuna and Sardines Revenue (USD Million) By Application (2021-2032)
Figure 39. South America Canned Tuna and Sardines Revenue (USD Million) By Product (2021-2032)
Figure 40. Middle East and Africa Canned Tuna and Sardines Revenue (USD Million) By Type (2021-2032)
Figure 41. Middle East and Africa Canned Tuna and Sardines Revenue (USD Million) By Application (2021-2032)
Figure 42. Middle East and Africa Canned Tuna and Sardines Revenue (USD Million) By Product (2021-2032)
By Type
Canned Tuna
Canned Sardines
By Application
Supermarkets/Hypermarkets
Convenience Stores
Online Retailers
Others
Countries Analyzed
North America (US, Canada, Mexico)
Europe (Germany, UK, France, Spain, Italy, Russia, Rest of Europe)
Asia Pacific (China, India, Japan, South Korea, Australia, South East Asia, Rest of Asia)
South America (Brazil, Argentina, Rest of South America)
Middle East and Africa (Saudi Arabia, UAE, Rest of Middle East, South Africa, Egypt, Rest of Africa)
