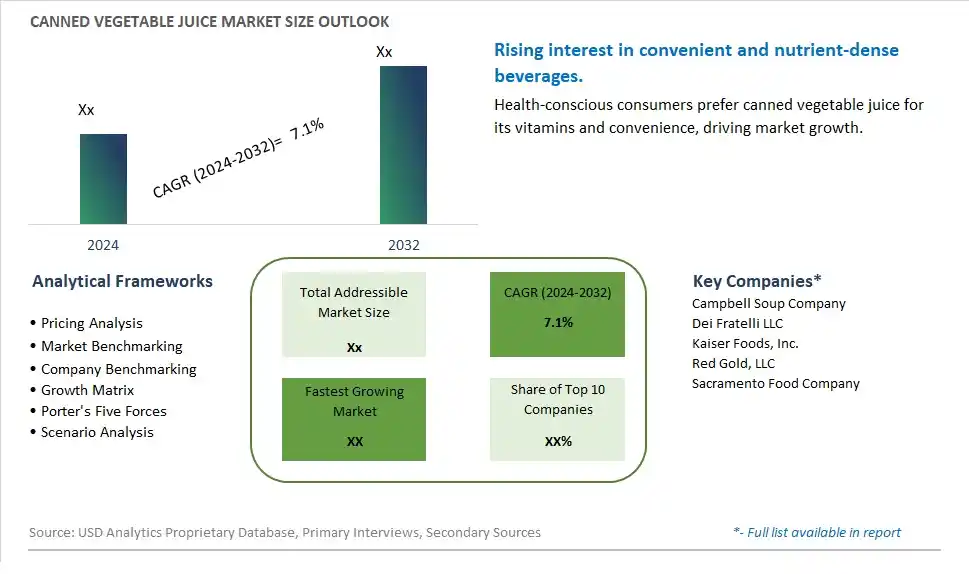
Global Canned Vegetable Juice Market Size is valued at $XX Million in 2024 and is forecast to register a growth rate (CAGR) of 7.1% to reach $XX Million by 2032.
The global Canned Vegetable Juice Market Comprehensive Study analyzes and forecasts the market size across 6 regions and 24 countries for diverse segments -By Type (Raw Vegetable Juice, Added Mineral Juice, Added Vitamin Juice), By Application (Food, Beverage, Bakery, Others)
An Introduction to Canned Vegetable Juice Market
The Canned Vegetable Juice market in 2024 is expanding rapidly, driven by the increasing demand for convenient and nutritious beverage options. Canned vegetable juice, made from a blend of vegetables such as tomatoes, carrots, beets, and spinach, is valued for its health benefits, including high vitamin and mineral content. The market is supported by the growing trend towards functional beverages that support overall health and wellness. Advances in canning technology and flavor formulation are enhancing the quality, taste, and nutritional content of canned vegetable juices. The market is also benefiting from the trend towards clean-label and organic products, appealing to health-conscious consumers seeking nutritious and convenient drinks.
Canned Vegetable Juice Competitive Landscape
The market report analyses the leading companies in the industry including Campbell Soup Company, Dei Fratelli LLC, Kaiser Foods, Inc., Red Gold, LLC, Sacramento Food Company, and Others.
Canned Vegetable Juice Market Dynamics
Canned Vegetable Juice Market Trend: Rising Demand for Healthy and Functional Beverages
One prominent market trend for canned vegetable juice is the rising demand for healthy and functional beverages. Consumers are increasingly prioritizing health and wellness, leading to a growing interest in nutrient-rich drinks like vegetable juices. Canned vegetable juices offer convenience and nutritional benefits, making them popular choices for health-conscious individuals looking for quick and easy ways to consume essential vitamins, minerals, and antioxidants.
Canned Vegetable Juice Market Driver: Convenience and Long Shelf Life
The market driver for canned vegetable juice is the convenience factor combined with long shelf life. Canning technology preserves the freshness and nutrients of vegetables while ensuring a longer shelf life compared to fresh juices. This makes canned vegetable juice a convenient option for consumers who want access to nutritious beverages without the need for refrigeration or frequent shopping trips. The extended shelf life also benefits retailers and distributors by reducing product waste and logistical challenges.
Canned Vegetable Juice Market Opportunity: Innovation in Flavors and Functional Ingredients
An opportunity within the canned vegetable juice market lies in innovation in flavors and functional ingredients. Companies can explore introducing new flavor combinations, such as exotic fruits or herbs, to appeal to diverse consumer tastes. Additionally, incorporating functional ingredients like probiotics, superfoods, or plant-based proteins can enhance the nutritional profile and functional benefits of canned vegetable juices. By focusing on product innovation and meeting evolving consumer preferences for flavor variety and health benefits, businesses can capitalize on the growing demand for canned vegetable juices and differentiate themselves in the market.
Canned Vegetable Juice Market Share Analysis: Raw Vegetable Juice segment generated the highest revenue share in the industry
The largest segment in the Canned Vegetable Juice Market is Raw Vegetable Juice. This segment comprises juices that are extracted directly from fresh vegetables without any added minerals or vitamins. Raw vegetable juices are highly sought after by health-conscious consumers due to their natural and unprocessed nature, retaining maximum nutrients and flavors from the vegetables. They are rich in vitamins, minerals, antioxidants, and phytonutrients, offering numerous health benefits such as improved digestion, detoxification, immune support, and overall well-being. The growing awareness of the importance of a healthy diet and lifestyle has driven the demand for raw vegetable juices as a convenient and nutritious beverage option. Additionally, the trend towards plant-based diets and the preference for natural and organic products further contribute to the popularity of raw vegetable juices. As consumers prioritize health and wellness, the Raw Vegetable Juice segment is expected to continue dominating the Canned Vegetable Juice Market, experiencing steady growth in the coming years.
Canned Vegetable Juice Market Share Analysis: Beverage Application is the fastest growing segment over the forecast period to 2032
The fastest-growing segment in the Canned Vegetable Juice Market is the Beverage Application. This segment includes canned vegetable juices that are primarily intended for consumption as beverages. With an increasing focus on health and wellness, consumers are gravitating towards natural and nutritious beverage options, such as vegetable juices, as part of their daily diet. Canned vegetable juices in the beverage application offer convenience, portability, and longer shelf life compared to freshly squeezed juices, making them popular choices for on-the-go consumption. Further, the rising awareness about the benefits of consuming vegetables in liquid form, such as easier digestion and nutrient absorption, has further fueled the demand for canned vegetable juices as beverages. As a result, the Beverage Application segment is experiencing rapid growth and is expected to continue expanding significantly until 2032, driven by health-conscious consumers seeking convenient and healthy drink alternatives.
Canned Vegetable Juice Market Segmentation
By Type
Raw Vegetable Juice
Added Mineral Juice
Added Vitamin Juice
By Application
Food
Beverage
Bakery
Others
Countries Analyzed
North America (US, Canada, Mexico)
Europe (Germany, UK, France, Spain, Italy, Russia, Rest of Europe)
Asia Pacific (China, India, Japan, South Korea, Australia, South East Asia, Rest of Asia)
South America (Brazil, Argentina, Rest of South America)
Middle East and Africa (Saudi Arabia, UAE, Rest of Middle East, South Africa, Egypt, Rest of Africa)
Canned Vegetable Juice Companies Profiled in the Study
Campbell Soup Company
Dei Fratelli LLC
Kaiser Foods, Inc.
Red Gold, LLC
Sacramento Food Company
*- List Not Exhaustive
Chapter 1. TABLE OF CONTENTS
Chapter 2. Introduction to Canned Vegetable Juice Market
2.1. Market Overview
2.2. Key Statistics and Report Highlights
2.3. Scope of the Comprehensive Study
2.3.1. Market Definition
2.3.2 Countries and Regions Covered
2.3.3 Research Objective
2.3.4 Units, Currency, and Conversions
2.3.5 Industry Value Chain
2.4. Key Market Segments
2.5. Key Companies
2.6. Study Period
Chapter 3. Strategic Analysis Review
3.1. Canned Vegetable Juice Pricing Analysis and Forecast
3.2. Porter’s Five Forces
3.3. Market Ecosystem
3.4. SWOT Analysis
3.5. Regulatory Scenario
3.3. Effects of Inflation, Russia-Ukraine War, moderating economic growth, and other macroeconomic factors
Chapter 4. Competitive Landscape
4.1. Market Share Analysis
4.1.1. Global Canned Vegetable Juice Market Share by Company, 2023
4.1.2. Product Offerings of Leading Canned Vegetable Juice Companies
4.2. Market Entropy
4.2.1. New Product Launches in the Industry
4.2.2. Mergers, Acquisitions, Joint ventures, and Partnerships
4.3. Key Strategies and Best Practices
Chapter 5. Global Market Projections: Best, Reference, and Low Case Scenarios
5.1. Growth Analysis- Case Scenario Definitions
5.2. Low Growth Case Scenario Forecasts
5.3. Reference Growth Case Scenario Forecasts
5.4. High Growth Case Scenario Forecasts
Chapter 6. Market Dynamics
6.1. Canned Vegetable Juice Market Drivers
6.2. Canned Vegetable Juice Market Challenges
6.6. Canned Vegetable Juice Market Opportunities
6.4. Canned Vegetable Juice Market Trends
Chapter 7. Global Canned Vegetable Juice Market Outlook Trends
7.1. Global Canned Vegetable Juice Revenue (USD Million) and CAGR (%) by Type (2021-2032)
7.2. Global Canned Vegetable Juice Revenue (USD Million) and CAGR (%) by Application (2021-2032)
7.3. Global Canned Vegetable Juice Revenue (USD Million) and CAGR (%) by Product (2021-2032)
By Type
Raw Vegetable Juice
Added Mineral Juice
Added Vitamin Juice
By Application
Food
Beverage
Bakery
Others
Chapter 8. Global Canned Vegetable Juice Regional Analysis and Outlook
8.1. Global Canned Vegetable Juice Revenue (USD Million) By Regions (2021- 2032)
8.2. North America Canned Vegetable Juice Revenue (USD Million) by Country (2021-2032)
8.2.1. United States Canned Vegetable Juice Regional Analysis and Outlook
8.2.2. Canada Canned Vegetable Juice Regional Analysis and Outlook
8.2.3. Mexico Canned Vegetable Juice Regional Analysis and Outlook
8.3. Europe Canned Vegetable Juice Revenue (USD Million), by Country (2021-2032)
8.3.1. Germany Canned Vegetable Juice Regional Analysis and Outlook
8.3.2. France Canned Vegetable Juice Regional Analysis and Outlook
8.3.3. United Kingdom Canned Vegetable Juice Regional Analysis and Outlook
8.3.4. Spain Canned Vegetable Juice Regional Analysis and Outlook
8.3.5. Italy Canned Vegetable Juice Regional Analysis and Outlook
8.3.6. Russia Canned Vegetable Juice Regional Analysis and Outlook
8.3.7. Rest of Europe Canned Vegetable Juice Regional Analysis and Outlook
8.4. Asia Pacific Canned Vegetable Juice Revenue (USD Million) by Country (2021-2032)
8.4.1. China Canned Vegetable Juice Regional Analysis and Outlook
8.4.2. Japan Canned Vegetable Juice Regional Analysis and Outlook
8.4.3. India Canned Vegetable Juice Regional Analysis and Outlook
8.4.4. South Korea Canned Vegetable Juice Regional Analysis and Outlook
8.4.5. Australia Canned Vegetable Juice Regional Analysis and Outlook
8.4.6. South East Asia Canned Vegetable Juice Regional Analysis and Outlook
8.4.7. Rest of Asia Pacific Canned Vegetable Juice Regional Analysis and Outlook
8.5. South America Canned Vegetable Juice Revenue (USD Million), by Country (2021-2032)
8.5.1. Brazil Canned Vegetable Juice Regional Analysis and Outlook
8.5.2. Argentina Canned Vegetable Juice Regional Analysis and Outlook
8.5.3. Rest of South America Canned Vegetable Juice Regional Analysis and Outlook
8.6. Middle East and Africa Canned Vegetable Juice Revenue (USD Million) by Country (2021-2032)
8.6.1. Middle East Canned Vegetable Juice Regional Analysis and Outlook
8.6.2. Africa Canned Vegetable Juice Regional Analysis and Outlook
Chapter 9. North America Canned Vegetable Juice Analysis and Outlook
9.1. North America Canned Vegetable Juice Revenue (USD Million) by Segments (2021-2032)
9.1.1. North America Canned Vegetable Juice Revenue (USD Million) by Type (2021-2032)
9.1.2. North America Canned Vegetable Juice Revenue (USD Million) by Application (2021-2032)
9.1.3. North America Canned Vegetable Juice Revenue (USD Million) by Product (2021-2032)
By Type
Raw Vegetable Juice
Added Mineral Juice
Added Vitamin Juice
By Application
Food
Beverage
Bakery
Others
Chapter 10. Europe Canned Vegetable Juice Analysis and Outlook
10.1. Europe Canned Vegetable Juice Revenue (USD Million), by Segments (USD Million) (2021-2032)
10.1.1. Europe Canned Vegetable Juice Revenue (USD Million) by Type (2021-2032)
10.1.2. Europe Canned Vegetable Juice Revenue (USD Million) by Application (2021-2032)
10.1.3. Europe Canned Vegetable Juice Revenue (USD Million) by Product (2021-2032)
By Type
Raw Vegetable Juice
Added Mineral Juice
Added Vitamin Juice
By Application
Food
Beverage
Bakery
Others
Chapter 11. Asia Pacific Canned Vegetable Juice Analysis and Outlook
11.1. Asia Pacific Canned Vegetable Juice Revenue (USD Million), and Revenue (USD Million) by Segments (2021-2032)
11.1.1. Asia Pacific Canned Vegetable Juice Revenue (USD Million) by Type (2021-2032)
11.1.2. Asia Pacific Canned Vegetable Juice Revenue (USD Million) by Application (2021-2032)
11.1.3. Asia Pacific Canned Vegetable Juice Revenue (USD Million) by Product (2021-2032)
By Type
Raw Vegetable Juice
Added Mineral Juice
Added Vitamin Juice
By Application
Food
Beverage
Bakery
Others
Chapter 12. South America Canned Vegetable Juice Analysis and Outlook
12.1. South America Canned Vegetable Juice Revenue (USD Million), by Segments (2021-2032)
12.1.1. South America Canned Vegetable Juice Revenue (USD Million) by Type (2021-2032)
12.1.2. South America Canned Vegetable Juice Revenue (USD Million) by Application (2021-2032)
12.1.3. South America Canned Vegetable Juice Revenue (USD Million) by Product (2021-2032)
By Type
Raw Vegetable Juice
Added Mineral Juice
Added Vitamin Juice
By Application
Food
Beverage
Bakery
Others
Chapter 13. Middle East and Africa Canned Vegetable Juice Analysis and Outlook
13.1. Middle East and Africa Canned Vegetable Juice Revenue (USD Million), by Segments (2021-2032)
13.1.1. Middle East and Africa Canned Vegetable Juice Revenue (USD Million) by Type (2021-2032)
13.1.2. Middle East and Africa Canned Vegetable Juice Revenue (USD Million) by Application (2021-2032)
13.1.3. Middle East and Africa Canned Vegetable Juice Revenue (USD Million) by Product (2021-2032)
By Type
Raw Vegetable Juice
Added Mineral Juice
Added Vitamin Juice
By Application
Food
Beverage
Bakery
Others
Chapter 14. Canned Vegetable Juice Company Profiles
14.1 Business Overview
14.2 Product Profiles
14.3 SWOT Profiles
14.5 Recent Developments
14.6 Financial Profile
List of Companies
Campbell Soup Company
Dei Fratelli LLC
Kaiser Foods, Inc.
Red Gold, LLC
Sacramento Food Company
15. Methodology and Data Sources
15.1 Customization Offerings
15.2 Subscription Services
15.3 Related Reports
15.4 Publisher Expertise
LIST OF TABLES
Table 1 Market Segmentation Analysis
Table 2 Global Canned Vegetable Juice Market Share of Leading Companies, 2023
Table 3 Product Offerings of Leading Companies
Table 4 Low Growth Scenario Forecasts
Table 5 Reference Case Growth Scenario
Table 6 High Growth Case Scenario
Table 7 Global Canned Vegetable Juice Revenue (USD Million) And CAGR (%) By Type (2021-2032)
Table 8 Global Canned Vegetable Juice Revenue (USD Million) And CAGR (%) By Application (2021-2032)
Table 9 Global Canned Vegetable Juice Revenue (USD Million) And CAGR (%) By Product (2021-2032)
Table 10 Global Canned Vegetable Juice Market Revenue (USD Million) By Regions (2021-2032)
Table 11 Global Canned Vegetable Juice Market Share (%) By Regions (2021-2032)
Table 12 North America Canned Vegetable Juice Revenue (USD Million) By Country (2021-2032)
Table 13 Europe Canned Vegetable Juice Revenue (USD Million) By Country (2021-2032)
Table 14 Asia Pacific Canned Vegetable Juice Revenue (USD Million) By Country (2021-2032)
Table 15 South America Canned Vegetable Juice Revenue (USD Million) By Country (2021-2032)
Table 16 Middle East and Africa Canned Vegetable Juice Revenue (USD Million) By Region (2021-2032)
Table 17 North America Canned Vegetable Juice Revenue (USD Million) By Type (2021-2032)
Table 18 North America Canned Vegetable Juice Revenue (USD Million) By Application (2021-2032)
Table 19 North America Canned Vegetable Juice Revenue (USD Million) By Product (2021-2032)
Table 20 Europe Canned Vegetable Juice Revenue (USD Million) By Type (2021-2032)
Table 21 Europe Canned Vegetable Juice Revenue (USD Million) By Application (2021-2032)
Table 22 Europe Canned Vegetable Juice Revenue (USD Million) By Product (2021-2032)
Table 23 Asia Pacific Canned Vegetable Juice Revenue (USD Million) By Type (2021-2032)
Table 24 Asia Pacific Canned Vegetable Juice Revenue (USD Million) By Application (2021-2032)
Table 25 Asia Pacific Canned Vegetable Juice Revenue (USD Million) By Product (2021-2032)
Table 26 South America Canned Vegetable Juice Revenue (USD Million) By Type (2021-2032)
Table 27 South America Canned Vegetable Juice Revenue (USD Million) By Application (2021-2032)
Table 28 South America Canned Vegetable Juice Revenue (USD Million) By Product (2021-2032)
Table 29 Middle East and Africa Canned Vegetable Juice Revenue (USD Million) By Type (2021-2032)
Table 30 Middle East and Africa Canned Vegetable Juice Revenue (USD Million) By Application (2021-2032)
Table 31 Middle East and Africa Canned Vegetable Juice Revenue (USD Million) By Product (2021-2032)
LIST OF FIGURES
Figure 1. Market Scope
Figure 2. Pricing Forecasts Per Unit, 2023- 2032
Figure 3. Porter’s Five Forces
Figure 4. Global Canned Vegetable Juice Market Revenue (USD Million) By Regions (2021-2032)
Figure 5. Global Canned Vegetable Juice Market Share (%) By Regions (2023)
Figure 6. North America Canned Vegetable Juice Revenue (USD Million) By Country (2021-2032)
Figure 7. United States Canned Vegetable Juice Revenue (USD Million) By Country (2021-2032)
Figure 8. Canada Canned Vegetable Juice Revenue (USD Million) By Country (2021-2032)
Figure 9. Mexico Canned Vegetable Juice Revenue (USD Million) By Country (2021-2032)
Figure 10. Europe Canned Vegetable Juice Revenue (USD Million) By Country (2021-2032)
Figure 11. Germany Canned Vegetable Juice Revenue (USD Million) By Country (2021-2032)
Figure 12. France Canned Vegetable Juice Revenue (USD Million) By Country (2021-2032)
Figure 13. United Kingdom Canned Vegetable Juice Revenue (USD Million) By Country (2021-2032)
Figure 14. Spain Canned Vegetable Juice Revenue (USD Million) By Country (2021-2032)
Figure 15. Italy Canned Vegetable Juice Revenue (USD Million) By Country (2021-2032)
Figure 16. Russia Canned Vegetable Juice Revenue (USD Million) By Country (2021-2032)
Figure 17. Rest of Europe Canned Vegetable Juice Revenue (USD Million) By Country (2021-2032)
Figure 11. Asia Pacific Canned Vegetable Juice Revenue (USD Million) By Country (2021-2032)
Figure 12. China Canned Vegetable Juice Revenue (USD Million) By Country (2021-2032)
Figure 13. Japan Canned Vegetable Juice Revenue (USD Million) By Country (2021-2032)
Figure 14. India Canned Vegetable Juice Revenue (USD Million) By Country (2021-2032)
Figure 15. South Korea Canned Vegetable Juice Revenue (USD Million) By Country (2021-2032)
Figure 16. Australia Canned Vegetable Juice Revenue (USD Million) By Country (2021-2032)
Figure 17. South East Asia Canned Vegetable Juice Revenue (USD Million) By Country (2021-2032)
Figure 18. South America Canned Vegetable Juice Revenue (USD Million) By Country (2021-2032)
Figure 19. Brazil Canned Vegetable Juice Revenue (USD Million) By Country (2021-2032)
Figure 20. Argentina Canned Vegetable Juice Revenue (USD Million) By Country (2021-2032)
Figure 21. Rest of Asia Pacific Canned Vegetable Juice Revenue (USD Million) By Country (2021-2032)
Figure 22. Middle East and Africa Canned Vegetable Juice Revenue (USD Million) By Region (2021-2032)
Figure 23. Saudi Arabia Canned Vegetable Juice Revenue (USD Million) By Region (2021-2032)
Figure 24. The UAE Canned Vegetable Juice Revenue (USD Million) By Region (2021-2032)
Figure 25. Rest of Middle East Canned Vegetable Juice Revenue (USD Million) By Region (2021-2032)
Figure 26. South Africa Canned Vegetable Juice Revenue (USD Million) By Region (2021-2032)
Figure 27. Africa Canned Vegetable Juice Revenue (USD Million) By Region (2021-2032)
Figure 28. North America Canned Vegetable Juice Revenue (USD Million) By Type (2021-2032)
Figure 29. North America Canned Vegetable Juice Revenue (USD Million) By Application (2021-2032)
Figure 30. North America Canned Vegetable Juice Revenue (USD Million) By Product (2021-2032)
Figure 31. Europe Canned Vegetable Juice Revenue (USD Million) By Type (2021-2032)
Figure 32. Europe Canned Vegetable Juice Revenue (USD Million) By Application (2021-2032)
Figure 33. Europe Canned Vegetable Juice Revenue (USD Million) By Product (2021-2032)
Figure 34. Asia Pacific Canned Vegetable Juice Revenue (USD Million) By Type (2021-2032)
Figure 35. Asia Pacific Canned Vegetable Juice Revenue (USD Million) By Application (2021-2032)
Figure 36. Asia Pacific Canned Vegetable Juice Revenue (USD Million) By Product (2021-2032)
Figure 37. South America Canned Vegetable Juice Revenue (USD Million) By Type (2021-2032)
Figure 38. South America Canned Vegetable Juice Revenue (USD Million) By Application (2021-2032)
Figure 39. South America Canned Vegetable Juice Revenue (USD Million) By Product (2021-2032)
Figure 40. Middle East and Africa Canned Vegetable Juice Revenue (USD Million) By Type (2021-2032)
Figure 41. Middle East and Africa Canned Vegetable Juice Revenue (USD Million) By Application (2021-2032)
Figure 42. Middle East and Africa Canned Vegetable Juice Revenue (USD Million) By Product (2021-2032)
By Type
Raw Vegetable Juice
Added Mineral Juice
Added Vitamin Juice
By Application
Food
Beverage
Bakery
Others
Countries Analyzed
North America (US, Canada, Mexico)
Europe (Germany, UK, France, Spain, Italy, Russia, Rest of Europe)
Asia Pacific (China, India, Japan, South Korea, Australia, South East Asia, Rest of Asia)
South America (Brazil, Argentina, Rest of South America)
Middle East and Africa (Saudi Arabia, UAE, Rest of Middle East, South Africa, Egypt, Rest of Africa)
