Global Canola Mayonnaise Market Size is valued at $XX Million in 2024 and is forecast to register a growth rate (CAGR) of 4.3% to reach $XX Million by 2032.
The global Canola Mayonnaise Market Comprehensive Study analyzes and forecasts the market size across 6 regions and 24 countries for diverse segments -By Type (Cholesterol Free, Low Cholesterol), By Application (Vegetable Salad, Meat Salad, Dessert, Others)
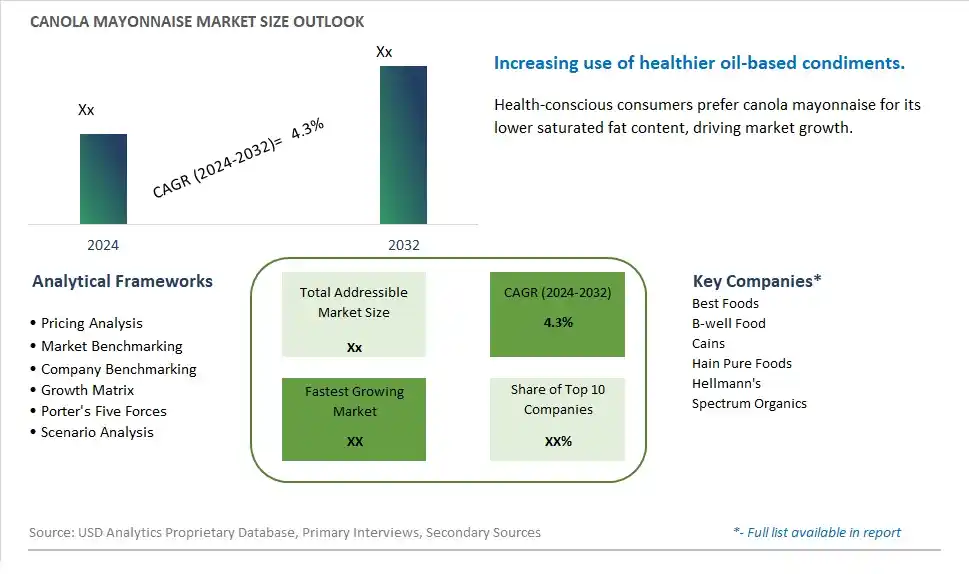
An Introduction to Canola Mayonnaise Market
The Canola Mayonnaise market in 2024 is expanding rapidly, driven by the increasing demand for healthier and lower-fat alternatives to traditional mayonnaise. Canola mayonnaise, made with canola oil, is valued for its lower saturated fat content and heart-healthy benefits, while still offering the creamy texture and rich flavor desired in sandwiches, salads, and dips. The market is supported by the growing trend towards health-conscious eating and the demand for functional foods that provide added nutritional benefits. Advances in formulation and production technologies are enhancing the taste, consistency, and stability of canola mayonnaise. The market is also benefiting from the trend towards clean-label and non-GMO products, appealing to consumers seeking high-quality and healthful condiment options.
Canola Mayonnaise Competitive Landscape
The market report analyses the leading companies in the industry including Best Foods, B-well Food, Cains, Hain Pure Foods, Hellmann's, Spectrum Organics, and Others.
Canola Mayonnaise Market Dynamics
Canola Mayonnaise Market Trend: Shift Towards Healthier Food Choices
One prominent market trend for canola mayonnaise is the shift towards healthier food choices among consumers. With increasing awareness of the impact of diet on health, more people are looking for alternatives to traditional mayonnaise that are lower in saturated fat and cholesterol. Canola mayonnaise, made from canola oil which is known for its heart-healthy properties, is gaining popularity as a healthier option without compromising on taste and texture.
Canola Mayonnaise Market Driver: Health and Wellness Concerns
The market driver for canola mayonnaise is the growing concern for health and wellness. Consumers are becoming more conscious of the ingredients in their food and are actively seeking products that align with their health goals. Canola mayonnaise, being free from trans fats and made with healthier oils, addresses these concerns and appeals to health-conscious individuals looking for better-for-you alternatives to traditional mayonnaise.
Canola Mayonnaise Market Opportunity: Positioning as a Versatile and Flavorful Condiment
An opportunity within the canola mayonnaise market lies in positioning the product as a versatile and flavorful condiment. Canola mayonnaise can be used in various dishes, from sandwiches and salads to dips and sauces, offering a creamy texture and a mild flavor that complements a wide range of ingredients. Companies can capitalize on this by promoting canola mayonnaise as a must-have pantry staple for adding richness and flavor to meals while also promoting its health benefits, attracting both health-conscious and flavor-seeking consumers.
Canola Mayonnaise Market Share Analysis: Cholesterol Free Canola Mayonnaise segment generated the highest revenue share in the industry
The largest segment in the Canola Mayonnaise Market is Cholesterol-Free Canola Mayonnaise. This segment has experienced significant growth and garnered widespread consumer preference due to several factors. Firstly, with increasing health consciousness among consumers, there is a growing demand for healthier food options, including products with reduced cholesterol levels. Canola oil, known for its heart-healthy benefits and low saturated fat content, serves as a primary ingredient in cholesterol-free mayonnaise variants, making them a popular choice among health-conscious individuals. Further, the versatility of cholesterol-free canola mayonnaise in various culinary applications, such as salad dressings, sandwich spreads, and dipping sauces, further contributes to its market dominance. Additionally, manufacturers often promote the nutritional benefits and cholesterol-lowering properties of canola-based mayonnaise, attracting a broader consumer base concerned about heart health and overall well-being. As a result, the Cholesterol-Free Canola Mayonnaise segment emerges as the largest and fastest-growing segment within the Canola Mayonnaise Market, reflecting evolving consumer preferences towards healthier food options.
Canola Mayonnaise Market Share Analysis: Desserts is the fastest growing segment over the forecast period to 2032
The fastest-growing segment in the Canola Mayonnaise Market is Canola Mayonnaise in Desserts. This particular application of canola mayonnaise has witnessed rapid growth due to several factors. Firstly, there is a rising trend in the culinary world towards incorporating healthier ingredients into desserts without compromising taste and texture. Canola mayonnaise, being cholesterol-free and rich in beneficial fats, serves as an excellent substitute for traditional high-fat ingredients like butter or heavy cream in dessert recipes. This substitution not only reduces the overall calorie and saturated fat content but also adds a velvety texture and moistness to desserts such as cakes, cupcakes, and pastries. Additionally, manufacturers and chefs have been innovating with canola mayonnaise-based dessert recipes, showcasing its versatility and ability to enhance the flavor profile of sweet treats. The growing awareness among consumers about the health benefits of canola oil and its derivatives further fuels the demand for Canola Mayonnaise in Desserts. As a result, this segment is poised for significant growth and is expected to continue expanding rapidly until 2032, catering to health-conscious consumers seeking healthier yet indulgent dessert options.
Canola Mayonnaise Market Segmentation
By Type
Cholesterol Free
Low Cholesterol
By Application
Vegetable Salad
Meat Salad
Dessert
Others
Countries Analyzed
North America (US, Canada, Mexico)
Europe (Germany, UK, France, Spain, Italy, Russia, Rest of Europe)
Asia Pacific (China, India, Japan, South Korea, Australia, South East Asia, Rest of Asia)
South America (Brazil, Argentina, Rest of South America)
Middle East and Africa (Saudi Arabia, UAE, Rest of Middle East, South Africa, Egypt, Rest of Africa)
Canola Mayonnaise Companies Profiled in the Study
Best Foods
B-well Food
Cains
Hain Pure Foods
Hellmann's
Spectrum Organics
*- List Not Exhaustive
Chapter 1. TABLE OF CONTENTS
Chapter 2. Introduction to Canola Mayonnaise Market
2.1. Market Overview
2.2. Key Statistics and Report Highlights
2.3. Scope of the Comprehensive Study
2.3.1. Market Definition
2.3.2 Countries and Regions Covered
2.3.3 Research Objective
2.3.4 Units, Currency, and Conversions
2.3.5 Industry Value Chain
2.4. Key Market Segments
2.5. Key Companies
2.6. Study Period
Chapter 3. Strategic Analysis Review
3.1. Canola Mayonnaise Pricing Analysis and Forecast
3.2. Porter’s Five Forces
3.3. Market Ecosystem
3.4. SWOT Analysis
3.5. Regulatory Scenario
3.3. Effects of Inflation, Russia-Ukraine War, moderating economic growth, and other macroeconomic factors
Chapter 4. Competitive Landscape
4.1. Market Share Analysis
4.1.1. Global Canola Mayonnaise Market Share by Company, 2023
4.1.2. Product Offerings of Leading Canola Mayonnaise Companies
4.2. Market Entropy
4.2.1. New Product Launches in the Industry
4.2.2. Mergers, Acquisitions, Joint ventures, and Partnerships
4.3. Key Strategies and Best Practices
Chapter 5. Global Market Projections: Best, Reference, and Low Case Scenarios
5.1. Growth Analysis- Case Scenario Definitions
5.2. Low Growth Case Scenario Forecasts
5.3. Reference Growth Case Scenario Forecasts
5.4. High Growth Case Scenario Forecasts
Chapter 6. Market Dynamics
6.1. Canola Mayonnaise Market Drivers
6.2. Canola Mayonnaise Market Challenges
6.6. Canola Mayonnaise Market Opportunities
6.4. Canola Mayonnaise Market Trends
Chapter 7. Global Canola Mayonnaise Market Outlook Trends
7.1. Global Canola Mayonnaise Revenue (USD Million) and CAGR (%) by Type (2021-2032)
7.2. Global Canola Mayonnaise Revenue (USD Million) and CAGR (%) by Application (2021-2032)
7.3. Global Canola Mayonnaise Revenue (USD Million) and CAGR (%) by Product (2021-2032)
By Type
Cholesterol Free
Low Cholesterol
By Application
Vegetable Salad
Meat Salad
Dessert
Others
Chapter 8. Global Canola Mayonnaise Regional Analysis and Outlook
8.1. Global Canola Mayonnaise Revenue (USD Million) By Regions (2021- 2032)
8.2. North America Canola Mayonnaise Revenue (USD Million) by Country (2021-2032)
8.2.1. United States Canola Mayonnaise Regional Analysis and Outlook
8.2.2. Canada Canola Mayonnaise Regional Analysis and Outlook
8.2.3. Mexico Canola Mayonnaise Regional Analysis and Outlook
8.3. Europe Canola Mayonnaise Revenue (USD Million), by Country (2021-2032)
8.3.1. Germany Canola Mayonnaise Regional Analysis and Outlook
8.3.2. France Canola Mayonnaise Regional Analysis and Outlook
8.3.3. United Kingdom Canola Mayonnaise Regional Analysis and Outlook
8.3.4. Spain Canola Mayonnaise Regional Analysis and Outlook
8.3.5. Italy Canola Mayonnaise Regional Analysis and Outlook
8.3.6. Russia Canola Mayonnaise Regional Analysis and Outlook
8.3.7. Rest of Europe Canola Mayonnaise Regional Analysis and Outlook
8.4. Asia Pacific Canola Mayonnaise Revenue (USD Million) by Country (2021-2032)
8.4.1. China Canola Mayonnaise Regional Analysis and Outlook
8.4.2. Japan Canola Mayonnaise Regional Analysis and Outlook
8.4.3. India Canola Mayonnaise Regional Analysis and Outlook
8.4.4. South Korea Canola Mayonnaise Regional Analysis and Outlook
8.4.5. Australia Canola Mayonnaise Regional Analysis and Outlook
8.4.6. South East Asia Canola Mayonnaise Regional Analysis and Outlook
8.4.7. Rest of Asia Pacific Canola Mayonnaise Regional Analysis and Outlook
8.5. South America Canola Mayonnaise Revenue (USD Million), by Country (2021-2032)
8.5.1. Brazil Canola Mayonnaise Regional Analysis and Outlook
8.5.2. Argentina Canola Mayonnaise Regional Analysis and Outlook
8.5.3. Rest of South America Canola Mayonnaise Regional Analysis and Outlook
8.6. Middle East and Africa Canola Mayonnaise Revenue (USD Million) by Country (2021-2032)
8.6.1. Middle East Canola Mayonnaise Regional Analysis and Outlook
8.6.2. Africa Canola Mayonnaise Regional Analysis and Outlook
Chapter 9. North America Canola Mayonnaise Analysis and Outlook
9.1. North America Canola Mayonnaise Revenue (USD Million) by Segments (2021-2032)
9.1.1. North America Canola Mayonnaise Revenue (USD Million) by Type (2021-2032)
9.1.2. North America Canola Mayonnaise Revenue (USD Million) by Application (2021-2032)
9.1.3. North America Canola Mayonnaise Revenue (USD Million) by Product (2021-2032)
By Type
Cholesterol Free
Low Cholesterol
By Application
Vegetable Salad
Meat Salad
Dessert
Others
Chapter 10. Europe Canola Mayonnaise Analysis and Outlook
10.1. Europe Canola Mayonnaise Revenue (USD Million), by Segments (USD Million) (2021-2032)
10.1.1. Europe Canola Mayonnaise Revenue (USD Million) by Type (2021-2032)
10.1.2. Europe Canola Mayonnaise Revenue (USD Million) by Application (2021-2032)
10.1.3. Europe Canola Mayonnaise Revenue (USD Million) by Product (2021-2032)
By Type
Cholesterol Free
Low Cholesterol
By Application
Vegetable Salad
Meat Salad
Dessert
Others
Chapter 11. Asia Pacific Canola Mayonnaise Analysis and Outlook
11.1. Asia Pacific Canola Mayonnaise Revenue (USD Million), and Revenue (USD Million) by Segments (2021-2032)
11.1.1. Asia Pacific Canola Mayonnaise Revenue (USD Million) by Type (2021-2032)
11.1.2. Asia Pacific Canola Mayonnaise Revenue (USD Million) by Application (2021-2032)
11.1.3. Asia Pacific Canola Mayonnaise Revenue (USD Million) by Product (2021-2032)
By Type
Cholesterol Free
Low Cholesterol
By Application
Vegetable Salad
Meat Salad
Dessert
Others
Chapter 12. South America Canola Mayonnaise Analysis and Outlook
12.1. South America Canola Mayonnaise Revenue (USD Million), by Segments (2021-2032)
12.1.1. South America Canola Mayonnaise Revenue (USD Million) by Type (2021-2032)
12.1.2. South America Canola Mayonnaise Revenue (USD Million) by Application (2021-2032)
12.1.3. South America Canola Mayonnaise Revenue (USD Million) by Product (2021-2032)
By Type
Cholesterol Free
Low Cholesterol
By Application
Vegetable Salad
Meat Salad
Dessert
Others
Chapter 13. Middle East and Africa Canola Mayonnaise Analysis and Outlook
13.1. Middle East and Africa Canola Mayonnaise Revenue (USD Million), by Segments (2021-2032)
13.1.1. Middle East and Africa Canola Mayonnaise Revenue (USD Million) by Type (2021-2032)
13.1.2. Middle East and Africa Canola Mayonnaise Revenue (USD Million) by Application (2021-2032)
13.1.3. Middle East and Africa Canola Mayonnaise Revenue (USD Million) by Product (2021-2032)
By Type
Cholesterol Free
Low Cholesterol
By Application
Vegetable Salad
Meat Salad
Dessert
Others
Chapter 14. Canola Mayonnaise Company Profiles
14.1 Business Overview
14.2 Product Profiles
14.3 SWOT Profiles
14.5 Recent Developments
14.6 Financial Profile
List of Companies
Best Foods
B-well Food
Cains
Hain Pure Foods
Hellmann's
Spectrum Organics
15. Methodology and Data Sources
15.1 Customization Offerings
15.2 Subscription Services
15.3 Related Reports
15.4 Publisher Expertise
LIST OF TABLES
Table 1 Market Segmentation Analysis
Table 2 Global Canola Mayonnaise Market Share of Leading Companies, 2023
Table 3 Product Offerings of Leading Companies
Table 4 Low Growth Scenario Forecasts
Table 5 Reference Case Growth Scenario
Table 6 High Growth Case Scenario
Table 7 Global Canola Mayonnaise Revenue (USD Million) And CAGR (%) By Type (2021-2032)
Table 8 Global Canola Mayonnaise Revenue (USD Million) And CAGR (%) By Application (2021-2032)
Table 9 Global Canola Mayonnaise Revenue (USD Million) And CAGR (%) By Product (2021-2032)
Table 10 Global Canola Mayonnaise Market Revenue (USD Million) By Regions (2021-2032)
Table 11 Global Canola Mayonnaise Market Share (%) By Regions (2021-2032)
Table 12 North America Canola Mayonnaise Revenue (USD Million) By Country (2021-2032)
Table 13 Europe Canola Mayonnaise Revenue (USD Million) By Country (2021-2032)
Table 14 Asia Pacific Canola Mayonnaise Revenue (USD Million) By Country (2021-2032)
Table 15 South America Canola Mayonnaise Revenue (USD Million) By Country (2021-2032)
Table 16 Middle East and Africa Canola Mayonnaise Revenue (USD Million) By Region (2021-2032)
Table 17 North America Canola Mayonnaise Revenue (USD Million) By Type (2021-2032)
Table 18 North America Canola Mayonnaise Revenue (USD Million) By Application (2021-2032)
Table 19 North America Canola Mayonnaise Revenue (USD Million) By Product (2021-2032)
Table 20 Europe Canola Mayonnaise Revenue (USD Million) By Type (2021-2032)
Table 21 Europe Canola Mayonnaise Revenue (USD Million) By Application (2021-2032)
Table 22 Europe Canola Mayonnaise Revenue (USD Million) By Product (2021-2032)
Table 23 Asia Pacific Canola Mayonnaise Revenue (USD Million) By Type (2021-2032)
Table 24 Asia Pacific Canola Mayonnaise Revenue (USD Million) By Application (2021-2032)
Table 25 Asia Pacific Canola Mayonnaise Revenue (USD Million) By Product (2021-2032)
Table 26 South America Canola Mayonnaise Revenue (USD Million) By Type (2021-2032)
Table 27 South America Canola Mayonnaise Revenue (USD Million) By Application (2021-2032)
Table 28 South America Canola Mayonnaise Revenue (USD Million) By Product (2021-2032)
Table 29 Middle East and Africa Canola Mayonnaise Revenue (USD Million) By Type (2021-2032)
Table 30 Middle East and Africa Canola Mayonnaise Revenue (USD Million) By Application (2021-2032)
Table 31 Middle East and Africa Canola Mayonnaise Revenue (USD Million) By Product (2021-2032)
LIST OF FIGURES
Figure 1. Market Scope
Figure 2. Pricing Forecasts Per Unit, 2023- 2032
Figure 3. Porter’s Five Forces
Figure 4. Global Canola Mayonnaise Market Revenue (USD Million) By Regions (2021-2032)
Figure 5. Global Canola Mayonnaise Market Share (%) By Regions (2023)
Figure 6. North America Canola Mayonnaise Revenue (USD Million) By Country (2021-2032)
Figure 7. United States Canola Mayonnaise Revenue (USD Million) By Country (2021-2032)
Figure 8. Canada Canola Mayonnaise Revenue (USD Million) By Country (2021-2032)
Figure 9. Mexico Canola Mayonnaise Revenue (USD Million) By Country (2021-2032)
Figure 10. Europe Canola Mayonnaise Revenue (USD Million) By Country (2021-2032)
Figure 11. Germany Canola Mayonnaise Revenue (USD Million) By Country (2021-2032)
Figure 12. France Canola Mayonnaise Revenue (USD Million) By Country (2021-2032)
Figure 13. United Kingdom Canola Mayonnaise Revenue (USD Million) By Country (2021-2032)
Figure 14. Spain Canola Mayonnaise Revenue (USD Million) By Country (2021-2032)
Figure 15. Italy Canola Mayonnaise Revenue (USD Million) By Country (2021-2032)
Figure 16. Russia Canola Mayonnaise Revenue (USD Million) By Country (2021-2032)
Figure 17. Rest of Europe Canola Mayonnaise Revenue (USD Million) By Country (2021-2032)
Figure 11. Asia Pacific Canola Mayonnaise Revenue (USD Million) By Country (2021-2032)
Figure 12. China Canola Mayonnaise Revenue (USD Million) By Country (2021-2032)
Figure 13. Japan Canola Mayonnaise Revenue (USD Million) By Country (2021-2032)
Figure 14. India Canola Mayonnaise Revenue (USD Million) By Country (2021-2032)
Figure 15. South Korea Canola Mayonnaise Revenue (USD Million) By Country (2021-2032)
Figure 16. Australia Canola Mayonnaise Revenue (USD Million) By Country (2021-2032)
Figure 17. South East Asia Canola Mayonnaise Revenue (USD Million) By Country (2021-2032)
Figure 18. South America Canola Mayonnaise Revenue (USD Million) By Country (2021-2032)
Figure 19. Brazil Canola Mayonnaise Revenue (USD Million) By Country (2021-2032)
Figure 20. Argentina Canola Mayonnaise Revenue (USD Million) By Country (2021-2032)
Figure 21. Rest of Asia Pacific Canola Mayonnaise Revenue (USD Million) By Country (2021-2032)
Figure 22. Middle East and Africa Canola Mayonnaise Revenue (USD Million) By Region (2021-2032)
Figure 23. Saudi Arabia Canola Mayonnaise Revenue (USD Million) By Region (2021-2032)
Figure 24. The UAE Canola Mayonnaise Revenue (USD Million) By Region (2021-2032)
Figure 25. Rest of Middle East Canola Mayonnaise Revenue (USD Million) By Region (2021-2032)
Figure 26. South Africa Canola Mayonnaise Revenue (USD Million) By Region (2021-2032)
Figure 27. Africa Canola Mayonnaise Revenue (USD Million) By Region (2021-2032)
Figure 28. North America Canola Mayonnaise Revenue (USD Million) By Type (2021-2032)
Figure 29. North America Canola Mayonnaise Revenue (USD Million) By Application (2021-2032)
Figure 30. North America Canola Mayonnaise Revenue (USD Million) By Product (2021-2032)
Figure 31. Europe Canola Mayonnaise Revenue (USD Million) By Type (2021-2032)
Figure 32. Europe Canola Mayonnaise Revenue (USD Million) By Application (2021-2032)
Figure 33. Europe Canola Mayonnaise Revenue (USD Million) By Product (2021-2032)
Figure 34. Asia Pacific Canola Mayonnaise Revenue (USD Million) By Type (2021-2032)
Figure 35. Asia Pacific Canola Mayonnaise Revenue (USD Million) By Application (2021-2032)
Figure 36. Asia Pacific Canola Mayonnaise Revenue (USD Million) By Product (2021-2032)
Figure 37. South America Canola Mayonnaise Revenue (USD Million) By Type (2021-2032)
Figure 38. South America Canola Mayonnaise Revenue (USD Million) By Application (2021-2032)
Figure 39. South America Canola Mayonnaise Revenue (USD Million) By Product (2021-2032)
Figure 40. Middle East and Africa Canola Mayonnaise Revenue (USD Million) By Type (2021-2032)
Figure 41. Middle East and Africa Canola Mayonnaise Revenue (USD Million) By Application (2021-2032)
Figure 42. Middle East and Africa Canola Mayonnaise Revenue (USD Million) By Product (2021-2032)
By Type
Cholesterol Free
Low Cholesterol
By Application
Vegetable Salad
Meat Salad
Dessert
Others
Countries Analyzed
North America (US, Canada, Mexico)
Europe (Germany, UK, France, Spain, Italy, Russia, Rest of Europe)
Asia Pacific (China, India, Japan, South Korea, Australia, South East Asia, Rest of Asia)
South America (Brazil, Argentina, Rest of South America)
Middle East and Africa (Saudi Arabia, UAE, Rest of Middle East, South Africa, Egypt, Rest of Africa)
