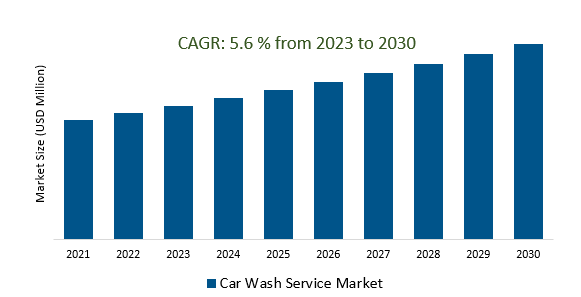
The Car Wash Service Market Size is estimated to register 5.6% growth over the forecast period from 2023 to 2030.
Car Wash Service Market Overview
Growing trend toward eco-consciousness, leading to a higher demand for environmentally friendly car wash solutions. Car wash services are increasingly prioritizing customer convenience by offering on-demand mobile car washing services or subscription-based models. The rising number of vehicles on the roads globally directly correlates with the demand for car wash services. With a greater emphasis on vehicle maintenance and appearance, car owners are increasingly prioritizing regular cleaning and detailing services. Further, Urbanization has led to busier lifestyles and time constraints for vehicle owners, making professional car wash services more appealing. The increasing demand for professional car detailing services, including paint protection, interior cleaning, and specialized treatments are contributing to the growth of the overall car wash market.
Car Wash Service Market Dynamics
Market Trends- Rising Demand for Convenience and Time Efficiency in Car Wash Service Market
Car wash facilities that provide quick and hassle-free cleaning solutions, aligning with their fast-paced routines and demanding schedules are fueling the market growth.
Integration of offering subscription packages for regular car washes not only simplifies the customer experience but also ensures a consistent flow of clientele and revenue, thereby enhancing the business's stability and growth potential.
Further, businesses are tailoring their services to suit the fast-paced lifestyle, offering express wash options or mobile services that save customers valuable time without compromising on quality.
Market Driver- Demand for Embracing Contactless Solutions for Safety in Car Wash Service Market
Automated and touchless car wash solutions streamlining processes, reducing labor costs, and optimizing resource utilization are the key factors.
Additionally, the ability of contactless systems to maintain vehicle integrity by reducing the risk of scratches or damage during the cleaning process resonates strongly with car owners concerned about preserving their vehicle's condition are driving the market growth.
Furthermore, aligning with evolving regulatory standards for cleanliness and hygiene in service industries are supporting the adoption of contactless solutions.
Market Opportunity- The car wash market is witnessing a notable increase in favor of eco-friendly solutions for cleaning vehicles.
The key drivers behind the growing preference for eco-friendly car wash solutions Includes the need for differentiation and market positioning.
Businesses investing in environmentally responsible practices not only caters to the growing consumer preference for sustainability but also attracts a new demographic of environmentally aware customers.
Cost savings from reduced water consumption, decreased environmental impact, and improved brand reputation as a socially responsible entity are contributing to the overall business success and sustainability.
Market Share Analysis- Tunnels will register the fastest growth.
The Car Wash Service Market is analyzed across Tunnels, Roll-Over/In-Bay, Self Service and others. Tunnels is poised to register the fastest growth. These facilities, also known as "Express Exterior" or "Conveyor" car washes are gaining notable traction due to their efficiency, speed, and ability to deliver a quick yet thorough cleaning process for vehicles. Utilizing high-pressure water jets, foam applicators, brushes, and drying systems, these car washes efficiently clean the vehicle's exterior within a few minutes. Unlike traditional hand-washing or self-service options, tunnel car washes employ automated systems that efficiently move vehicles through a tunnel-like structure equipped with various cleaning mechanisms. The growing demand for efficiency, coupled with technological advancements and the convenience offered by tunnel car washes is propelling this segment's growth within the car wash service market.
Market Share Analysis- Cashless payment held a significant market share in 2023.
The Car Wash Service Market is analyzed across various payment methods including Cash Payment, Cashless Payment. Of these, Cashless payment held a significant market share in 2023. Cashless payment options, including credit/debit cards, mobile payments, and contactless methods like NFC (Near Field Communication) or digital wallets, have been increasingly preferred by both car wash businesses and customers. Firstly, convenience plays a pivotal role, as digital payment options offer a faster and more streamlined transaction process. Customers appreciate the ease and speed of completing payments without the need for physical cash, especially in a service-oriented environment like car washes, where efficiency is highly valued. These platforms provide a level of security and transparency that many customers find reassuring, especially in comparison to carrying cash or dealing with potential change-related issues at car wash facilities.
Car Wash Service Market Segmentation
By Type
- Tunnels
- Roll-Over/In-Bay
- Self Service
By Mode of Payment
- Cash Payment
- Cashless Payment
By Region
- North America (United States, Canada, Mexico)
- Europe (Germany, France, United Kingdom, Spain, Italy, Others)
- Asia Pacific (China, India, Japan, South Korea, Australia, Others)
- Latin America (Brazil, Argentina, Others)
- Middle East and Africa (Saudi Arabia, UAE, Kuwait, Other Middle East, South Africa, Nigeria, Other Africa)
Car Wash Service Market Companies
- Zips Car Wash
- Splash Car Wash
- International Car Wash Group (ICW)
- Autobell Car Wash
- Quick Quack Car Wash
- Super Star Car Wash
- True Blue Car Wash LLC
- Magic Hands Car Wash
- Hoffman Car Wash
- Wash Depot Holdings Inc
*List not exhaustive
Car Wash Service Market Outlook 2023
1 Market Overview
1.1 Introduction to the Car Wash Service Market
1.2 Scope of the Study
1.3 Research Objective
1.3.1 Key Market Scope and Segments
1.3.2 Players Covered
1.3.3 Years Considered
2 Executive Summary
2.1 2023 Car Wash Service Industry- Market Statistics
3 Market Dynamics
3.1 Market Drivers
3.2 Market Challenges
3.3 Market Opportunities
3.4 Market Trends
4 Market Factor Analysis
4.1 Porter’s Five Forces
4.2 Market Entropy
4.2.1 Global Car Wash Service Market Companies with Area Served
4.2.2 Products Offerings Global Car Wash Service Market
5 COVID-19 Impact Analysis and Outlook Scenarios
5.1.1 Covid-19 Impact Analysis
5.1.2 post-COVID-19 Scenario- Low Growth Case
5.1.3 post-COVID-19 Scenario- Reference Growth Case
5.1.4 post-COVID-19 Scenario- Low Growth Case
6 Global Car Wash Service Market Trends
6.1 Global Car Wash Service Revenue (USD Million) and CAGR (%) by Type (2018-2030)
6.2 Global Car Wash Service Revenue (USD Million) and CAGR (%) by Applications (2018-2030)
6.3 Global Car Wash Service Revenue (USD Million) and CAGR (%) by regions (2018-2030)
7 Global Car Wash Service Market Revenue (USD Million) by Type, and Applications (2018-2022)
7.1 Global Car Wash Service Revenue (USD Million) by Type (2018-2022)
7.1.1 Global Car Wash Service Revenue (USD Million), Market Share (%) by Type (2018-2022)
7.2 Global Car Wash Service Revenue (USD Million) by Applications (2018-2022)
7.2.1 Global Car Wash Service Revenue (USD Million), Market Share (%) by Applications (2018-2022)
8 Global Car Wash Service Development Regional Status and Outlook
8.1 Global Car Wash Service Revenue (USD Million) By Regions (2018-2022)
8.2 North America Car Wash Service Revenue (USD Million) by Type, and Application (2018-2022)
8.2.1 North America Car Wash Service Revenue (USD Million) by Country (2018-2022)
8.2.2 North America Car Wash Service Revenue (USD Million) by Type (2018-2022)
8.2.3 North America Car Wash Service Revenue (USD Million) by Applications (2018-2022)
8.3 Europe Car Wash Service Revenue (USD Million), by Type, and Applications (USD Million) (2018-2022)
8.3.1 Europe Car Wash Service Revenue (USD Million), by Country (2018-2022)
8.3.2 Europe Car Wash Service Revenue (USD Million) by Type (2018-2022)
8.3.3 Europe Car Wash Service Revenue (USD Million) by Applications (2018-2022)
8.4 Asia Pacific Car Wash Service Revenue (USD Million), and Revenue (USD Million) by Type, and Applications (2018-2022)
8.4.1 Asia Pacific Car Wash Service Revenue (USD Million) by Country (2018-2022)
8.4.2 Asia Pacific Car Wash Service Revenue (USD Million) by Type (2018-2022)
8.4.3 Asia Pacific Car Wash Service Revenue (USD Million) by Applications (2018-2022)
8.5 South America Car Wash Service Revenue (USD Million), by Type, and Applications (2018-2022)
8.5.1 South America Car Wash Service Revenue (USD Million), by Country (2018-2022)
8.5.2 South America Car Wash Service Revenue (USD Million) by Type (2018-2022)
8.5.3 South America Car Wash Service Revenue (USD Million) by Applications (2018-2022)
8.6 Middle East and Africa Car Wash Service Revenue (USD Million), by Type, Technology, Application, Thickness (2018-2022)
8.6.1 Middle East and Africa Car Wash Service Revenue (USD Million) by Country (2018-2022)
8.6.2 Middle East and Africa Car Wash Service Revenue (USD Million) by Type (2018-2022)
8.6.3 Middle East and Africa Car Wash Service Revenue (USD Million) by Applications (2018-2022)
9 Company Profiles
10 Global Car Wash Service Market Revenue (USD Million), by Type, and Applications (2023-2030)
10.1 Global Car Wash Service Revenue (USD Million) and Market Share (%) by Type (2023-2030)
10.1.1 Global Car Wash Service Revenue (USD Million), and Market Share (%) by Type (2023-2030)
10.2 Global Car Wash Service Revenue (USD Million) and Market Share (%) by Applications (2023-2030)
10.2.1 Global Car Wash Service Revenue (USD Million), and Market Share (%) by Applications (2023-2030)
11 Global Car Wash Service Development Regional Status and Outlook Forecast
11.1 Global Car Wash Service Revenue (USD Million) By Regions (2023-2030)
11.2 North America Car Wash Service Revenue (USD Million) by Type, and Applications (2023-2030)
11.2.1 North America Car Wash Service Revenue (USD) Million by Country (2023-2030)
11.2.2 North America Car Wash Service Revenue (USD Million), by Type (2023-2030)
11.2.3 North America Car Wash Service Revenue (USD Million), Market Share (%) by Applications (2023-2030)
11.3 Europe Car Wash Service Revenue (USD Million), by Type, and Applications (2023-2030)
11.3.1 Europe Car Wash Service Revenue (USD Million), by Country (2023-2030)
11.3.2 Europe Car Wash Service Revenue (USD Million), by Type (2023-2030)
11.3.3 Europe Car Wash Service Revenue (USD Million), by Applications (2023-2030)
11.4 Asia Pacific Car Wash Service Revenue (USD Million) by Type, and Applications (2023-2030)
11.4.1 Asia Pacific Car Wash Service Revenue (USD Million), by Country (2023-2030)
11.4.2 Asia Pacific Car Wash Service Revenue (USD Million), by Type (2023-2030)
11.4.3 Asia Pacific Car Wash Service Revenue (USD Million), by Applications (2023-2030)
11.5 South America Car Wash Service Revenue (USD Million), by Type, and Applications (2023-2030)
11.5.1 South America Car Wash Service Revenue (USD Million), by Country (2023-2030)
11.5.2 South America Car Wash Service Revenue (USD Million), by Type (2023-2030)
11.5.3 South America Car Wash Service Revenue (USD Million), by Applications (2023-2030)
11.6 Middle East and Africa Car Wash Service Revenue (USD Million), by Type, and Applications (2023-2030)
11.6.1 Middle East and Africa Car Wash Service Revenue (USD Million), by region (2023-2030)
11.6.2 Middle East and Africa Car Wash Service Revenue (USD Million), by Type (2023-2030)
11.6.3 Middle East and Africa Car Wash Service Revenue (USD Million), by Applications (2023-2030)
12 Methodology and Data Sources
12.1 Methodology/Research Approach
12.1.1 Research Programs/Design
12.1.2 Market Size Estimation
12.1.3 Market Breakdown and Data Triangulation
12.2 Data Sources
12.2.1 Secondary Sources
12.2.2 Primary Sources
12.3 Disclaimer
List of Tables
Table 1 Market Segmentation Analysis
Table 2 Global Car Wash Service Market Companies with Areas Served
Table 3 Products Offerings Global Car Wash Service Market
Table 4 Low Growth Scenario Forecasts
Table 5 Reference Case Growth Scenario
Table 6 High Growth Case Scenario
Table 7 Global Car Wash Service Revenue (USD Million) And CAGR (%) By Type (2018-2030)
Table 8 Global Car Wash Service Revenue (USD Million) And CAGR (%) By Applications (2018-2030)
Table 9 Global Car Wash Service Revenue (USD Million) And CAGR (%) By Regions (2018-2030)
Table 10 Global Car Wash Service Revenue (USD Million) By Type (2018-2022)
Table 11 Global Car Wash Service Revenue Market Share (%) By Type (2018-2022)
Table 12 Global Car Wash Service Revenue (USD Million) By Applications (2018-2022)
Table 13 Global Car Wash Service Revenue Market Share (%) By Applications (2018-2022)
Table 14 Global Car Wash Service Market Revenue (USD Million) By Regions (2018-2022)
Table 15 Global Car Wash Service Market Share (%) By Regions (2018-2022)
Table 16 North America Car Wash Service Revenue (USD Million) By Country (2018-2022)
Table 17 North America Car Wash Service Revenue (USD Million) By Type (2018-2022)
Table 18 North America Car Wash Service Revenue (USD Million) By Applications (2018-2022)
Table 19 Europe Car Wash Service Revenue (USD Million) By Country (2018-2022)
Table 20 Europe Car Wash Service Revenue (USD Million) By Type (2018-2022)
Table 21 Europe Car Wash Service Revenue (USD Million) By Applications (2018-2022)
Table 22 Asia Pacific Car Wash Service Revenue (USD Million) By Country (2018-2022)
Table 23 Asia Pacific Car Wash Service Revenue (USD Million) By Type (2018-2022)
Table 24 Asia Pacific Car Wash Service Revenue (USD Million) By Applications (2018-2022)
Table 25 South America Car Wash Service Revenue (USD Million) By Country (2018-2022)
Table 26 South America Car Wash Service Revenue (USD Million) By Type (2018-2022)
Table 27 South America Car Wash Service Revenue (USD Million) By Applications (2018-2022)
Table 28 Middle East and Africa Car Wash Service Revenue (USD Million) By Region (2018-2022)
Table 29 Middle East and Africa Car Wash Service Revenue (USD Million) By Type (2018-2022)
Table 30 Middle East and Africa Car Wash Service Revenue (USD Million) By Applications (2018-2022)
Table 31 Financial Analysis
Table 32 Global Car Wash Service Revenue (USD Million) By Type (2023-2030)
Table 33 Global Car Wash Service Revenue Market Share (%) By Type (2023-2030)
Table 34 Global Car Wash Service Revenue (USD Million) By Applications (2023-2030)
Table 35 Global Car Wash Service Revenue Market Share (%) By Applications (2023-2030)
Table 36 Global Car Wash Service Market Revenue (USD Million), And Revenue (USD Million) By Regions (2023-2030)
Table 37 North America Car Wash Service Revenue (USD)By Country (2023-2030)
Table 38 North America Car Wash Service Revenue (USD Million) By Type (2023-2030)
Table 39 North America Car Wash Service Revenue (USD Million) By Applications (2023-2030)
Table 40 Europe Car Wash Service Revenue (USD Million) By Country (2023-2030)
Table 41 Europe Car Wash Service Revenue (USD Million) By Type (2023-2030)
Table 42 Europe Car Wash Service Revenue (USD Million) By Applications (2023-2030)
Table 43 Asia Pacific Car Wash Service Revenue (USD Million) By Country (2023-2030)
Table 44 Asia Pacific Car Wash Service Revenue (USD Million) By Type (2023-2030)
Table 45 Asia Pacific Car Wash Service Revenue (USD Million) By Applications (2023-2030)
Table 46 South America Car Wash Service Revenue (USD Million) By Country (2023-2030)
Table 47 South America Car Wash Service Revenue (USD Million) By Type (2023-2030)
Table 48 South America Car Wash Service Revenue (USD Million) By Applications (2023-2030)
Table 49 Middle East and Africa Car Wash Service Revenue (USD Million) By Region (2023-2030)
Table 50 Middle East and Africa Car Wash Service Revenue (USD Million) By Region (2023-2030)
Table 51 Middle East and Africa Car Wash Service Revenue (USD Million) By Type (2023-2030)
Table 52 Middle East and Africa Car Wash Service Revenue (USD Million) By Applications (2023-2030)
Table 53 Research Programs/Design for This Report
Table 54 Key Data Information from Secondary Sources
Table 55 Key Data Information from Primary Sources
List of Figures
Figure 1 Market Scope
Figure 2 Porter’s Five Forces
Figure 3 Global Car Wash Service Revenue (USD Million) By Type (2018-2022)
Figure 4 Global Car Wash Service Revenue Market Share (%) By Type (2022)
Figure 5 Global Car Wash Service Revenue (USD Million) By Applications (2018-2022)
Figure 6 Global Car Wash Service Revenue Market Share (%) By Applications (2022)
Figure 7 Global Car Wash Service Market Revenue (USD Million) By Regions (2018-2022)
Figure 8 Global Car Wash Service Market Share (%) By Regions (2022)
Figure 9 North America Car Wash Service Revenue (USD Million) By Country (2018-2022)
Figure 10 North America Car Wash Service Revenue (USD Million) By Type (2018-2022)
Figure 11 North America Car Wash Service Revenue (USD Million) By Applications (2018-2022)
Figure 12 Europe Car Wash Service Revenue (USD Million) By Country (2018-2022)
Figure 13 Europe Car Wash Service Revenue (USD Million) By Type (2018-2022)
Figure 14 Europe Car Wash Service Revenue (USD Million) By Applications (2018-2022)
Figure 15 Asia Pacific Car Wash Service Revenue (USD Million) By Country (2018-2022)
Figure 16 Asia Pacific Car Wash Service Revenue (USD Million) By Type (2018-2022)
Figure 17 Asia Pacific Car Wash Service Revenue (USD Million) By Applications (2018-2022)
Figure 18 South America Car Wash Service Revenue (USD Million) By Country (2018-2022)
Figure 19 South America Car Wash Service Revenue (USD Million) By Type (2018-2022)
Figure 20 South America Car Wash Service Revenue (USD Million) By Applications (2018-2022)
Figure 21 Middle East and Africa Car Wash Service Revenue (USD Million) By Region (2018-2022)
Figure 22 Middle East and Africa Car Wash Service Revenue (USD Million) By Type (2018-2022)
Figure 23 Middle East and Africa Car Wash Service Revenue (USD Million) By Applications (2018-2022)
Figure 24 Global Car Wash Service Revenue (USD Million) By Type (2023-2030)
Figure 25 Global Car Wash Service Revenue Market Share (%) By Type (2030)
Figure 26 Global Car Wash Service Revenue (USD Million) By Applications (2023-2030)
Figure 27 Global Car Wash Service Revenue Market Share (%) By Applications (2030)
Figure 28 Global Car Wash Service Market Revenue (USD Million) By Regions (2023-2030)
Figure 29 North America Car Wash Service Revenue (USD Million) By Country (2023-2030)
Figure 30 North America Car Wash Service Revenue (USD Million) By Type (2023-2030)
Figure 31 North America Car Wash Service Revenue (USD Million) By Applications (2023-2030)
Figure 32 Europe Car Wash Service Revenue (USD Million) By Country (2023-2030)
Figure 33 Europe Car Wash Service Revenue (USD Million) By Type (2023-2030)
Figure 34 Europe Car Wash Service Revenue (USD Million) By Applications (2023-2030)
Figure 35 Asia Pacific Car Wash Service Revenue (USD Million) By Country (2023-2030)
Figure 36 Asia Pacific Car Wash Service Revenue (USD Million) By Type (2023-2030)
Figure 37 Asia Pacific Car Wash Service Revenue (USD Million) By Applications (2023-2030)
Figure 38 South America Car Wash Service Revenue (USD Million) By Country (2023-2030)
Figure 39 South America Car Wash Service Revenue (USD Million) By Type (2023-2030)
Figure 40 South America Car Wash Service Revenue (USD Million) By Applications (2023-2030)
Figure 41 Middle East and Africa Car Wash Service Revenue (USD Million) By Region (2023-2030)
Figure 42 Middle East and Africa Car Wash Service Revenue (USD Million) By Region (2023-2030)
Figure 43 Middle East and Africa Car Wash Service Revenue (USD Million) By Type (2023-2030)
Figure 44 Middle East and Africa Car Wash Service Revenue (USD Million) By Applications (2023-2030)
Figure 45 Bottom-Up and Top-Down Approaches for This Report
Figure 46 Data Triangulation
