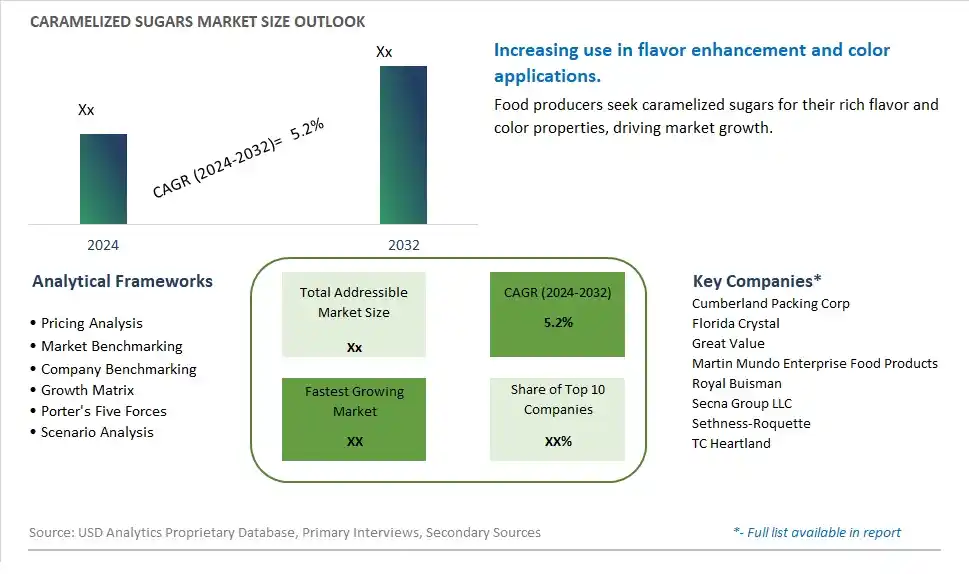
Global Caramelized Sugars Market Size is valued at $XX Million in 2024 and is forecast to register a growth rate (CAGR) of 5.2% to reach $XX Million by 2032.
The global Caramelized Sugars Market Comprehensive Study analyzes and forecasts the market size across 6 regions and 24 countries for diverse segments -By Form (Syrup, Powder, Liquid), By End-User (Bakery & Confectionery Products, Dairy Products, Meat & Meat Preparations, Beverages, Savory Dishes, Infant Food Products, Pet Food), By Distribution Channel (B2B, B2C)
An Introduction to Caramelized Sugars Market
In 2024, the Caramelized Sugars market is witnessing significant growth, driven by the increasing demand for natural sweeteners and flavor enhancers in the food and beverage industry. Caramelized sugars, known for their rich, complex flavor profiles, are used in a variety of applications including confections, baked goods, sauces, and beverages. The market is supported by the growing trend towards clean-label and minimally processed ingredients. Advances in caramelization techniques and production processes are enhancing the flavor, texture, and consistency of caramelized sugars. The market is also benefiting from the trend towards artisanal and gourmet products, appealing to consumers seeking unique and high-quality food experiences.
Caramelized Sugars Competitive Landscape
The market report analyses the leading companies in the industry including Cumberland Packing Corp, Florida Crystal, Great Value, Martin Mundo Enterprise Food Products, Royal Buisman, Secna Group LLC, Sethness-Roquette, TC Heartland, and Others.
Caramelized Sugars Market Dynamics
Caramelized Sugars Market Trend: Natural and Clean Label Ingredients
A prominent market trend for caramelized sugars is the growing demand for natural and clean label ingredients in the food and beverage industry. Consumers are increasingly seeking products made with natural sweeteners and ingredients, driving the popularity of caramelized sugars due to their natural origin and clean label appeal.
Caramelized Sugars Market Driver: Flavor Enhancement and Versatility
The market driver for caramelized sugars is their ability to enhance flavors and provide versatility in food and beverage applications. Caramelized sugars add depth, richness, and complexity to a wide range of products such as baked goods, beverages, sauces, and confections. Their versatility allows manufacturers to create unique flavor profiles, driving the demand for caramelized sugars in the market.
Caramelized Sugars Market Opportunity: Expansion into Health-Conscious Products
An opportunity within the caramelized sugars market lies in their expansion into health-conscious products. With consumers becoming more health-aware, there is a growing demand for healthier sweetening options. Caramelized sugars can capitalize on this trend by offering low-sugar or sugar-free variants, organic options, and formulations suitable for clean label and natural product positioning. By aligning with health-conscious consumer preferences, caramelized sugars can tap into new market segments and diversify their product offerings.
Caramelized Sugars Market Share Analysis: Syrup Form segment generated the highest revenue share in the industry
The largest segment in the Caramelized Sugars Market by form is the Syrup category. Caramelized sugar syrup offers versatility and convenience in various culinary applications, making it a preferred choice among food manufacturers and chefs. Its liquid form allows for easy incorporation into a wide range of products, including beverages, desserts, confectioneries, sauces, and marinades. The syrup form of caramelized sugars provides a rich, caramel-like flavor profile along with a deep amber color, enhancing the taste and appearance of food products. This segment's dominance can be attributed to its widespread use in the food and beverage industry, where it serves as a natural sweetener, flavor enhancer, and coloring agent. With the growing demand for natural ingredients and authentic flavors in food products, the market for caramelized sugar syrup is expected to witness steady growth in the coming years, driven by its application versatility and consumer preference for indulgent, flavorful foods.
Caramelized Sugars Market Share Analysis: Beverages is the fastest growing segment over the forecast period to 2032
The fastest-growing segment in the Caramelized Sugars Market by end-user is beverages. This growth can be attributed to the increasing popularity of flavored beverages across the globe, including soft drinks, iced teas, coffees, cocktails, and energy drinks. Caramelized sugars add a unique and appealing flavor profile to these beverages, enhancing their taste and creating a rich, caramel-like sweetness that resonates with consumers. The trend towards natural ingredients and authentic flavors has also contributed to the rising demand for caramelized sugars in beverages, as they offer a natural and clean label solution for manufacturers. Furthermore, the versatility of caramelized sugars allows them to be used in a variety of beverage applications, from traditional carbonated drinks to innovative craft beverages, driving their adoption and fueling the growth of this segment in the market.
Caramelized Sugars Market Share Analysis: B2B segment generated the highest revenue share in the industry
The largest segment in the Caramelized Sugars Market by distribution channel is B2B (Business-to-Business). This segment comprises sales and distribution channels where caramelized sugars are primarily supplied to businesses, such as food manufacturers, beverage companies, confectionery producers, and bakery suppliers. The B2B model dominates the market due to several factors. Firstly, food and beverage companies often require bulk quantities of caramelized sugars for their production processes, making B2B channels the preferred choice for procurement. Further, B2B transactions involve long-term contracts and partnerships, ensuring a consistent and steady demand for caramelized sugars. Additionally, B2B channels offer customization options, technical support, and supply chain management services, catering to the specific needs of industrial clients. This level of service and convenience further strengthens the prominence of the B2B segment in the Caramelized Sugars Market, making it the largest and most influential distribution channel.
Caramelized Sugars Market Segmentation
By Form
Syrup
Powder
Liquid
By End-User
Bakery & Confectionery Products
Dairy Products
Meat & Meat Preparations
Beverages
Savory Dishes
Infant Food Products
Pet Food
By Distribution Channel
B2B
B2C
Countries Analyzed
North America (US, Canada, Mexico)
Europe (Germany, UK, France, Spain, Italy, Russia, Rest of Europe)
Asia Pacific (China, India, Japan, South Korea, Australia, South East Asia, Rest of Asia)
South America (Brazil, Argentina, Rest of South America)
Middle East and Africa (Saudi Arabia, UAE, Rest of Middle East, South Africa, Egypt, Rest of Africa)
Caramelized Sugars Companies Profiled in the Study
Cumberland Packing Corp
Florida Crystal
Great Value
Martin Mundo Enterprise Food Products
Royal Buisman
Secna Group LLC
Sethness-Roquette
TC Heartland
*- List Not Exhaustive
Chapter 1. TABLE OF CONTENTS
Chapter 2. Introduction to Caramelized Sugars Market
2.1. Market Overview
2.2. Key Statistics and Report Highlights
2.3. Scope of the Comprehensive Study
2.3.1. Market Definition
2.3.2 Countries and Regions Covered
2.3.3 Research Objective
2.3.4 Units, Currency, and Conversions
2.3.5 Industry Value Chain
2.4. Key Market Segments
2.5. Key Companies
2.6. Study Period
Chapter 3. Strategic Analysis Review
3.1. Caramelized Sugars Pricing Analysis and Forecast
3.2. Porter’s Five Forces
3.3. Market Ecosystem
3.4. SWOT Analysis
3.5. Regulatory Scenario
3.3. Effects of Inflation, Russia-Ukraine War, moderating economic growth, and other macroeconomic factors
Chapter 4. Competitive Landscape
4.1. Market Share Analysis
4.1.1. Global Caramelized Sugars Market Share by Company, 2023
4.1.2. Product Offerings of Leading Caramelized Sugars Companies
4.2. Market Entropy
4.2.1. New Product Launches in the Industry
4.2.2. Mergers, Acquisitions, Joint ventures, and Partnerships
4.3. Key Strategies and Best Practices
Chapter 5. Global Market Projections: Best, Reference, and Low Case Scenarios
5.1. Growth Analysis- Case Scenario Definitions
5.2. Low Growth Case Scenario Forecasts
5.3. Reference Growth Case Scenario Forecasts
5.4. High Growth Case Scenario Forecasts
Chapter 6. Market Dynamics
6.1. Caramelized Sugars Market Drivers
6.2. Caramelized Sugars Market Challenges
6.6. Caramelized Sugars Market Opportunities
6.4. Caramelized Sugars Market Trends
Chapter 7. Global Caramelized Sugars Market Outlook Trends
7.1. Global Caramelized Sugars Revenue (USD Million) and CAGR (%) by Type (2021-2032)
7.2. Global Caramelized Sugars Revenue (USD Million) and CAGR (%) by Application (2021-2032)
7.3. Global Caramelized Sugars Revenue (USD Million) and CAGR (%) by Product (2021-2032)
By Form
Syrup
Powder
Liquid
By End-User
Bakery & Confectionery Products
Dairy Products
Meat & Meat Preparations
Beverages
Savory Dishes
Infant Food Products
Pet Food
By Distribution Channel
B2B
B2C
Chapter 8. Global Caramelized Sugars Regional Analysis and Outlook
8.1. Global Caramelized Sugars Revenue (USD Million) By Regions (2021- 2032)
8.2. North America Caramelized Sugars Revenue (USD Million) by Country (2021-2032)
8.2.1. United States Caramelized Sugars Regional Analysis and Outlook
8.2.2. Canada Caramelized Sugars Regional Analysis and Outlook
8.2.3. Mexico Caramelized Sugars Regional Analysis and Outlook
8.3. Europe Caramelized Sugars Revenue (USD Million), by Country (2021-2032)
8.3.1. Germany Caramelized Sugars Regional Analysis and Outlook
8.3.2. France Caramelized Sugars Regional Analysis and Outlook
8.3.3. United Kingdom Caramelized Sugars Regional Analysis and Outlook
8.3.4. Spain Caramelized Sugars Regional Analysis and Outlook
8.3.5. Italy Caramelized Sugars Regional Analysis and Outlook
8.3.6. Russia Caramelized Sugars Regional Analysis and Outlook
8.3.7. Rest of Europe Caramelized Sugars Regional Analysis and Outlook
8.4. Asia Pacific Caramelized Sugars Revenue (USD Million) by Country (2021-2032)
8.4.1. China Caramelized Sugars Regional Analysis and Outlook
8.4.2. Japan Caramelized Sugars Regional Analysis and Outlook
8.4.3. India Caramelized Sugars Regional Analysis and Outlook
8.4.4. South Korea Caramelized Sugars Regional Analysis and Outlook
8.4.5. Australia Caramelized Sugars Regional Analysis and Outlook
8.4.6. South East Asia Caramelized Sugars Regional Analysis and Outlook
8.4.7. Rest of Asia Pacific Caramelized Sugars Regional Analysis and Outlook
8.5. South America Caramelized Sugars Revenue (USD Million), by Country (2021-2032)
8.5.1. Brazil Caramelized Sugars Regional Analysis and Outlook
8.5.2. Argentina Caramelized Sugars Regional Analysis and Outlook
8.5.3. Rest of South America Caramelized Sugars Regional Analysis and Outlook
8.6. Middle East and Africa Caramelized Sugars Revenue (USD Million) by Country (2021-2032)
8.6.1. Middle East Caramelized Sugars Regional Analysis and Outlook
8.6.2. Africa Caramelized Sugars Regional Analysis and Outlook
Chapter 9. North America Caramelized Sugars Analysis and Outlook
9.1. North America Caramelized Sugars Revenue (USD Million) by Segments (2021-2032)
9.1.1. North America Caramelized Sugars Revenue (USD Million) by Type (2021-2032)
9.1.2. North America Caramelized Sugars Revenue (USD Million) by Application (2021-2032)
9.1.3. North America Caramelized Sugars Revenue (USD Million) by Product (2021-2032)
By Form
Syrup
Powder
Liquid
By End-User
Bakery & Confectionery Products
Dairy Products
Meat & Meat Preparations
Beverages
Savory Dishes
Infant Food Products
Pet Food
By Distribution Channel
B2B
B2C
Chapter 10. Europe Caramelized Sugars Analysis and Outlook
10.1. Europe Caramelized Sugars Revenue (USD Million), by Segments (USD Million) (2021-2032)
10.1.1. Europe Caramelized Sugars Revenue (USD Million) by Type (2021-2032)
10.1.2. Europe Caramelized Sugars Revenue (USD Million) by Application (2021-2032)
10.1.3. Europe Caramelized Sugars Revenue (USD Million) by Product (2021-2032)
By Form
Syrup
Powder
Liquid
By End-User
Bakery & Confectionery Products
Dairy Products
Meat & Meat Preparations
Beverages
Savory Dishes
Infant Food Products
Pet Food
By Distribution Channel
B2B
B2C
Chapter 11. Asia Pacific Caramelized Sugars Analysis and Outlook
11.1. Asia Pacific Caramelized Sugars Revenue (USD Million), and Revenue (USD Million) by Segments (2021-2032)
11.1.1. Asia Pacific Caramelized Sugars Revenue (USD Million) by Type (2021-2032)
11.1.2. Asia Pacific Caramelized Sugars Revenue (USD Million) by Application (2021-2032)
11.1.3. Asia Pacific Caramelized Sugars Revenue (USD Million) by Product (2021-2032)
By Form
Syrup
Powder
Liquid
By End-User
Bakery & Confectionery Products
Dairy Products
Meat & Meat Preparations
Beverages
Savory Dishes
Infant Food Products
Pet Food
By Distribution Channel
B2B
B2C
Chapter 12. South America Caramelized Sugars Analysis and Outlook
12.1. South America Caramelized Sugars Revenue (USD Million), by Segments (2021-2032)
12.1.1. South America Caramelized Sugars Revenue (USD Million) by Type (2021-2032)
12.1.2. South America Caramelized Sugars Revenue (USD Million) by Application (2021-2032)
12.1.3. South America Caramelized Sugars Revenue (USD Million) by Product (2021-2032)
By Form
Syrup
Powder
Liquid
By End-User
Bakery & Confectionery Products
Dairy Products
Meat & Meat Preparations
Beverages
Savory Dishes
Infant Food Products
Pet Food
By Distribution Channel
B2B
B2C
Chapter 13. Middle East and Africa Caramelized Sugars Analysis and Outlook
13.1. Middle East and Africa Caramelized Sugars Revenue (USD Million), by Segments (2021-2032)
13.1.1. Middle East and Africa Caramelized Sugars Revenue (USD Million) by Type (2021-2032)
13.1.2. Middle East and Africa Caramelized Sugars Revenue (USD Million) by Application (2021-2032)
13.1.3. Middle East and Africa Caramelized Sugars Revenue (USD Million) by Product (2021-2032)
By Form
Syrup
Powder
Liquid
By End-User
Bakery & Confectionery Products
Dairy Products
Meat & Meat Preparations
Beverages
Savory Dishes
Infant Food Products
Pet Food
By Distribution Channel
B2B
B2C
Chapter 14. Caramelized Sugars Company Profiles
14.1 Business Overview
14.2 Product Profiles
14.3 SWOT Profiles
14.5 Recent Developments
14.6 Financial Profile
List of Companies
Cumberland Packing Corp
Florida Crystal
Great Value
Martin Mundo Enterprise Food Products
Royal Buisman
Secna Group LLC
Sethness-Roquette
TC Heartland
15. Methodology and Data Sources
15.1 Customization Offerings
15.2 Subscription Services
15.3 Related Reports
15.4 Publisher Expertise
LIST OF TABLES
Table 1 Market Segmentation Analysis
Table 2 Global Caramelized Sugars Market Share of Leading Companies, 2023
Table 3 Product Offerings of Leading Companies
Table 4 Low Growth Scenario Forecasts
Table 5 Reference Case Growth Scenario
Table 6 High Growth Case Scenario
Table 7 Global Caramelized Sugars Revenue (USD Million) And CAGR (%) By Type (2021-2032)
Table 8 Global Caramelized Sugars Revenue (USD Million) And CAGR (%) By Application (2021-2032)
Table 9 Global Caramelized Sugars Revenue (USD Million) And CAGR (%) By Product (2021-2032)
Table 10 Global Caramelized Sugars Market Revenue (USD Million) By Regions (2021-2032)
Table 11 Global Caramelized Sugars Market Share (%) By Regions (2021-2032)
Table 12 North America Caramelized Sugars Revenue (USD Million) By Country (2021-2032)
Table 13 Europe Caramelized Sugars Revenue (USD Million) By Country (2021-2032)
Table 14 Asia Pacific Caramelized Sugars Revenue (USD Million) By Country (2021-2032)
Table 15 South America Caramelized Sugars Revenue (USD Million) By Country (2021-2032)
Table 16 Middle East and Africa Caramelized Sugars Revenue (USD Million) By Region (2021-2032)
Table 17 North America Caramelized Sugars Revenue (USD Million) By Type (2021-2032)
Table 18 North America Caramelized Sugars Revenue (USD Million) By Application (2021-2032)
Table 19 North America Caramelized Sugars Revenue (USD Million) By Product (2021-2032)
Table 20 Europe Caramelized Sugars Revenue (USD Million) By Type (2021-2032)
Table 21 Europe Caramelized Sugars Revenue (USD Million) By Application (2021-2032)
Table 22 Europe Caramelized Sugars Revenue (USD Million) By Product (2021-2032)
Table 23 Asia Pacific Caramelized Sugars Revenue (USD Million) By Type (2021-2032)
Table 24 Asia Pacific Caramelized Sugars Revenue (USD Million) By Application (2021-2032)
Table 25 Asia Pacific Caramelized Sugars Revenue (USD Million) By Product (2021-2032)
Table 26 South America Caramelized Sugars Revenue (USD Million) By Type (2021-2032)
Table 27 South America Caramelized Sugars Revenue (USD Million) By Application (2021-2032)
Table 28 South America Caramelized Sugars Revenue (USD Million) By Product (2021-2032)
Table 29 Middle East and Africa Caramelized Sugars Revenue (USD Million) By Type (2021-2032)
Table 30 Middle East and Africa Caramelized Sugars Revenue (USD Million) By Application (2021-2032)
Table 31 Middle East and Africa Caramelized Sugars Revenue (USD Million) By Product (2021-2032)
LIST OF FIGURES
Figure 1. Market Scope
Figure 2. Pricing Forecasts Per Unit, 2023- 2032
Figure 3. Porter’s Five Forces
Figure 4. Global Caramelized Sugars Market Revenue (USD Million) By Regions (2021-2032)
Figure 5. Global Caramelized Sugars Market Share (%) By Regions (2023)
Figure 6. North America Caramelized Sugars Revenue (USD Million) By Country (2021-2032)
Figure 7. United States Caramelized Sugars Revenue (USD Million) By Country (2021-2032)
Figure 8. Canada Caramelized Sugars Revenue (USD Million) By Country (2021-2032)
Figure 9. Mexico Caramelized Sugars Revenue (USD Million) By Country (2021-2032)
Figure 10. Europe Caramelized Sugars Revenue (USD Million) By Country (2021-2032)
Figure 11. Germany Caramelized Sugars Revenue (USD Million) By Country (2021-2032)
Figure 12. France Caramelized Sugars Revenue (USD Million) By Country (2021-2032)
Figure 13. United Kingdom Caramelized Sugars Revenue (USD Million) By Country (2021-2032)
Figure 14. Spain Caramelized Sugars Revenue (USD Million) By Country (2021-2032)
Figure 15. Italy Caramelized Sugars Revenue (USD Million) By Country (2021-2032)
Figure 16. Russia Caramelized Sugars Revenue (USD Million) By Country (2021-2032)
Figure 17. Rest of Europe Caramelized Sugars Revenue (USD Million) By Country (2021-2032)
Figure 11. Asia Pacific Caramelized Sugars Revenue (USD Million) By Country (2021-2032)
Figure 12. China Caramelized Sugars Revenue (USD Million) By Country (2021-2032)
Figure 13. Japan Caramelized Sugars Revenue (USD Million) By Country (2021-2032)
Figure 14. India Caramelized Sugars Revenue (USD Million) By Country (2021-2032)
Figure 15. South Korea Caramelized Sugars Revenue (USD Million) By Country (2021-2032)
Figure 16. Australia Caramelized Sugars Revenue (USD Million) By Country (2021-2032)
Figure 17. South East Asia Caramelized Sugars Revenue (USD Million) By Country (2021-2032)
Figure 18. South America Caramelized Sugars Revenue (USD Million) By Country (2021-2032)
Figure 19. Brazil Caramelized Sugars Revenue (USD Million) By Country (2021-2032)
Figure 20. Argentina Caramelized Sugars Revenue (USD Million) By Country (2021-2032)
Figure 21. Rest of Asia Pacific Caramelized Sugars Revenue (USD Million) By Country (2021-2032)
Figure 22. Middle East and Africa Caramelized Sugars Revenue (USD Million) By Region (2021-2032)
Figure 23. Saudi Arabia Caramelized Sugars Revenue (USD Million) By Region (2021-2032)
Figure 24. The UAE Caramelized Sugars Revenue (USD Million) By Region (2021-2032)
Figure 25. Rest of Middle East Caramelized Sugars Revenue (USD Million) By Region (2021-2032)
Figure 26. South Africa Caramelized Sugars Revenue (USD Million) By Region (2021-2032)
Figure 27. Africa Caramelized Sugars Revenue (USD Million) By Region (2021-2032)
Figure 28. North America Caramelized Sugars Revenue (USD Million) By Type (2021-2032)
Figure 29. North America Caramelized Sugars Revenue (USD Million) By Application (2021-2032)
Figure 30. North America Caramelized Sugars Revenue (USD Million) By Product (2021-2032)
Figure 31. Europe Caramelized Sugars Revenue (USD Million) By Type (2021-2032)
Figure 32. Europe Caramelized Sugars Revenue (USD Million) By Application (2021-2032)
Figure 33. Europe Caramelized Sugars Revenue (USD Million) By Product (2021-2032)
Figure 34. Asia Pacific Caramelized Sugars Revenue (USD Million) By Type (2021-2032)
Figure 35. Asia Pacific Caramelized Sugars Revenue (USD Million) By Application (2021-2032)
Figure 36. Asia Pacific Caramelized Sugars Revenue (USD Million) By Product (2021-2032)
Figure 37. South America Caramelized Sugars Revenue (USD Million) By Type (2021-2032)
Figure 38. South America Caramelized Sugars Revenue (USD Million) By Application (2021-2032)
Figure 39. South America Caramelized Sugars Revenue (USD Million) By Product (2021-2032)
Figure 40. Middle East and Africa Caramelized Sugars Revenue (USD Million) By Type (2021-2032)
Figure 41. Middle East and Africa Caramelized Sugars Revenue (USD Million) By Application (2021-2032)
Figure 42. Middle East and Africa Caramelized Sugars Revenue (USD Million) By Product (2021-2032)
By Form
Syrup
Powder
Liquid
By End-User
Bakery & Confectionery Products
Dairy Products
Meat & Meat Preparations
Beverages
Savory Dishes
Infant Food Products
Pet Food
By Distribution Channel
B2B
B2C
Countries Analyzed
North America (US, Canada, Mexico)
Europe (Germany, UK, France, Spain, Italy, Russia, Rest of Europe)
Asia Pacific (China, India, Japan, South Korea, Australia, South East Asia, Rest of Asia)
South America (Brazil, Argentina, Rest of South America)
Middle East and Africa (Saudi Arabia, UAE, Rest of Middle East, South Africa, Egypt, Rest of Africa)
