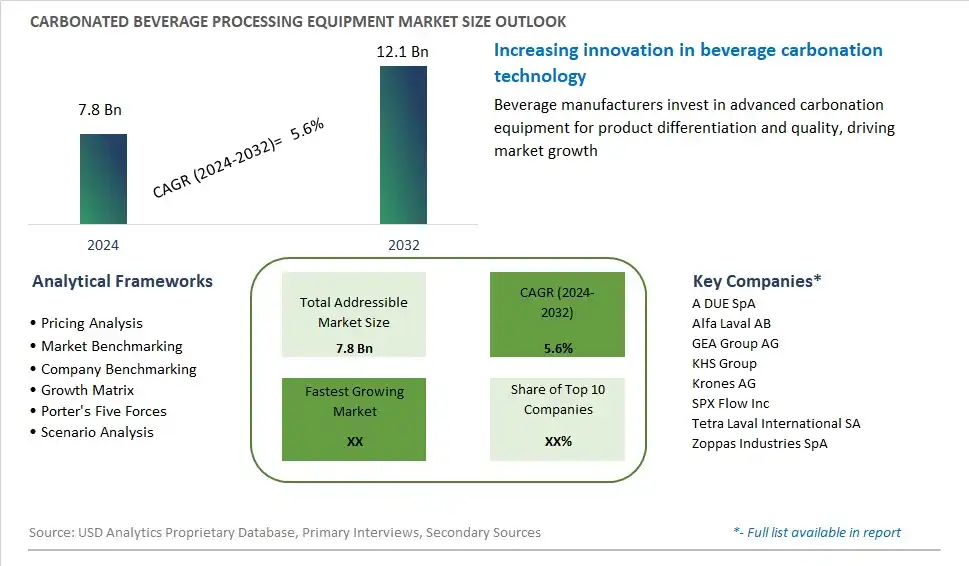
Global Carbonated Beverage Processing Equipment Market Size is valued at $7.8 Billion in 2024 and is forecast to register a growth rate (CAGR) of 5.6% to reach $12.1 Billion by 2032.
The global Carbonated Beverage Processing Equipment Market Comprehensive Study analyzes and forecasts the market size across 6 regions and 24 countries for diverse segments -By Equipment (Sugar Dissolvers, Carbonation Equipment, Blenders & Mixers, Heat Exchangers, Silos, Filtration Equipment), By Beverage (Flavored Drinks, Functional Drinks, Club Soda & Sparkling Water)
An Introduction to Carbonated Beverage Processing Equipment Market
Carbonated beverage processing equipment plays a vital role in the production of carbonated soft drinks, sparkling waters, and other effervescent beverages in 2024. These specialized machines and systems are designed to carbonate water, mix flavor concentrates, and fill bottles or cans with carbonated beverages at high speeds and with precision. With consumer demand for carbonated beverages continuing to rise, manufacturers rely on efficient and reliable processing equipment to meet production quotas, maintain product quality, and maximize profitability. From small-scale craft breweries to large-scale bottling plants, carbonated beverage processing equipment comes in various sizes and configurations to suit different production volumes and requirements. As technological advancements in automation, sanitation, and energy efficiency drive improvements in equipment design and performance, the market for carbonated beverage processing equipment is expected to grow, driven by investments in modernization and capacity expansion across the beverage industry.
Carbonated Beverage Processing Equipment Competitive Landscape
The market report analyses the leading companies in the industry including A DUE SpA, Alfa Laval AB, GEA Group AG, KHS Group, Krones AG, SPX Flow Inc, Tetra Laval International SA, Zoppas Industries SpA, and Others.
Carbonated Beverage Processing Equipment Market Dynamics
Carbonated Beverage Processing Equipment Market Trend: Shift Towards Healthier and Diversified Beverage Options
One prominent trend in the carbonated beverage processing equipment market is the shift towards healthier and diversified beverage options. As consumer preferences evolve towards healthier lifestyles and reduced sugar intake, there's a growing demand for carbonated beverages that offer lower sugar content, natural flavors, and functional ingredients. This trend is driven by increasing health consciousness, regulatory pressure to reduce sugar consumption, and changing perceptions of carbonated beverages as indulgent treats rather than daily staples. Manufacturers are responding by developing carbonated beverage processing equipment capable of producing a wide range of beverages, including sparkling water, flavored seltzers, functional drinks, and low-calorie sodas. Additionally, there's a growing interest in customization and personalization, with consumers seeking carbonation equipment that allows them to create custom flavors, adjust sweetness levels, and incorporate natural ingredients or additives to meet their specific tastes and dietary preferences. This trend presents opportunities for equipment manufacturers to innovate and diversify their product offerings to cater to the evolving needs and preferences of consumers in the carbonated beverage market.
Market Driver: Technological Advancements and Automation in Beverage Processing
A key driver propelling the growth of the carbonated beverage processing equipment market is technological advancements and automation in beverage processing systems. With increasing demand for efficiency, productivity, and consistency in beverage production, manufacturers are investing in advanced processing equipment that offers higher throughput, improved quality control, and greater flexibility in production processes. This driver is fueled by factors such as Industry 4.0 initiatives, IoT integration, and the adoption of smart manufacturing technologies in the food and beverage industry. Modern carbonated beverage processing equipment features automation, robotics, and digital controls that streamline production workflows, minimize downtime, and optimize resource utilization. Additionally, advancements in beverage packaging, filling, and sealing technologies enable manufacturers to achieve higher speeds, reduce product loss, and enhance product shelf life, improving overall operational efficiency and profitability. As beverage producers seek to stay competitive in a rapidly evolving market, there's a growing demand for innovative processing equipment that offers cutting-edge technology, scalability, and adaptability to meet changing consumer demands and market trends.
Market Opportunity: Sustainable and Eco-Friendly Beverage Processing Solutions
An opportunity within the carbonated beverage processing equipment market lies in the development of sustainable and eco-friendly processing solutions to address growing environmental concerns and regulatory pressures. With increasing awareness of climate change, resource scarcity, and plastic pollution, beverage producers are seeking equipment that minimizes environmental impact and supports sustainable production practices. This presents an opportunity for equipment manufacturers to innovate and offer carbonated beverage processing equipment that incorporates energy-efficient technologies, reduces water usage, and minimizes waste generation throughout the production process. Additionally, there's potential for equipment designs that facilitate recycling, reuse, and closed-loop systems, enabling beverage producers to minimize their carbon footprint and contribute to a more sustainable beverage industry. By providing sustainable processing solutions, equipment manufacturers can not only meet the growing demand for environmentally responsible production practices but also differentiate their offerings, enhance brand reputation, and capture market share in the rapidly expanding market for sustainable beverages.
Carbonated Beverage Processing Equipment Market Share Analysis: Carbonation Equipment held the dominant market share in 2024
In the Carbonated Beverage Processing Equipment Market segmented by equipment, the carbonation equipment segment is the largest, driven by pivotal factors shaping the carbonated beverage industry. Carbonation is a fundamental process in the production of carbonated beverages, imparting the characteristic fizziness and effervescence that consumers associate with these drinks. Carbonation equipment, including carbonators and carbonation tanks, play a central role in infusing carbon dioxide (CO2) into the beverage base to achieve desired levels of carbonation. As carbonated beverages remain immensely popular worldwide, the demand for carbonation equipment continues to soar, driven by both established and emerging markets. Further, the versatility of carbonation equipment allows for its application across a wide range of carbonated beverage categories, including sodas, sparkling waters, energy drinks, and alcoholic beverages, further driving its market dominance. Additionally, advancements in carbonation technology, such as inline carbonation systems and automated control systems, have enhanced the efficiency, accuracy, and consistency of carbonation processes, bolstering the appeal of carbonation equipment among beverage manufacturers. As a result, the carbonation equipment segment stands as the largest in the Carbonated Beverage Processing Equipment Market, poised for sustained growth as the demand for carbonated beverages continues to rise globally.
Carbonated Beverage Processing Equipment Market Share Analysis: Functional Drinks market is poised to register the fastest growth rae over the forecast period to 2032
In the Carbonated Beverage Processing Equipment Market segmented by beverage type, the functional drinks segment is the fastest-growing, driven by several transformative factors. Functional drinks, enriched with vitamins, minerals, herbs, and other bioactive ingredients, have gained popularity among consumers seeking beverages that offer health and wellness benefits beyond basic hydration. As functional beverages continue to carve out a significant share of the beverage market, the demand for carbonated beverage processing equipment tailored to meet the unique requirements of functional drink formulations has surged. Manufacturers are investing in specialized equipment capable of handling the precise dosing, blending, and carbonation of functional drink ingredients to ensure optimal nutrient retention and product efficacy. Further, the growing consumer awareness of health-conscious lifestyles and the increasing adoption of functional beverages as alternatives to traditional soft drinks have propelled the growth of this segment. Additionally, the versatility of carbonated beverage processing equipment allows for the production of a wide range of functional carbonated drinks, including energy drinks, sports drinks, and enhanced sparkling waters, further driving the demand for equipment solutions that can accommodate diverse formulations. As a result, the functional drinks segment stands as the fastest-growing in the Carbonated Beverage Processing Equipment Market, poised for continued expansion as consumers prioritize health and wellness in their beverage choices.
Carbonated Beverage Processing Equipment Market Segmentation
By Equipment
Sugar Dissolvers
Carbonation Equipment
Blenders & Mixers
Heat Exchangers
Silos
Filtration Equipment
By Beverage
Flavored Drinks
Functional Drinks
Club Soda & Sparkling Water
Countries Analyzed
North America (US, Canada, Mexico)
Europe (Germany, UK, France, Spain, Italy, Russia, Rest of Europe)
Asia Pacific (China, India, Japan, South Korea, Australia, South East Asia, Rest of Asia)
South America (Brazil, Argentina, Rest of South America)
Middle East and Africa (Saudi Arabia, UAE, Rest of Middle East, South Africa, Egypt, Rest of Africa)
Carbonated Beverage Processing Equipment Companies Profiled in the Study
A DUE SpA
Alfa Laval AB
GEA Group AG
KHS Group
Krones AG
SPX Flow Inc
Tetra Laval International SA
Zoppas Industries SpA
*- List Not Exhaustive
Chapter 1. TABLE OF CONTENTS
Chapter 2. Introduction to Carbonated Beverage Processing Equipment Market
2.1. Market Overview
2.2. Key Statistics and Report Highlights
2.3. Scope of the Comprehensive Study
2.3.1. Market Definition
2.3.2 Countries and Regions Covered
2.3.3 Research Objective
2.3.4 Units, Currency, and Conversions
2.3.5 Industry Value Chain
2.4. Key Market Segments
2.5. Key Companies
2.6. Study Period
Chapter 3. Strategic Analysis Review
3.1. Carbonated Beverage Processing Equipment Pricing Analysis and Forecast
3.2. Porter’s Five Forces
3.3. Market Ecosystem
3.4. SWOT Analysis
3.5. Regulatory Scenario
3.3. Effects of Inflation, Russia-Ukraine War, moderating economic growth, and other macroeconomic factors
Chapter 4. Competitive Landscape
4.1. Market Share Analysis
4.1.1. Global Carbonated Beverage Processing Equipment Market Share by Company, 2023
4.1.2. Product Offerings of Leading Carbonated Beverage Processing Equipment Companies
4.2. Market Entropy
4.2.1. New Product Launches in the Industry
4.2.2. Mergers, Acquisitions, Joint ventures, and Partnerships
4.3. Key Strategies and Best Practices
Chapter 5. Global Market Projections: Best, Reference, and Low Case Scenarios
5.1. Growth Analysis- Case Scenario Definitions
5.2. Low Growth Case Scenario Forecasts
5.3. Reference Growth Case Scenario Forecasts
5.4. High Growth Case Scenario Forecasts
Chapter 6. Market Dynamics
6.1. Carbonated Beverage Processing Equipment Market Drivers
6.2. Carbonated Beverage Processing Equipment Market Challenges
6.6. Carbonated Beverage Processing Equipment Market Opportunities
6.4. Carbonated Beverage Processing Equipment Market Trends
Chapter 7. Global Carbonated Beverage Processing Equipment Market Outlook Trends
7.1. Global Carbonated Beverage Processing Equipment Revenue (USD Million) and CAGR (%) by Type (2021-2032)
7.2. Global Carbonated Beverage Processing Equipment Revenue (USD Million) and CAGR (%) by Application (2021-2032)
7.3. Global Carbonated Beverage Processing Equipment Revenue (USD Million) and CAGR (%) by Product (2021-2032)
By Equipment
Sugar Dissolvers
Carbonation Equipment
Blenders & Mixers
Heat Exchangers
Silos
Filtration Equipment
By Beverage
Flavored Drinks
Functional Drinks
Club Soda & Sparkling Water
Chapter 8. Global Carbonated Beverage Processing Equipment Regional Analysis and Outlook
8.1. Global Carbonated Beverage Processing Equipment Revenue (USD Million) By Regions (2021- 2032)
8.2. North America Carbonated Beverage Processing Equipment Revenue (USD Million) by Country (2021-2032)
8.2.1. United States Carbonated Beverage Processing Equipment Regional Analysis and Outlook
8.2.2. Canada Carbonated Beverage Processing Equipment Regional Analysis and Outlook
8.2.3. Mexico Carbonated Beverage Processing Equipment Regional Analysis and Outlook
8.3. Europe Carbonated Beverage Processing Equipment Revenue (USD Million), by Country (2021-2032)
8.3.1. Germany Carbonated Beverage Processing Equipment Regional Analysis and Outlook
8.3.2. France Carbonated Beverage Processing Equipment Regional Analysis and Outlook
8.3.3. United Kingdom Carbonated Beverage Processing Equipment Regional Analysis and Outlook
8.3.4. Spain Carbonated Beverage Processing Equipment Regional Analysis and Outlook
8.3.5. Italy Carbonated Beverage Processing Equipment Regional Analysis and Outlook
8.3.6. Russia Carbonated Beverage Processing Equipment Regional Analysis and Outlook
8.3.7. Rest of Europe Carbonated Beverage Processing Equipment Regional Analysis and Outlook
8.4. Asia Pacific Carbonated Beverage Processing Equipment Revenue (USD Million) by Country (2021-2032)
8.4.1. China Carbonated Beverage Processing Equipment Regional Analysis and Outlook
8.4.2. Japan Carbonated Beverage Processing Equipment Regional Analysis and Outlook
8.4.3. India Carbonated Beverage Processing Equipment Regional Analysis and Outlook
8.4.4. South Korea Carbonated Beverage Processing Equipment Regional Analysis and Outlook
8.4.5. Australia Carbonated Beverage Processing Equipment Regional Analysis and Outlook
8.4.6. South East Asia Carbonated Beverage Processing Equipment Regional Analysis and Outlook
8.4.7. Rest of Asia Pacific Carbonated Beverage Processing Equipment Regional Analysis and Outlook
8.5. South America Carbonated Beverage Processing Equipment Revenue (USD Million), by Country (2021-2032)
8.5.1. Brazil Carbonated Beverage Processing Equipment Regional Analysis and Outlook
8.5.2. Argentina Carbonated Beverage Processing Equipment Regional Analysis and Outlook
8.5.3. Rest of South America Carbonated Beverage Processing Equipment Regional Analysis and Outlook
8.6. Middle East and Africa Carbonated Beverage Processing Equipment Revenue (USD Million) by Country (2021-2032)
8.6.1. Middle East Carbonated Beverage Processing Equipment Regional Analysis and Outlook
8.6.2. Africa Carbonated Beverage Processing Equipment Regional Analysis and Outlook
Chapter 9. North America Carbonated Beverage Processing Equipment Analysis and Outlook
9.1. North America Carbonated Beverage Processing Equipment Revenue (USD Million) by Segments (2021-2032)
9.1.1. North America Carbonated Beverage Processing Equipment Revenue (USD Million) by Type (2021-2032)
9.1.2. North America Carbonated Beverage Processing Equipment Revenue (USD Million) by Application (2021-2032)
9.1.3. North America Carbonated Beverage Processing Equipment Revenue (USD Million) by Product (2021-2032)
By Equipment
Sugar Dissolvers
Carbonation Equipment
Blenders & Mixers
Heat Exchangers
Silos
Filtration Equipment
By Beverage
Flavored Drinks
Functional Drinks
Club Soda & Sparkling Water
Chapter 10. Europe Carbonated Beverage Processing Equipment Analysis and Outlook
10.1. Europe Carbonated Beverage Processing Equipment Revenue (USD Million), by Segments (USD Million) (2021-2032)
10.1.1. Europe Carbonated Beverage Processing Equipment Revenue (USD Million) by Type (2021-2032)
10.1.2. Europe Carbonated Beverage Processing Equipment Revenue (USD Million) by Application (2021-2032)
10.1.3. Europe Carbonated Beverage Processing Equipment Revenue (USD Million) by Product (2021-2032)
By Equipment
Sugar Dissolvers
Carbonation Equipment
Blenders & Mixers
Heat Exchangers
Silos
Filtration Equipment
By Beverage
Flavored Drinks
Functional Drinks
Club Soda & Sparkling Water
Chapter 11. Asia Pacific Carbonated Beverage Processing Equipment Analysis and Outlook
11.1. Asia Pacific Carbonated Beverage Processing Equipment Revenue (USD Million), and Revenue (USD Million) by Segments (2021-2032)
11.1.1. Asia Pacific Carbonated Beverage Processing Equipment Revenue (USD Million) by Type (2021-2032)
11.1.2. Asia Pacific Carbonated Beverage Processing Equipment Revenue (USD Million) by Application (2021-2032)
11.1.3. Asia Pacific Carbonated Beverage Processing Equipment Revenue (USD Million) by Product (2021-2032)
By Equipment
Sugar Dissolvers
Carbonation Equipment
Blenders & Mixers
Heat Exchangers
Silos
Filtration Equipment
By Beverage
Flavored Drinks
Functional Drinks
Club Soda & Sparkling Water
Chapter 12. South America Carbonated Beverage Processing Equipment Analysis and Outlook
12.1. South America Carbonated Beverage Processing Equipment Revenue (USD Million), by Segments (2021-2032)
12.1.1. South America Carbonated Beverage Processing Equipment Revenue (USD Million) by Type (2021-2032)
12.1.2. South America Carbonated Beverage Processing Equipment Revenue (USD Million) by Application (2021-2032)
12.1.3. South America Carbonated Beverage Processing Equipment Revenue (USD Million) by Product (2021-2032)
By Equipment
Sugar Dissolvers
Carbonation Equipment
Blenders & Mixers
Heat Exchangers
Silos
Filtration Equipment
By Beverage
Flavored Drinks
Functional Drinks
Club Soda & Sparkling Water
Chapter 13. Middle East and Africa Carbonated Beverage Processing Equipment Analysis and Outlook
13.1. Middle East and Africa Carbonated Beverage Processing Equipment Revenue (USD Million), by Segments (2021-2032)
13.1.1. Middle East and Africa Carbonated Beverage Processing Equipment Revenue (USD Million) by Type (2021-2032)
13.1.2. Middle East and Africa Carbonated Beverage Processing Equipment Revenue (USD Million) by Application (2021-2032)
13.1.3. Middle East and Africa Carbonated Beverage Processing Equipment Revenue (USD Million) by Product (2021-2032)
By Equipment
Sugar Dissolvers
Carbonation Equipment
Blenders & Mixers
Heat Exchangers
Silos
Filtration Equipment
By Beverage
Flavored Drinks
Functional Drinks
Club Soda & Sparkling Water
Chapter 14. Carbonated Beverage Processing Equipment Company Profiles
14.1 Business Overview
14.2 Product Profiles
14.3 SWOT Profiles
14.5 Recent Developments
14.6 Financial Profile
List of Companies
A DUE SpA
Alfa Laval AB
GEA Group AG
KHS Group
Krones AG
SPX Flow Inc
Tetra Laval International SA
Zoppas Industries SpA
15. Methodology and Data Sources
15.1 Customization Offerings
15.2 Subscription Services
15.3 Related Reports
15.4 Publisher Expertise
LIST OF TABLES
Table 1 Market Segmentation Analysis
Table 2 Global Carbonated Beverage Processing Equipment Market Share of Leading Companies, 2023
Table 3 Product Offerings of Leading Companies
Table 4 Low Growth Scenario Forecasts
Table 5 Reference Case Growth Scenario
Table 6 High Growth Case Scenario
Table 7 Global Carbonated Beverage Processing Equipment Revenue (USD Million) And CAGR (%) By Type (2021-2032)
Table 8 Global Carbonated Beverage Processing Equipment Revenue (USD Million) And CAGR (%) By Application (2021-2032)
Table 9 Global Carbonated Beverage Processing Equipment Revenue (USD Million) And CAGR (%) By Product (2021-2032)
Table 10 Global Carbonated Beverage Processing Equipment Market Revenue (USD Million) By Regions (2021-2032)
Table 11 Global Carbonated Beverage Processing Equipment Market Share (%) By Regions (2021-2032)
Table 12 North America Carbonated Beverage Processing Equipment Revenue (USD Million) By Country (2021-2032)
Table 13 Europe Carbonated Beverage Processing Equipment Revenue (USD Million) By Country (2021-2032)
Table 14 Asia Pacific Carbonated Beverage Processing Equipment Revenue (USD Million) By Country (2021-2032)
Table 15 South America Carbonated Beverage Processing Equipment Revenue (USD Million) By Country (2021-2032)
Table 16 Middle East and Africa Carbonated Beverage Processing Equipment Revenue (USD Million) By Region (2021-2032)
Table 17 North America Carbonated Beverage Processing Equipment Revenue (USD Million) By Type (2021-2032)
Table 18 North America Carbonated Beverage Processing Equipment Revenue (USD Million) By Application (2021-2032)
Table 19 North America Carbonated Beverage Processing Equipment Revenue (USD Million) By Product (2021-2032)
Table 20 Europe Carbonated Beverage Processing Equipment Revenue (USD Million) By Type (2021-2032)
Table 21 Europe Carbonated Beverage Processing Equipment Revenue (USD Million) By Application (2021-2032)
Table 22 Europe Carbonated Beverage Processing Equipment Revenue (USD Million) By Product (2021-2032)
Table 23 Asia Pacific Carbonated Beverage Processing Equipment Revenue (USD Million) By Type (2021-2032)
Table 24 Asia Pacific Carbonated Beverage Processing Equipment Revenue (USD Million) By Application (2021-2032)
Table 25 Asia Pacific Carbonated Beverage Processing Equipment Revenue (USD Million) By Product (2021-2032)
Table 26 South America Carbonated Beverage Processing Equipment Revenue (USD Million) By Type (2021-2032)
Table 27 South America Carbonated Beverage Processing Equipment Revenue (USD Million) By Application (2021-2032)
Table 28 South America Carbonated Beverage Processing Equipment Revenue (USD Million) By Product (2021-2032)
Table 29 Middle East and Africa Carbonated Beverage Processing Equipment Revenue (USD Million) By Type (2021-2032)
Table 30 Middle East and Africa Carbonated Beverage Processing Equipment Revenue (USD Million) By Application (2021-2032)
Table 31 Middle East and Africa Carbonated Beverage Processing Equipment Revenue (USD Million) By Product (2021-2032)
LIST OF FIGURES
Figure 1. Market Scope
Figure 2. Pricing Forecasts Per Unit, 2023- 2032
Figure 3. Porter’s Five Forces
Figure 4. Global Carbonated Beverage Processing Equipment Market Revenue (USD Million) By Regions (2021-2032)
Figure 5. Global Carbonated Beverage Processing Equipment Market Share (%) By Regions (2023)
Figure 6. North America Carbonated Beverage Processing Equipment Revenue (USD Million) By Country (2021-2032)
Figure 7. United States Carbonated Beverage Processing Equipment Revenue (USD Million) By Country (2021-2032)
Figure 8. Canada Carbonated Beverage Processing Equipment Revenue (USD Million) By Country (2021-2032)
Figure 9. Mexico Carbonated Beverage Processing Equipment Revenue (USD Million) By Country (2021-2032)
Figure 10. Europe Carbonated Beverage Processing Equipment Revenue (USD Million) By Country (2021-2032)
Figure 11. Germany Carbonated Beverage Processing Equipment Revenue (USD Million) By Country (2021-2032)
Figure 12. France Carbonated Beverage Processing Equipment Revenue (USD Million) By Country (2021-2032)
Figure 13. United Kingdom Carbonated Beverage Processing Equipment Revenue (USD Million) By Country (2021-2032)
Figure 14. Spain Carbonated Beverage Processing Equipment Revenue (USD Million) By Country (2021-2032)
Figure 15. Italy Carbonated Beverage Processing Equipment Revenue (USD Million) By Country (2021-2032)
Figure 16. Russia Carbonated Beverage Processing Equipment Revenue (USD Million) By Country (2021-2032)
Figure 17. Rest of Europe Carbonated Beverage Processing Equipment Revenue (USD Million) By Country (2021-2032)
Figure 11. Asia Pacific Carbonated Beverage Processing Equipment Revenue (USD Million) By Country (2021-2032)
Figure 12. China Carbonated Beverage Processing Equipment Revenue (USD Million) By Country (2021-2032)
Figure 13. Japan Carbonated Beverage Processing Equipment Revenue (USD Million) By Country (2021-2032)
Figure 14. India Carbonated Beverage Processing Equipment Revenue (USD Million) By Country (2021-2032)
Figure 15. South Korea Carbonated Beverage Processing Equipment Revenue (USD Million) By Country (2021-2032)
Figure 16. Australia Carbonated Beverage Processing Equipment Revenue (USD Million) By Country (2021-2032)
Figure 17. South East Asia Carbonated Beverage Processing Equipment Revenue (USD Million) By Country (2021-2032)
Figure 18. South America Carbonated Beverage Processing Equipment Revenue (USD Million) By Country (2021-2032)
Figure 19. Brazil Carbonated Beverage Processing Equipment Revenue (USD Million) By Country (2021-2032)
Figure 20. Argentina Carbonated Beverage Processing Equipment Revenue (USD Million) By Country (2021-2032)
Figure 21. Rest of Asia Pacific Carbonated Beverage Processing Equipment Revenue (USD Million) By Country (2021-2032)
Figure 22. Middle East and Africa Carbonated Beverage Processing Equipment Revenue (USD Million) By Region (2021-2032)
Figure 23. Saudi Arabia Carbonated Beverage Processing Equipment Revenue (USD Million) By Region (2021-2032)
Figure 24. The UAE Carbonated Beverage Processing Equipment Revenue (USD Million) By Region (2021-2032)
Figure 25. Rest of Middle East Carbonated Beverage Processing Equipment Revenue (USD Million) By Region (2021-2032)
Figure 26. South Africa Carbonated Beverage Processing Equipment Revenue (USD Million) By Region (2021-2032)
Figure 27. Africa Carbonated Beverage Processing Equipment Revenue (USD Million) By Region (2021-2032)
Figure 28. North America Carbonated Beverage Processing Equipment Revenue (USD Million) By Type (2021-2032)
Figure 29. North America Carbonated Beverage Processing Equipment Revenue (USD Million) By Application (2021-2032)
Figure 30. North America Carbonated Beverage Processing Equipment Revenue (USD Million) By Product (2021-2032)
Figure 31. Europe Carbonated Beverage Processing Equipment Revenue (USD Million) By Type (2021-2032)
Figure 32. Europe Carbonated Beverage Processing Equipment Revenue (USD Million) By Application (2021-2032)
Figure 33. Europe Carbonated Beverage Processing Equipment Revenue (USD Million) By Product (2021-2032)
Figure 34. Asia Pacific Carbonated Beverage Processing Equipment Revenue (USD Million) By Type (2021-2032)
Figure 35. Asia Pacific Carbonated Beverage Processing Equipment Revenue (USD Million) By Application (2021-2032)
Figure 36. Asia Pacific Carbonated Beverage Processing Equipment Revenue (USD Million) By Product (2021-2032)
Figure 37. South America Carbonated Beverage Processing Equipment Revenue (USD Million) By Type (2021-2032)
Figure 38. South America Carbonated Beverage Processing Equipment Revenue (USD Million) By Application (2021-2032)
Figure 39. South America Carbonated Beverage Processing Equipment Revenue (USD Million) By Product (2021-2032)
Figure 40. Middle East and Africa Carbonated Beverage Processing Equipment Revenue (USD Million) By Type (2021-2032)
Figure 41. Middle East and Africa Carbonated Beverage Processing Equipment Revenue (USD Million) By Application (2021-2032)
Figure 42. Middle East and Africa Carbonated Beverage Processing Equipment Revenue (USD Million) By Product (2021-2032)
By Equipment
Sugar Dissolvers
Carbonation Equipment
Blenders & Mixers
Heat Exchangers
Silos
Filtration Equipment
By Beverage
Flavored Drinks
Functional Drinks
Club Soda & Sparkling Water
Countries Analyzed
North America (US, Canada, Mexico)
Europe (Germany, UK, France, Spain, Italy, Russia, Rest of Europe)
Asia Pacific (China, India, Japan, South Korea, Australia, South East Asia, Rest of Asia)
South America (Brazil, Argentina, Rest of South America)
Middle East and Africa (Saudi Arabia, UAE, Rest of Middle East, South Africa, Egypt, Rest of Africa)
