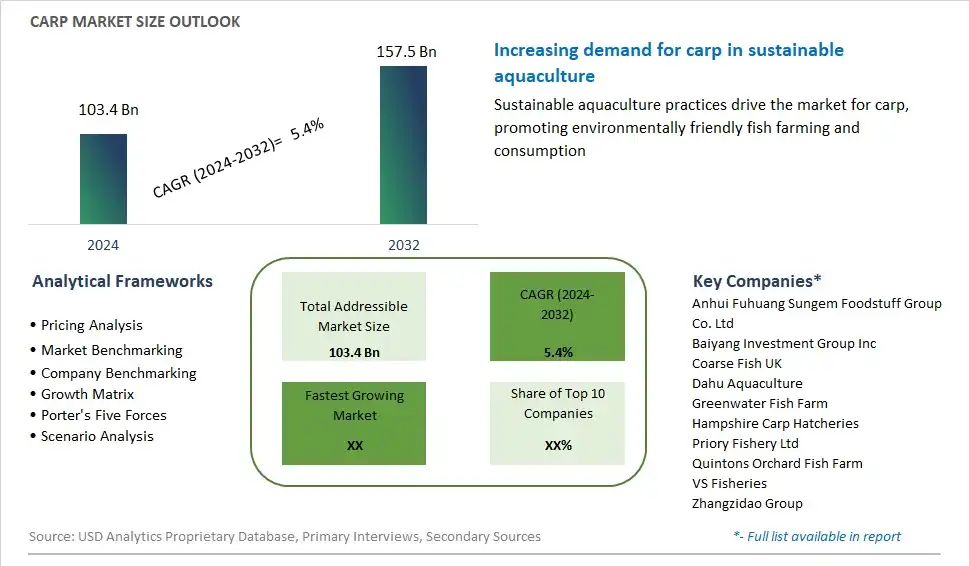
Global Carp Market Size is valued at $103.4 Billion in 2024 and is forecast to register a growth rate (CAGR) of 5.4% to reach $157.5 Billion by 2032.
The global Carp Market Comprehensive Study analyzes and forecasts the market size across 6 regions and 24 countries for diverse segments -By Species (Grass, Silver, Common, Bighead, Catla, Others), By Form (Frozen, Canned), By Distribution Channel (Hypermarkets/Supermarkets, Convenience Store, Online, Others)
An Introduction to Carp Market
The carp market in 2024 is expanding, driven by its reputation as a sustainable and nutritious source of protein. Carp, a freshwater fish, is widely farmed due to its ability to thrive in various aquatic environments and its rapid growth rate. This market benefits from the increasing global demand for affordable and environmentally friendly seafood options. Carp is rich in omega-3 fatty acids, vitamins, and minerals, making it an attractive choice for health-conscious consumers. Efforts to promote carp consumption are also supported by the development of new culinary techniques and recipes that enhance its flavor and texture, appealing to a broader range of palates. Additionally, the aquaculture industry's focus on sustainable practices and efficient production methods is helping to boost the popularity of carp in the global seafood market.
Carp Competitive Landscape
The market report analyses the leading companies in the industry including Anhui Fuhuang Sungem Foodstuff Group Co. Ltd, Baiyang Investment Group Inc, Coarse Fish UK, Dahu Aquaculture, Greenwater Fish Farm, Hampshire Carp Hatcheries, Priory Fishery Ltd, Quintons Orchard Fish Farm, VS Fisheries, Zhangzidao Group, and Others.
Carp Market Dynamics
Carp Market Trend: Growing Interest in Sustainable and Ethical Aquaculture Practices
One of the most prominent trends in the carp market is the growing interest in sustainable and ethical aquaculture practices. As concerns about overfishing and environmental degradation mount, consumers and businesses alike are seeking seafood products that are sourced responsibly and support sustainable fisheries management. Carp, a freshwater fish species known for its resilience and fast growth rate, presents opportunities for sustainable aquaculture production. By implementing practices such as pond culture, integrated aquaculture systems, and responsible feed management, carp farmers can minimize environmental impact, conserve natural resources, and ensure the long-term viability of carp populations. This trend is driven by a desire to protect aquatic ecosystems, support local economies, and meet the increasing demand for sustainably sourced seafood products.
Market Driver: Growing Demand for Affordable and Nutritious Protein Sources
The primary driver of the carp market is the growing demand for affordable and nutritious protein sources. Carp is a highly nutritious fish species, rich in protein, omega-3 fatty acids, vitamins, and minerals, making it an attractive option for consumers seeking healthy and affordable protein alternatives. As global populations continue to grow, there is increasing pressure to meet the demand for protein-rich foods in a sustainable and cost-effective manner. Carp farming offers advantages in terms of efficiency, scalability, and affordability, providing a reliable source of protein that can help address food security challenges. Additionally, carp's versatility in culinary applications, from whole fish to fillets, smoked products, and surimi, enhances its appeal among consumers looking for diverse and nutritious meal options.
Market Opportunity: Expansion into Niche Markets and Value-Added Products
A significant opportunity for the carp market lies in expansion into niche markets and value-added products. While carp is a staple food in many regions, there is potential to tap into new consumer demographics and market segments by diversifying product offerings and targeting niche market niches. This can include introducing value-added carp products such as smoked carp, carp jerky, carp burgers, or carp-based snacks, catering to consumer preferences for convenience, flavor innovation, and protein-rich snacks. Additionally, targeting niche markets such as health-conscious consumers, ethnic communities, or culinary enthusiasts interested in sustainable seafood options can create new revenue streams and drive market growth. By leveraging carp's nutritional benefits, affordability, and versatility in product development, businesses can capitalize on emerging market trends and differentiate themselves in a competitive seafood landscape. Moreover, investing in marketing efforts to educate consumers about the nutritional value, culinary versatility, and sustainability of carp products can help increase consumer awareness and drive demand for carp-based products in both traditional and niche markets.
Carp Market Share Analysis: Common Carp held the dominant market share in 2024
The Common Carp is the largest segment in the carp market due to its widespread distribution, popularity among consumers, and versatile culinary applications. Common carp, known for its mild flavor and firm texture, is one of the most widely consumed freshwater fish species globally. It is prized for its availability year-round and affordability, making it a staple protein source in many cuisines worldwide. Common carp can be prepared in various ways, including grilling, frying, baking, and steaming, catering to diverse culinary preferences and cultural traditions. Further, its adaptability to different aquatic environments and relatively fast growth rate contribute to its prominence in commercial aquaculture and wild fisheries. As consumers continue to seek out nutritious and sustainable seafood options, the Common Carp segment in the carp market maintains its dominance, meeting the demand for affordable, flavorful, and readily available freshwater fish.
Carp Market Share Analysis: Canned market is poised to register the fastest growth rae over the forecast period to 2032
The Canned segment is the fastest-growing in the carp market, driven by the increasing demand for convenient and shelf-stable seafood products among consumers. Canned carp offers several advantages, including extended shelf life, ease of storage, and convenience in preparation, making it an attractive option for consumers seeking quick and hassle-free meal solutions. Additionally, canned carp provides a versatile ingredient for a variety of recipes, including salads, sandwiches, and pasta dishes, enhancing its appeal to busy households and foodservice establishments. Further, the rising popularity of canned seafood as a sustainable and affordable protein source further fuels the growth of the Canned segment in the carp market. As consumers continue to prioritize convenience and sustainability in their food choices, the Canned segment is expected to experience sustained growth, presenting opportunities for manufacturers and retailers to capitalize on the increasing demand for canned carp products.
Carp Market Share Analysis: Hypermarkets/Supermarkets held the dominant market share in 2024
The Hypermarkets/Supermarkets segment is the largest in the carp market due to its extensive reach, wide product assortment, and consumer convenience. Hypermarkets and supermarkets offer a one-stop shopping experience for consumers, providing a diverse selection of fresh and frozen seafood, including carp, alongside other grocery items. These large-scale retail outlets often feature dedicated seafood sections with a variety of fish species, catering to the diverse preferences of consumers. Additionally, hypermarkets and supermarkets leverage their economies of scale to offer competitive prices and promotional discounts, attracting budget-conscious shoppers. The convenience of purchasing carp along with other household essentials in a single location contributes to the dominance of the Hypermarkets/Supermarkets segment in the carp market. As consumer preferences continue to evolve, hypermarkets and supermarkets are expected to maintain their leading position by adapting their offerings to meet the changing demands of seafood consumers.
Carp Market Segmentation
By Species
Grass
Silver
Common
Bighead
Catla
Others
By Form
Frozen
Canned
By Distribution Channel
Hypermarkets/Supermarkets
Convenience Store
Online
Others
Countries Analyzed
North America (US, Canada, Mexico)
Europe (Germany, UK, France, Spain, Italy, Russia, Rest of Europe)
Asia Pacific (China, India, Japan, South Korea, Australia, South East Asia, Rest of Asia)
South America (Brazil, Argentina, Rest of South America)
Middle East and Africa (Saudi Arabia, UAE, Rest of Middle East, South Africa, Egypt, Rest of Africa)
Carp Companies Profiled in the Study
Anhui Fuhuang Sungem Foodstuff Group Co. Ltd
Baiyang Investment Group Inc
Coarse Fish UK
Dahu Aquaculture
Greenwater Fish Farm
Hampshire Carp Hatcheries
Priory Fishery Ltd
Quintons Orchard Fish Farm
VS Fisheries
Zhangzidao Group
*- List Not Exhaustive
Chapter 1. TABLE OF CONTENTS
Chapter 2. Introduction to Carp Market
2.1. Market Overview
2.2. Key Statistics and Report Highlights
2.3. Scope of the Comprehensive Study
2.3.1. Market Definition
2.3.2 Countries and Regions Covered
2.3.3 Research Objective
2.3.4 Units, Currency, and Conversions
2.3.5 Industry Value Chain
2.4. Key Market Segments
2.5. Key Companies
2.6. Study Period
Chapter 3. Strategic Analysis Review
3.1. Carp Pricing Analysis and Forecast
3.2. Porter’s Five Forces
3.3. Market Ecosystem
3.4. SWOT Analysis
3.5. Regulatory Scenario
3.3. Effects of Inflation, Russia-Ukraine War, moderating economic growth, and other macroeconomic factors
Chapter 4. Competitive Landscape
4.1. Market Share Analysis
4.1.1. Global Carp Market Share by Company, 2023
4.1.2. Product Offerings of Leading Carp Companies
4.2. Market Entropy
4.2.1. New Product Launches in the Industry
4.2.2. Mergers, Acquisitions, Joint ventures, and Partnerships
4.3. Key Strategies and Best Practices
Chapter 5. Global Market Projections: Best, Reference, and Low Case Scenarios
5.1. Growth Analysis- Case Scenario Definitions
5.2. Low Growth Case Scenario Forecasts
5.3. Reference Growth Case Scenario Forecasts
5.4. High Growth Case Scenario Forecasts
Chapter 6. Market Dynamics
6.1. Carp Market Drivers
6.2. Carp Market Challenges
6.6. Carp Market Opportunities
6.4. Carp Market Trends
Chapter 7. Global Carp Market Outlook Trends
7.1. Global Carp Revenue (USD Million) and CAGR (%) by Type (2021-2032)
7.2. Global Carp Revenue (USD Million) and CAGR (%) by Application (2021-2032)
7.3. Global Carp Revenue (USD Million) and CAGR (%) by Product (2021-2032)
By Species
Grass
Silver
Common
Bighead
Catla
Others
By Form
Frozen
Canned
By Distribution Channel
Hypermarkets/Supermarkets
Convenience Store
Online
Others
Chapter 8. Global Carp Regional Analysis and Outlook
8.1. Global Carp Revenue (USD Million) By Regions (2021- 2032)
8.2. North America Carp Revenue (USD Million) by Country (2021-2032)
8.2.1. United States Carp Regional Analysis and Outlook
8.2.2. Canada Carp Regional Analysis and Outlook
8.2.3. Mexico Carp Regional Analysis and Outlook
8.3. Europe Carp Revenue (USD Million), by Country (2021-2032)
8.3.1. Germany Carp Regional Analysis and Outlook
8.3.2. France Carp Regional Analysis and Outlook
8.3.3. United Kingdom Carp Regional Analysis and Outlook
8.3.4. Spain Carp Regional Analysis and Outlook
8.3.5. Italy Carp Regional Analysis and Outlook
8.3.6. Russia Carp Regional Analysis and Outlook
8.3.7. Rest of Europe Carp Regional Analysis and Outlook
8.4. Asia Pacific Carp Revenue (USD Million) by Country (2021-2032)
8.4.1. China Carp Regional Analysis and Outlook
8.4.2. Japan Carp Regional Analysis and Outlook
8.4.3. India Carp Regional Analysis and Outlook
8.4.4. South Korea Carp Regional Analysis and Outlook
8.4.5. Australia Carp Regional Analysis and Outlook
8.4.6. South East Asia Carp Regional Analysis and Outlook
8.4.7. Rest of Asia Pacific Carp Regional Analysis and Outlook
8.5. South America Carp Revenue (USD Million), by Country (2021-2032)
8.5.1. Brazil Carp Regional Analysis and Outlook
8.5.2. Argentina Carp Regional Analysis and Outlook
8.5.3. Rest of South America Carp Regional Analysis and Outlook
8.6. Middle East and Africa Carp Revenue (USD Million) by Country (2021-2032)
8.6.1. Middle East Carp Regional Analysis and Outlook
8.6.2. Africa Carp Regional Analysis and Outlook
Chapter 9. North America Carp Analysis and Outlook
9.1. North America Carp Revenue (USD Million) by Segments (2021-2032)
9.1.1. North America Carp Revenue (USD Million) by Type (2021-2032)
9.1.2. North America Carp Revenue (USD Million) by Application (2021-2032)
9.1.3. North America Carp Revenue (USD Million) by Product (2021-2032)
By Species
Grass
Silver
Common
Bighead
Catla
Others
By Form
Frozen
Canned
By Distribution Channel
Hypermarkets/Supermarkets
Convenience Store
Online
Others
Chapter 10. Europe Carp Analysis and Outlook
10.1. Europe Carp Revenue (USD Million), by Segments (USD Million) (2021-2032)
10.1.1. Europe Carp Revenue (USD Million) by Type (2021-2032)
10.1.2. Europe Carp Revenue (USD Million) by Application (2021-2032)
10.1.3. Europe Carp Revenue (USD Million) by Product (2021-2032)
By Species
Grass
Silver
Common
Bighead
Catla
Others
By Form
Frozen
Canned
By Distribution Channel
Hypermarkets/Supermarkets
Convenience Store
Online
Others
Chapter 11. Asia Pacific Carp Analysis and Outlook
11.1. Asia Pacific Carp Revenue (USD Million), and Revenue (USD Million) by Segments (2021-2032)
11.1.1. Asia Pacific Carp Revenue (USD Million) by Type (2021-2032)
11.1.2. Asia Pacific Carp Revenue (USD Million) by Application (2021-2032)
11.1.3. Asia Pacific Carp Revenue (USD Million) by Product (2021-2032)
By Species
Grass
Silver
Common
Bighead
Catla
Others
By Form
Frozen
Canned
By Distribution Channel
Hypermarkets/Supermarkets
Convenience Store
Online
Others
Chapter 12. South America Carp Analysis and Outlook
12.1. South America Carp Revenue (USD Million), by Segments (2021-2032)
12.1.1. South America Carp Revenue (USD Million) by Type (2021-2032)
12.1.2. South America Carp Revenue (USD Million) by Application (2021-2032)
12.1.3. South America Carp Revenue (USD Million) by Product (2021-2032)
By Species
Grass
Silver
Common
Bighead
Catla
Others
By Form
Frozen
Canned
By Distribution Channel
Hypermarkets/Supermarkets
Convenience Store
Online
Others
Chapter 13. Middle East and Africa Carp Analysis and Outlook
13.1. Middle East and Africa Carp Revenue (USD Million), by Segments (2021-2032)
13.1.1. Middle East and Africa Carp Revenue (USD Million) by Type (2021-2032)
13.1.2. Middle East and Africa Carp Revenue (USD Million) by Application (2021-2032)
13.1.3. Middle East and Africa Carp Revenue (USD Million) by Product (2021-2032)
By Species
Grass
Silver
Common
Bighead
Catla
Others
By Form
Frozen
Canned
By Distribution Channel
Hypermarkets/Supermarkets
Convenience Store
Online
Others
Chapter 14. Carp Company Profiles
14.1 Business Overview
14.2 Product Profiles
14.3 SWOT Profiles
14.5 Recent Developments
14.6 Financial Profile
List of Companies
Anhui Fuhuang Sungem Foodstuff Group Co. Ltd
Baiyang Investment Group Inc
Coarse Fish UK
Dahu Aquaculture
Greenwater Fish Farm
Hampshire Carp Hatcheries
Priory Fishery Ltd
Quintons Orchard Fish Farm
VS Fisheries
Zhangzidao Group
15. Methodology and Data Sources
15.1 Customization Offerings
15.2 Subscription Services
15.3 Related Reports
15.4 Publisher Expertise
LIST OF TABLES
Table 1 Market Segmentation Analysis
Table 2 Global Carp Market Share of Leading Companies, 2023
Table 3 Product Offerings of Leading Companies
Table 4 Low Growth Scenario Forecasts
Table 5 Reference Case Growth Scenario
Table 6 High Growth Case Scenario
Table 7 Global Carp Revenue (USD Million) And CAGR (%) By Type (2021-2032)
Table 8 Global Carp Revenue (USD Million) And CAGR (%) By Application (2021-2032)
Table 9 Global Carp Revenue (USD Million) And CAGR (%) By Product (2021-2032)
Table 10 Global Carp Market Revenue (USD Million) By Regions (2021-2032)
Table 11 Global Carp Market Share (%) By Regions (2021-2032)
Table 12 North America Carp Revenue (USD Million) By Country (2021-2032)
Table 13 Europe Carp Revenue (USD Million) By Country (2021-2032)
Table 14 Asia Pacific Carp Revenue (USD Million) By Country (2021-2032)
Table 15 South America Carp Revenue (USD Million) By Country (2021-2032)
Table 16 Middle East and Africa Carp Revenue (USD Million) By Region (2021-2032)
Table 17 North America Carp Revenue (USD Million) By Type (2021-2032)
Table 18 North America Carp Revenue (USD Million) By Application (2021-2032)
Table 19 North America Carp Revenue (USD Million) By Product (2021-2032)
Table 20 Europe Carp Revenue (USD Million) By Type (2021-2032)
Table 21 Europe Carp Revenue (USD Million) By Application (2021-2032)
Table 22 Europe Carp Revenue (USD Million) By Product (2021-2032)
Table 23 Asia Pacific Carp Revenue (USD Million) By Type (2021-2032)
Table 24 Asia Pacific Carp Revenue (USD Million) By Application (2021-2032)
Table 25 Asia Pacific Carp Revenue (USD Million) By Product (2021-2032)
Table 26 South America Carp Revenue (USD Million) By Type (2021-2032)
Table 27 South America Carp Revenue (USD Million) By Application (2021-2032)
Table 28 South America Carp Revenue (USD Million) By Product (2021-2032)
Table 29 Middle East and Africa Carp Revenue (USD Million) By Type (2021-2032)
Table 30 Middle East and Africa Carp Revenue (USD Million) By Application (2021-2032)
Table 31 Middle East and Africa Carp Revenue (USD Million) By Product (2021-2032)
LIST OF FIGURES
Figure 1. Market Scope
Figure 2. Pricing Forecasts Per Unit, 2023- 2032
Figure 3. Porter’s Five Forces
Figure 4. Global Carp Market Revenue (USD Million) By Regions (2021-2032)
Figure 5. Global Carp Market Share (%) By Regions (2023)
Figure 6. North America Carp Revenue (USD Million) By Country (2021-2032)
Figure 7. United States Carp Revenue (USD Million) By Country (2021-2032)
Figure 8. Canada Carp Revenue (USD Million) By Country (2021-2032)
Figure 9. Mexico Carp Revenue (USD Million) By Country (2021-2032)
Figure 10. Europe Carp Revenue (USD Million) By Country (2021-2032)
Figure 11. Germany Carp Revenue (USD Million) By Country (2021-2032)
Figure 12. France Carp Revenue (USD Million) By Country (2021-2032)
Figure 13. United Kingdom Carp Revenue (USD Million) By Country (2021-2032)
Figure 14. Spain Carp Revenue (USD Million) By Country (2021-2032)
Figure 15. Italy Carp Revenue (USD Million) By Country (2021-2032)
Figure 16. Russia Carp Revenue (USD Million) By Country (2021-2032)
Figure 17. Rest of Europe Carp Revenue (USD Million) By Country (2021-2032)
Figure 11. Asia Pacific Carp Revenue (USD Million) By Country (2021-2032)
Figure 12. China Carp Revenue (USD Million) By Country (2021-2032)
Figure 13. Japan Carp Revenue (USD Million) By Country (2021-2032)
Figure 14. India Carp Revenue (USD Million) By Country (2021-2032)
Figure 15. South Korea Carp Revenue (USD Million) By Country (2021-2032)
Figure 16. Australia Carp Revenue (USD Million) By Country (2021-2032)
Figure 17. South East Asia Carp Revenue (USD Million) By Country (2021-2032)
Figure 18. South America Carp Revenue (USD Million) By Country (2021-2032)
Figure 19. Brazil Carp Revenue (USD Million) By Country (2021-2032)
Figure 20. Argentina Carp Revenue (USD Million) By Country (2021-2032)
Figure 21. Rest of Asia Pacific Carp Revenue (USD Million) By Country (2021-2032)
Figure 22. Middle East and Africa Carp Revenue (USD Million) By Region (2021-2032)
Figure 23. Saudi Arabia Carp Revenue (USD Million) By Region (2021-2032)
Figure 24. The UAE Carp Revenue (USD Million) By Region (2021-2032)
Figure 25. Rest of Middle East Carp Revenue (USD Million) By Region (2021-2032)
Figure 26. South Africa Carp Revenue (USD Million) By Region (2021-2032)
Figure 27. Africa Carp Revenue (USD Million) By Region (2021-2032)
Figure 28. North America Carp Revenue (USD Million) By Type (2021-2032)
Figure 29. North America Carp Revenue (USD Million) By Application (2021-2032)
Figure 30. North America Carp Revenue (USD Million) By Product (2021-2032)
Figure 31. Europe Carp Revenue (USD Million) By Type (2021-2032)
Figure 32. Europe Carp Revenue (USD Million) By Application (2021-2032)
Figure 33. Europe Carp Revenue (USD Million) By Product (2021-2032)
Figure 34. Asia Pacific Carp Revenue (USD Million) By Type (2021-2032)
Figure 35. Asia Pacific Carp Revenue (USD Million) By Application (2021-2032)
Figure 36. Asia Pacific Carp Revenue (USD Million) By Product (2021-2032)
Figure 37. South America Carp Revenue (USD Million) By Type (2021-2032)
Figure 38. South America Carp Revenue (USD Million) By Application (2021-2032)
Figure 39. South America Carp Revenue (USD Million) By Product (2021-2032)
Figure 40. Middle East and Africa Carp Revenue (USD Million) By Type (2021-2032)
Figure 41. Middle East and Africa Carp Revenue (USD Million) By Application (2021-2032)
Figure 42. Middle East and Africa Carp Revenue (USD Million) By Product (2021-2032)
By Species
Grass
Silver
Common
Bighead
Catla
Others
By Form
Frozen
Canned
By Distribution Channel
Hypermarkets/Supermarkets
Convenience Store
Online
Others
Countries Analyzed
North America (US, Canada, Mexico)
Europe (Germany, UK, France, Spain, Italy, Russia, Rest of Europe)
Asia Pacific (China, India, Japan, South Korea, Australia, South East Asia, Rest of Asia)
South America (Brazil, Argentina, Rest of South America)
Middle East and Africa (Saudi Arabia, UAE, Rest of Middle East, South Africa, Egypt, Rest of Africa)
