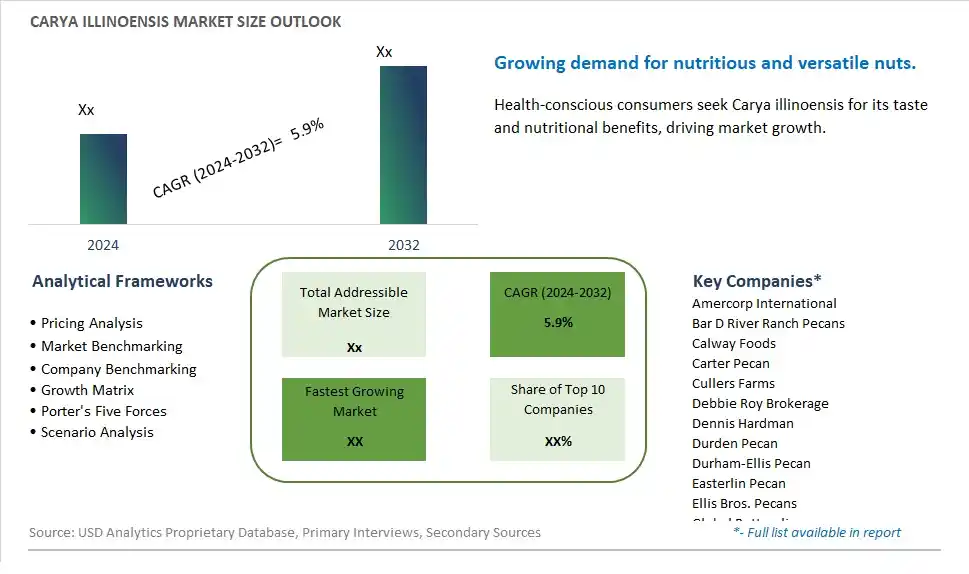
Global Carya Illinoensis Market Size is valued at $XX Million in 2024 and is forecast to register a growth rate (CAGR) of 5.9% to reach $XX Million by 2032.
The global Carya Illinoensis Market Comprehensive Study analyzes and forecasts the market size across 6 regions and 24 countries for diverse segments -By Type (In-shell Pecans, Shelled Pecans), By Application (Direct Consumption, Confectionery & Bakery, Others)
An Introduction to Carya Illinoensis Market
In 2024, the Carya Illinoensis market is witnessing robust growth, driven by the increasing demand for pecans in the food and snack industries. Carya illinoensis, commonly known as pecan, is valued for its rich, buttery flavor and high nutritional content, including healthy fats, vitamins, and minerals. The market is supported by the growing trend towards healthy snacking and the use of nuts in a variety of culinary applications. Advances in agricultural practices and post-harvest technologies are enhancing the quality, yield, and availability of pecans. The market is also benefiting from the trend towards clean-label and minimally processed products, appealing to health-conscious consumers seeking nutritious and flavorful snack options.
Carya Illinoensis Competitive Landscape
The market report analyses the leading companies in the industry including Amercorp International, Bar D River Ranch Pecans, Calway Foods, Carter Pecan, Cullers Farms, Debbie Roy Brokerage, Dennis Hardman, Durden Pecan, Durham-Ellis Pecan, Easterlin Pecan, Ellis Bros. Pecans, Global Bottomline, Hudson Pecan, John B. Sanfilippo & Son, Lamar Pecan, Lane Southern Orchards, Merritt Pecan, Montz Pecans, Navarro Pecan, Nut Tree Pecan, Royalty Pecan Farms, San Saba Pecan, Shamrock Ranch, South Georgia Pecan, The Alabama Pecan, The Green Valley Pecan, Tularosa Pecan, U.S.Pecans, Whaley Pecan Company, Wharton Ranch, and Others.
Carya Illinoensis Market Dynamics
Carya Illinoensis Market Trend: Growing Demand for Plant-Based Ingredients
A prominent market trend for Carya Illinoensis, commonly known as pecan, is the growing demand for plant-based ingredients across various industries. As consumers prioritize healthier and more sustainable lifestyles, there's a noticeable shift towards plant-based foods, ingredients, and products. Pecans, with their nutritional benefits and versatility, are witnessing increased usage in food, beverage, and nutraceutical applications.
Carya Illinoensis Market Driver: Rising Awareness of Health Benefits
The market driver for Carya Illinoensis is the rising awareness of its health benefits. Pecans are rich in nutrients such as antioxidants, healthy fats, vitamins, and minerals, making them beneficial for heart health, brain function, and overall well-being. As consumers become more health-conscious, there's a growing demand for foods and ingredients that offer nutritional value and contribute to a balanced diet, driving the popularity of pecans.
Carya Illinoensis Market Opportunity: Diversification in Food and Snack Products
An opportunity within the Carya Illinoensis market is diversification in food and snack products. Pecans can be incorporated into a wide range of food items, including baked goods, cereals, salads, snacks, and desserts. Collaborations with food manufacturers, development of innovative pecan-based recipes, and marketing campaigns highlighting the nutritional benefits and taste profile of pecans can help capitalize on the growing consumer interest in healthy and flavorful food options.
Carya Illinoensis Market Share Analysis: Shelled Pecans segment generated the highest revenue share in the industry
The largest segment in the Carya Illinoensis Market is shelled pecans. Shelled pecans refer to pecan nuts that have been removed from their shells, making them ready-to-eat or ready-to-use in various culinary applications. This segment has witnessed significant growth due to several factors. Firstly, shelled pecans offer convenience to consumers as they eliminate the need for cracking and shelling, saving time and effort in food preparation. This convenience factor has made shelled pecans a preferred choice for consumers seeking quick and hassle-free nut consumption. Further, shelled pecans are versatile ingredients used in a wide range of food products such as bakery items, confectioneries, snacks, and salads, contributing to their popularity among food manufacturers and chefs. Additionally, shelled pecans are valued for their nutritional benefits, including being a good source of healthy fats, antioxidants, and minerals, further driving their demand in the health-conscious consumer market. As a result of these factors, the shelled pecans segment has emerged as the largest and fastest-growing segment in the Carya Illinoensis Market, with continued growth expected in the foreseeable future.
Carya Illinoensis Market Share Analysis: Confectionery & Bakery is the fastest growing segment over the forecast period to 2032
The fastest-growing segment in the Carya Illinoensis Market is the Confectionery & Bakery application. This segment refers to the use of Carya Illinoensis, commonly known as pecans, in the production of confectionery items like chocolates, candies, and pastries, as well as bakery goods such as cakes, cookies, and bread. The growth of this segment can be attributed to several key factors. Firstly, there is an increasing consumer preference for indulgent and premium confectionery products that incorporate nuts like pecans due to their unique flavor, texture, and nutritional benefits. This trend has led to a surge in demand for pecan-based confectionery items, driving the growth of the segment. Further, the growing popularity of artisanal and gourmet bakery products has also contributed to the expansion of the Confectionery & Bakery application. Bakeries and pastry shops are incorporating pecans into their recipes to offer innovative and enticing baked goods to their customers, further fueling the demand for pecans in this segment. Additionally, pecans are perceived as a healthier nut option compared to others, leading to increased use in health-conscious bakery and confectionery formulations. As a result, the Confectionery & Bakery application within the Carya Illinoensis Market is experiencing rapid growth and is expected to continue its upward trajectory until 2032.
Carya Illinoensis Market Segmentation
By Type
In-shell Pecans
Shelled Pecans
By Application
Direct Consumption
Confectionery & Bakery
Others
Countries Analyzed
North America (US, Canada, Mexico)
Europe (Germany, UK, France, Spain, Italy, Russia, Rest of Europe)
Asia Pacific (China, India, Japan, South Korea, Australia, South East Asia, Rest of Asia)
South America (Brazil, Argentina, Rest of South America)
Middle East and Africa (Saudi Arabia, UAE, Rest of Middle East, South Africa, Egypt, Rest of Africa)
Carya Illinoensis Companies Profiled in the Study
Amercorp International
Bar D River Ranch Pecans
Calway Foods
Carter Pecan
Cullers Farms
Debbie Roy Brokerage
Dennis Hardman
Durden Pecan
Durham-Ellis Pecan
Easterlin Pecan
Ellis Bros. Pecans
Global Bottomline
Hudson Pecan
John B. Sanfilippo & Son
Lamar Pecan
Lane Southern Orchards
Merritt Pecan
Montz Pecans
Navarro Pecan
Nut Tree Pecan
Royalty Pecan Farms
San Saba Pecan
Shamrock Ranch
South Georgia Pecan
The Alabama Pecan
The Green Valley Pecan
Tularosa Pecan
U.S.Pecans
Whaley Pecan Company
Wharton Ranch
*- List Not Exhaustive
Chapter 1. TABLE OF CONTENTS
Chapter 2. Introduction to Carya Illinoensis Market
2.1. Market Overview
2.2. Key Statistics and Report Highlights
2.3. Scope of the Comprehensive Study
2.3.1. Market Definition
2.3.2 Countries and Regions Covered
2.3.3 Research Objective
2.3.4 Units, Currency, and Conversions
2.3.5 Industry Value Chain
2.4. Key Market Segments
2.5. Key Companies
2.6. Study Period
Chapter 3. Strategic Analysis Review
3.1. Carya Illinoensis Pricing Analysis and Forecast
3.2. Porter’s Five Forces
3.3. Market Ecosystem
3.4. SWOT Analysis
3.5. Regulatory Scenario
3.3. Effects of Inflation, Russia-Ukraine War, moderating economic growth, and other macroeconomic factors
Chapter 4. Competitive Landscape
4.1. Market Share Analysis
4.1.1. Global Carya Illinoensis Market Share by Company, 2023
4.1.2. Product Offerings of Leading Carya Illinoensis Companies
4.2. Market Entropy
4.2.1. New Product Launches in the Industry
4.2.2. Mergers, Acquisitions, Joint ventures, and Partnerships
4.3. Key Strategies and Best Practices
Chapter 5. Global Market Projections: Best, Reference, and Low Case Scenarios
5.1. Growth Analysis- Case Scenario Definitions
5.2. Low Growth Case Scenario Forecasts
5.3. Reference Growth Case Scenario Forecasts
5.4. High Growth Case Scenario Forecasts
Chapter 6. Market Dynamics
6.1. Carya Illinoensis Market Drivers
6.2. Carya Illinoensis Market Challenges
6.6. Carya Illinoensis Market Opportunities
6.4. Carya Illinoensis Market Trends
Chapter 7. Global Carya Illinoensis Market Outlook Trends
7.1. Global Carya Illinoensis Revenue (USD Million) and CAGR (%) by Type (2021-2032)
7.2. Global Carya Illinoensis Revenue (USD Million) and CAGR (%) by Application (2021-2032)
7.3. Global Carya Illinoensis Revenue (USD Million) and CAGR (%) by Product (2021-2032)
By Type
In-shell Pecans
Shelled Pecans
By Application
Direct Consumption
Confectionery & Bakery
Others
Chapter 8. Global Carya Illinoensis Regional Analysis and Outlook
8.1. Global Carya Illinoensis Revenue (USD Million) By Regions (2021- 2032)
8.2. North America Carya Illinoensis Revenue (USD Million) by Country (2021-2032)
8.2.1. United States Carya Illinoensis Regional Analysis and Outlook
8.2.2. Canada Carya Illinoensis Regional Analysis and Outlook
8.2.3. Mexico Carya Illinoensis Regional Analysis and Outlook
8.3. Europe Carya Illinoensis Revenue (USD Million), by Country (2021-2032)
8.3.1. Germany Carya Illinoensis Regional Analysis and Outlook
8.3.2. France Carya Illinoensis Regional Analysis and Outlook
8.3.3. United Kingdom Carya Illinoensis Regional Analysis and Outlook
8.3.4. Spain Carya Illinoensis Regional Analysis and Outlook
8.3.5. Italy Carya Illinoensis Regional Analysis and Outlook
8.3.6. Russia Carya Illinoensis Regional Analysis and Outlook
8.3.7. Rest of Europe Carya Illinoensis Regional Analysis and Outlook
8.4. Asia Pacific Carya Illinoensis Revenue (USD Million) by Country (2021-2032)
8.4.1. China Carya Illinoensis Regional Analysis and Outlook
8.4.2. Japan Carya Illinoensis Regional Analysis and Outlook
8.4.3. India Carya Illinoensis Regional Analysis and Outlook
8.4.4. South Korea Carya Illinoensis Regional Analysis and Outlook
8.4.5. Australia Carya Illinoensis Regional Analysis and Outlook
8.4.6. South East Asia Carya Illinoensis Regional Analysis and Outlook
8.4.7. Rest of Asia Pacific Carya Illinoensis Regional Analysis and Outlook
8.5. South America Carya Illinoensis Revenue (USD Million), by Country (2021-2032)
8.5.1. Brazil Carya Illinoensis Regional Analysis and Outlook
8.5.2. Argentina Carya Illinoensis Regional Analysis and Outlook
8.5.3. Rest of South America Carya Illinoensis Regional Analysis and Outlook
8.6. Middle East and Africa Carya Illinoensis Revenue (USD Million) by Country (2021-2032)
8.6.1. Middle East Carya Illinoensis Regional Analysis and Outlook
8.6.2. Africa Carya Illinoensis Regional Analysis and Outlook
Chapter 9. North America Carya Illinoensis Analysis and Outlook
9.1. North America Carya Illinoensis Revenue (USD Million) by Segments (2021-2032)
9.1.1. North America Carya Illinoensis Revenue (USD Million) by Type (2021-2032)
9.1.2. North America Carya Illinoensis Revenue (USD Million) by Application (2021-2032)
9.1.3. North America Carya Illinoensis Revenue (USD Million) by Product (2021-2032)
By Type
In-shell Pecans
Shelled Pecans
By Application
Direct Consumption
Confectionery & Bakery
Others
Chapter 10. Europe Carya Illinoensis Analysis and Outlook
10.1. Europe Carya Illinoensis Revenue (USD Million), by Segments (USD Million) (2021-2032)
10.1.1. Europe Carya Illinoensis Revenue (USD Million) by Type (2021-2032)
10.1.2. Europe Carya Illinoensis Revenue (USD Million) by Application (2021-2032)
10.1.3. Europe Carya Illinoensis Revenue (USD Million) by Product (2021-2032)
By Type
In-shell Pecans
Shelled Pecans
By Application
Direct Consumption
Confectionery & Bakery
Others
Chapter 11. Asia Pacific Carya Illinoensis Analysis and Outlook
11.1. Asia Pacific Carya Illinoensis Revenue (USD Million), and Revenue (USD Million) by Segments (2021-2032)
11.1.1. Asia Pacific Carya Illinoensis Revenue (USD Million) by Type (2021-2032)
11.1.2. Asia Pacific Carya Illinoensis Revenue (USD Million) by Application (2021-2032)
11.1.3. Asia Pacific Carya Illinoensis Revenue (USD Million) by Product (2021-2032)
By Type
In-shell Pecans
Shelled Pecans
By Application
Direct Consumption
Confectionery & Bakery
Others
Chapter 12. South America Carya Illinoensis Analysis and Outlook
12.1. South America Carya Illinoensis Revenue (USD Million), by Segments (2021-2032)
12.1.1. South America Carya Illinoensis Revenue (USD Million) by Type (2021-2032)
12.1.2. South America Carya Illinoensis Revenue (USD Million) by Application (2021-2032)
12.1.3. South America Carya Illinoensis Revenue (USD Million) by Product (2021-2032)
By Type
In-shell Pecans
Shelled Pecans
By Application
Direct Consumption
Confectionery & Bakery
Others
Chapter 13. Middle East and Africa Carya Illinoensis Analysis and Outlook
13.1. Middle East and Africa Carya Illinoensis Revenue (USD Million), by Segments (2021-2032)
13.1.1. Middle East and Africa Carya Illinoensis Revenue (USD Million) by Type (2021-2032)
13.1.2. Middle East and Africa Carya Illinoensis Revenue (USD Million) by Application (2021-2032)
13.1.3. Middle East and Africa Carya Illinoensis Revenue (USD Million) by Product (2021-2032)
By Type
In-shell Pecans
Shelled Pecans
By Application
Direct Consumption
Confectionery & Bakery
Others
Chapter 14. Carya Illinoensis Company Profiles
14.1 Business Overview
14.2 Product Profiles
14.3 SWOT Profiles
14.5 Recent Developments
14.6 Financial Profile
List of Companies
Amercorp International
Bar D River Ranch Pecans
Calway Foods
Carter Pecan
Cullers Farms
Debbie Roy Brokerage
Dennis Hardman
Durden Pecan
Durham-Ellis Pecan
Easterlin Pecan
Ellis Bros. Pecans
Global Bottomline
Hudson Pecan
John B. Sanfilippo & Son
Lamar Pecan
Lane Southern Orchards
Merritt Pecan
Montz Pecans
Navarro Pecan
Nut Tree Pecan
Royalty Pecan Farms
San Saba Pecan
Shamrock Ranch
South Georgia Pecan
The Alabama Pecan
The Green Valley Pecan
Tularosa Pecan
U.S.Pecans
Whaley Pecan Company
Wharton Ranch
15. Methodology and Data Sources
15.1 Customization Offerings
15.2 Subscription Services
15.3 Related Reports
15.4 Publisher Expertise
LIST OF TABLES
Table 1 Market Segmentation Analysis
Table 2 Global Carya Illinoensis Market Share of Leading Companies, 2023
Table 3 Product Offerings of Leading Companies
Table 4 Low Growth Scenario Forecasts
Table 5 Reference Case Growth Scenario
Table 6 High Growth Case Scenario
Table 7 Global Carya Illinoensis Revenue (USD Million) And CAGR (%) By Type (2021-2032)
Table 8 Global Carya Illinoensis Revenue (USD Million) And CAGR (%) By Application (2021-2032)
Table 9 Global Carya Illinoensis Revenue (USD Million) And CAGR (%) By Product (2021-2032)
Table 10 Global Carya Illinoensis Market Revenue (USD Million) By Regions (2021-2032)
Table 11 Global Carya Illinoensis Market Share (%) By Regions (2021-2032)
Table 12 North America Carya Illinoensis Revenue (USD Million) By Country (2021-2032)
Table 13 Europe Carya Illinoensis Revenue (USD Million) By Country (2021-2032)
Table 14 Asia Pacific Carya Illinoensis Revenue (USD Million) By Country (2021-2032)
Table 15 South America Carya Illinoensis Revenue (USD Million) By Country (2021-2032)
Table 16 Middle East and Africa Carya Illinoensis Revenue (USD Million) By Region (2021-2032)
Table 17 North America Carya Illinoensis Revenue (USD Million) By Type (2021-2032)
Table 18 North America Carya Illinoensis Revenue (USD Million) By Application (2021-2032)
Table 19 North America Carya Illinoensis Revenue (USD Million) By Product (2021-2032)
Table 20 Europe Carya Illinoensis Revenue (USD Million) By Type (2021-2032)
Table 21 Europe Carya Illinoensis Revenue (USD Million) By Application (2021-2032)
Table 22 Europe Carya Illinoensis Revenue (USD Million) By Product (2021-2032)
Table 23 Asia Pacific Carya Illinoensis Revenue (USD Million) By Type (2021-2032)
Table 24 Asia Pacific Carya Illinoensis Revenue (USD Million) By Application (2021-2032)
Table 25 Asia Pacific Carya Illinoensis Revenue (USD Million) By Product (2021-2032)
Table 26 South America Carya Illinoensis Revenue (USD Million) By Type (2021-2032)
Table 27 South America Carya Illinoensis Revenue (USD Million) By Application (2021-2032)
Table 28 South America Carya Illinoensis Revenue (USD Million) By Product (2021-2032)
Table 29 Middle East and Africa Carya Illinoensis Revenue (USD Million) By Type (2021-2032)
Table 30 Middle East and Africa Carya Illinoensis Revenue (USD Million) By Application (2021-2032)
Table 31 Middle East and Africa Carya Illinoensis Revenue (USD Million) By Product (2021-2032)
LIST OF FIGURES
Figure 1. Market Scope
Figure 2. Pricing Forecasts Per Unit, 2023- 2032
Figure 3. Porter’s Five Forces
Figure 4. Global Carya Illinoensis Market Revenue (USD Million) By Regions (2021-2032)
Figure 5. Global Carya Illinoensis Market Share (%) By Regions (2023)
Figure 6. North America Carya Illinoensis Revenue (USD Million) By Country (2021-2032)
Figure 7. United States Carya Illinoensis Revenue (USD Million) By Country (2021-2032)
Figure 8. Canada Carya Illinoensis Revenue (USD Million) By Country (2021-2032)
Figure 9. Mexico Carya Illinoensis Revenue (USD Million) By Country (2021-2032)
Figure 10. Europe Carya Illinoensis Revenue (USD Million) By Country (2021-2032)
Figure 11. Germany Carya Illinoensis Revenue (USD Million) By Country (2021-2032)
Figure 12. France Carya Illinoensis Revenue (USD Million) By Country (2021-2032)
Figure 13. United Kingdom Carya Illinoensis Revenue (USD Million) By Country (2021-2032)
Figure 14. Spain Carya Illinoensis Revenue (USD Million) By Country (2021-2032)
Figure 15. Italy Carya Illinoensis Revenue (USD Million) By Country (2021-2032)
Figure 16. Russia Carya Illinoensis Revenue (USD Million) By Country (2021-2032)
Figure 17. Rest of Europe Carya Illinoensis Revenue (USD Million) By Country (2021-2032)
Figure 11. Asia Pacific Carya Illinoensis Revenue (USD Million) By Country (2021-2032)
Figure 12. China Carya Illinoensis Revenue (USD Million) By Country (2021-2032)
Figure 13. Japan Carya Illinoensis Revenue (USD Million) By Country (2021-2032)
Figure 14. India Carya Illinoensis Revenue (USD Million) By Country (2021-2032)
Figure 15. South Korea Carya Illinoensis Revenue (USD Million) By Country (2021-2032)
Figure 16. Australia Carya Illinoensis Revenue (USD Million) By Country (2021-2032)
Figure 17. South East Asia Carya Illinoensis Revenue (USD Million) By Country (2021-2032)
Figure 18. South America Carya Illinoensis Revenue (USD Million) By Country (2021-2032)
Figure 19. Brazil Carya Illinoensis Revenue (USD Million) By Country (2021-2032)
Figure 20. Argentina Carya Illinoensis Revenue (USD Million) By Country (2021-2032)
Figure 21. Rest of Asia Pacific Carya Illinoensis Revenue (USD Million) By Country (2021-2032)
Figure 22. Middle East and Africa Carya Illinoensis Revenue (USD Million) By Region (2021-2032)
Figure 23. Saudi Arabia Carya Illinoensis Revenue (USD Million) By Region (2021-2032)
Figure 24. The UAE Carya Illinoensis Revenue (USD Million) By Region (2021-2032)
Figure 25. Rest of Middle East Carya Illinoensis Revenue (USD Million) By Region (2021-2032)
Figure 26. South Africa Carya Illinoensis Revenue (USD Million) By Region (2021-2032)
Figure 27. Africa Carya Illinoensis Revenue (USD Million) By Region (2021-2032)
Figure 28. North America Carya Illinoensis Revenue (USD Million) By Type (2021-2032)
Figure 29. North America Carya Illinoensis Revenue (USD Million) By Application (2021-2032)
Figure 30. North America Carya Illinoensis Revenue (USD Million) By Product (2021-2032)
Figure 31. Europe Carya Illinoensis Revenue (USD Million) By Type (2021-2032)
Figure 32. Europe Carya Illinoensis Revenue (USD Million) By Application (2021-2032)
Figure 33. Europe Carya Illinoensis Revenue (USD Million) By Product (2021-2032)
Figure 34. Asia Pacific Carya Illinoensis Revenue (USD Million) By Type (2021-2032)
Figure 35. Asia Pacific Carya Illinoensis Revenue (USD Million) By Application (2021-2032)
Figure 36. Asia Pacific Carya Illinoensis Revenue (USD Million) By Product (2021-2032)
Figure 37. South America Carya Illinoensis Revenue (USD Million) By Type (2021-2032)
Figure 38. South America Carya Illinoensis Revenue (USD Million) By Application (2021-2032)
Figure 39. South America Carya Illinoensis Revenue (USD Million) By Product (2021-2032)
Figure 40. Middle East and Africa Carya Illinoensis Revenue (USD Million) By Type (2021-2032)
Figure 41. Middle East and Africa Carya Illinoensis Revenue (USD Million) By Application (2021-2032)
Figure 42. Middle East and Africa Carya Illinoensis Revenue (USD Million) By Product (2021-2032)
By Type
In-shell Pecans
Shelled Pecans
By Application
Direct Consumption
Confectionery & Bakery
Others
Countries Analyzed
North America (US, Canada, Mexico)
Europe (Germany, UK, France, Spain, Italy, Russia, Rest of Europe)
Asia Pacific (China, India, Japan, South Korea, Australia, South East Asia, Rest of Asia)
South America (Brazil, Argentina, Rest of South America)
Middle East and Africa (Saudi Arabia, UAE, Rest of Middle East, South Africa, Egypt, Rest of Africa)
