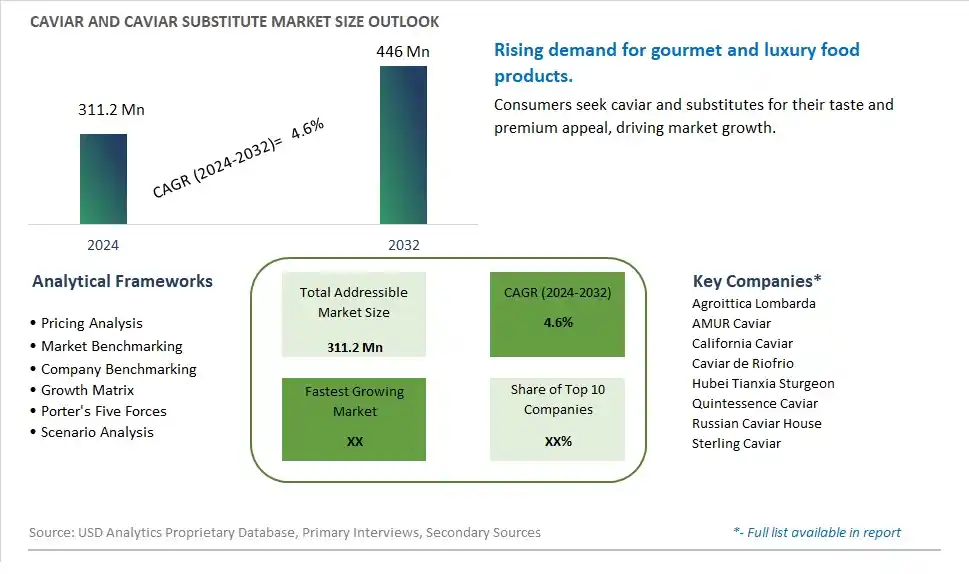
Global Caviar and Caviar Substitute Market Size is valued at $311.2 Million in 2024 and is forecast to register a growth rate (CAGR) of 4.6% to reach $446 Million by 2032.
The global Caviar and Caviar Substitute Market Comprehensive Study analyzes and forecasts the market size across 6 regions and 24 countries for diverse segments -By Type (Salted Processing, Pressed Processing, Pasteurized Processing), By Application (Household, Restaurants, Others)
An Introduction to Caviar and Caviar Substitute Market
In 2024, the Caviar and Caviar Substitute market is witnessing robust growth, driven by the increasing demand for gourmet and luxury food products. Caviar, the roe of sturgeon, and its substitutes made from other fish or plant-based ingredients, are prized for their unique flavor and texture. The market is supported by the growing popularity of high-end dining experiences and the trend towards sustainable seafood options. Advances in aquaculture and processing technologies are enhancing the quality, authenticity, and availability of caviar and its substitutes. The market is also benefiting from the trend towards clean-label and ethically sourced luxury foods, appealing to discerning consumers seeking indulgent and environmentally responsible choices.
Caviar and Caviar Substitute Competitive Landscape
The market report analyses the leading companies in the industry including Agroittica Lombarda, AMUR Caviar, California Caviar, Caviar de Riofrio, Hubei Tianxia Sturgeon, Quintessence Caviar, Russian Caviar House, Sterling Caviar, and Others.
Caviar and Caviar Substitute Market Dynamics
Caviar and Caviar Substitute Market Trend: Increasing Demand for Luxury Food Products
One of the most prominent market trends for Caviar and Caviar Substitute is the increasing demand for luxury food products. Caviar, known for its exquisite taste and premium status, is experiencing a surge in demand among affluent consumers worldwide. This trend is driven by factors such as rising disposable incomes, growing interest in gourmet dining experiences, and the perception of caviar as a symbol of luxury and sophistication.
Caviar and Caviar Substitute Market Driver: Growing Health Consciousness and Sustainable Practices
A significant market driver for Caviar and Caviar Substitute is the growing health consciousness and emphasis on sustainable practices. Consumers are becoming more mindful of their dietary choices, seeking nutritious and sustainable alternatives. This shift has led to the development of caviar substitutes made from sustainable sources like plant-based ingredients or sustainably harvested fish roe. The demand for these substitutes is driven by health-conscious consumers looking for ethical and environmentally friendly options.
Caviar and Caviar Substitute Market Opportunity: Diversification of Product Offerings and Market Expansion
An opportunity within the Caviar and Caviar Substitute market lies in diversifying product offerings and expanding into new markets. Manufacturers can explore innovative techniques to produce high-quality caviar substitutes that mimic the taste and texture of traditional caviar. Additionally, targeting emerging markets with growing disposable incomes and a burgeoning interest in luxury food products can unlock new growth opportunities. Collaborations with renowned chefs, restaurants, and retailers can also enhance brand visibility and attract a broader consumer base.
Caviar and Caviar Substitute Market Share Analysis: Salted Processing segment generated the highest revenue share in the industry
The Salted Processing segment stands out as the largest within the Caviar and Caviar Substitute Market. This segment encompasses caviar products that undergo traditional salting methods, preserving the roe's delicate flavor and texture. Salted caviar has been a long-standing favorite among consumers due to its distinct taste and premium quality. The process involves carefully salting the roe to enhance its flavor profile and extend its shelf life. This traditional method of caviar production has garnered a loyal customer base globally, particularly among connoisseurs and luxury food enthusiasts who appreciate the authentic taste and craftsmanship associated with salted caviar. The Salted Processing segment's dominance highlights the enduring appeal of traditional caviar preparation methods in the market, contributing significantly to the overall growth and dynamism of the caviar industry.
Caviar and Caviar Substitute Market Share Analysis: Restaurants is the fastest growing segment over the forecast period to 2032
The Restaurants segment within the Caviar and Caviar Substitute Market emerges as the fastest-growing segment leading up to 2032. This growth is primarily driven by the increasing demand for premium culinary experiences in fine dining establishments worldwide. Restaurants are incorporating caviar and caviar substitutes into their menus to cater to discerning customers seeking exquisite and luxurious dining options. The allure of caviar's delicate flavors and luxurious connotations makes it a popular choice among chefs and restaurant-goers alike. Further, the rise of gastronomic tourism and the growing number of high-end dining establishments globally further fuel the demand for caviar in restaurant settings. The Restaurants segment's rapid growth underscores the evolving culinary preferences of consumers and the expanding opportunities for caviar producers and suppliers to collaborate with the foodservice industry and capitalize on the growing demand for premium dining experiences.
Caviar and Caviar Substitute Market Segmentation
By Type
Salted Processing
Pressed Processing
Pasteurized Processing
By Application
Household
Restaurants
Others
Countries Analyzed
North America (US, Canada, Mexico)
Europe (Germany, UK, France, Spain, Italy, Russia, Rest of Europe)
Asia Pacific (China, India, Japan, South Korea, Australia, South East Asia, Rest of Asia)
South America (Brazil, Argentina, Rest of South America)
Middle East and Africa (Saudi Arabia, UAE, Rest of Middle East, South Africa, Egypt, Rest of Africa)
Caviar and Caviar Substitute Companies Profiled in the Study
Agroittica Lombarda
AMUR Caviar
California Caviar
Caviar de Riofrio
Hubei Tianxia Sturgeon
Quintessence Caviar
Russian Caviar House
Sterling Caviar
*- List Not Exhaustive
Chapter 1. TABLE OF CONTENTS
Chapter 2. Introduction to Caviar and Caviar Substitute Market
2.1. Market Overview
2.2. Key Statistics and Report Highlights
2.3. Scope of the Comprehensive Study
2.3.1. Market Definition
2.3.2 Countries and Regions Covered
2.3.3 Research Objective
2.3.4 Units, Currency, and Conversions
2.3.5 Industry Value Chain
2.4. Key Market Segments
2.5. Key Companies
2.6. Study Period
Chapter 3. Strategic Analysis Review
3.1. Caviar and Caviar Substitute Pricing Analysis and Forecast
3.2. Porter’s Five Forces
3.3. Market Ecosystem
3.4. SWOT Analysis
3.5. Regulatory Scenario
3.3. Effects of Inflation, Russia-Ukraine War, moderating economic growth, and other macroeconomic factors
Chapter 4. Competitive Landscape
4.1. Market Share Analysis
4.1.1. Global Caviar and Caviar Substitute Market Share by Company, 2023
4.1.2. Product Offerings of Leading Caviar and Caviar Substitute Companies
4.2. Market Entropy
4.2.1. New Product Launches in the Industry
4.2.2. Mergers, Acquisitions, Joint ventures, and Partnerships
4.3. Key Strategies and Best Practices
Chapter 5. Global Market Projections: Best, Reference, and Low Case Scenarios
5.1. Growth Analysis- Case Scenario Definitions
5.2. Low Growth Case Scenario Forecasts
5.3. Reference Growth Case Scenario Forecasts
5.4. High Growth Case Scenario Forecasts
Chapter 6. Market Dynamics
6.1. Caviar and Caviar Substitute Market Drivers
6.2. Caviar and Caviar Substitute Market Challenges
6.6. Caviar and Caviar Substitute Market Opportunities
6.4. Caviar and Caviar Substitute Market Trends
Chapter 7. Global Caviar and Caviar Substitute Market Outlook Trends
7.1. Global Caviar and Caviar Substitute Revenue (USD Million) and CAGR (%) by Type (2021-2032)
7.2. Global Caviar and Caviar Substitute Revenue (USD Million) and CAGR (%) by Application (2021-2032)
7.3. Global Caviar and Caviar Substitute Revenue (USD Million) and CAGR (%) by Product (2021-2032)
By Type
Salted Processing
Pressed Processing
Pasteurized Processing
By Application
Household
Restaurants
Others
Chapter 8. Global Caviar and Caviar Substitute Regional Analysis and Outlook
8.1. Global Caviar and Caviar Substitute Revenue (USD Million) By Regions (2021- 2032)
8.2. North America Caviar and Caviar Substitute Revenue (USD Million) by Country (2021-2032)
8.2.1. United States Caviar and Caviar Substitute Regional Analysis and Outlook
8.2.2. Canada Caviar and Caviar Substitute Regional Analysis and Outlook
8.2.3. Mexico Caviar and Caviar Substitute Regional Analysis and Outlook
8.3. Europe Caviar and Caviar Substitute Revenue (USD Million), by Country (2021-2032)
8.3.1. Germany Caviar and Caviar Substitute Regional Analysis and Outlook
8.3.2. France Caviar and Caviar Substitute Regional Analysis and Outlook
8.3.3. United Kingdom Caviar and Caviar Substitute Regional Analysis and Outlook
8.3.4. Spain Caviar and Caviar Substitute Regional Analysis and Outlook
8.3.5. Italy Caviar and Caviar Substitute Regional Analysis and Outlook
8.3.6. Russia Caviar and Caviar Substitute Regional Analysis and Outlook
8.3.7. Rest of Europe Caviar and Caviar Substitute Regional Analysis and Outlook
8.4. Asia Pacific Caviar and Caviar Substitute Revenue (USD Million) by Country (2021-2032)
8.4.1. China Caviar and Caviar Substitute Regional Analysis and Outlook
8.4.2. Japan Caviar and Caviar Substitute Regional Analysis and Outlook
8.4.3. India Caviar and Caviar Substitute Regional Analysis and Outlook
8.4.4. South Korea Caviar and Caviar Substitute Regional Analysis and Outlook
8.4.5. Australia Caviar and Caviar Substitute Regional Analysis and Outlook
8.4.6. South East Asia Caviar and Caviar Substitute Regional Analysis and Outlook
8.4.7. Rest of Asia Pacific Caviar and Caviar Substitute Regional Analysis and Outlook
8.5. South America Caviar and Caviar Substitute Revenue (USD Million), by Country (2021-2032)
8.5.1. Brazil Caviar and Caviar Substitute Regional Analysis and Outlook
8.5.2. Argentina Caviar and Caviar Substitute Regional Analysis and Outlook
8.5.3. Rest of South America Caviar and Caviar Substitute Regional Analysis and Outlook
8.6. Middle East and Africa Caviar and Caviar Substitute Revenue (USD Million) by Country (2021-2032)
8.6.1. Middle East Caviar and Caviar Substitute Regional Analysis and Outlook
8.6.2. Africa Caviar and Caviar Substitute Regional Analysis and Outlook
Chapter 9. North America Caviar and Caviar Substitute Analysis and Outlook
9.1. North America Caviar and Caviar Substitute Revenue (USD Million) by Segments (2021-2032)
9.1.1. North America Caviar and Caviar Substitute Revenue (USD Million) by Type (2021-2032)
9.1.2. North America Caviar and Caviar Substitute Revenue (USD Million) by Application (2021-2032)
9.1.3. North America Caviar and Caviar Substitute Revenue (USD Million) by Product (2021-2032)
By Type
Salted Processing
Pressed Processing
Pasteurized Processing
By Application
Household
Restaurants
Others
Chapter 10. Europe Caviar and Caviar Substitute Analysis and Outlook
10.1. Europe Caviar and Caviar Substitute Revenue (USD Million), by Segments (USD Million) (2021-2032)
10.1.1. Europe Caviar and Caviar Substitute Revenue (USD Million) by Type (2021-2032)
10.1.2. Europe Caviar and Caviar Substitute Revenue (USD Million) by Application (2021-2032)
10.1.3. Europe Caviar and Caviar Substitute Revenue (USD Million) by Product (2021-2032)
By Type
Salted Processing
Pressed Processing
Pasteurized Processing
By Application
Household
Restaurants
Others
Chapter 11. Asia Pacific Caviar and Caviar Substitute Analysis and Outlook
11.1. Asia Pacific Caviar and Caviar Substitute Revenue (USD Million), and Revenue (USD Million) by Segments (2021-2032)
11.1.1. Asia Pacific Caviar and Caviar Substitute Revenue (USD Million) by Type (2021-2032)
11.1.2. Asia Pacific Caviar and Caviar Substitute Revenue (USD Million) by Application (2021-2032)
11.1.3. Asia Pacific Caviar and Caviar Substitute Revenue (USD Million) by Product (2021-2032)
By Type
Salted Processing
Pressed Processing
Pasteurized Processing
By Application
Household
Restaurants
Others
Chapter 12. South America Caviar and Caviar Substitute Analysis and Outlook
12.1. South America Caviar and Caviar Substitute Revenue (USD Million), by Segments (2021-2032)
12.1.1. South America Caviar and Caviar Substitute Revenue (USD Million) by Type (2021-2032)
12.1.2. South America Caviar and Caviar Substitute Revenue (USD Million) by Application (2021-2032)
12.1.3. South America Caviar and Caviar Substitute Revenue (USD Million) by Product (2021-2032)
By Type
Salted Processing
Pressed Processing
Pasteurized Processing
By Application
Household
Restaurants
Others
Chapter 13. Middle East and Africa Caviar and Caviar Substitute Analysis and Outlook
13.1. Middle East and Africa Caviar and Caviar Substitute Revenue (USD Million), by Segments (2021-2032)
13.1.1. Middle East and Africa Caviar and Caviar Substitute Revenue (USD Million) by Type (2021-2032)
13.1.2. Middle East and Africa Caviar and Caviar Substitute Revenue (USD Million) by Application (2021-2032)
13.1.3. Middle East and Africa Caviar and Caviar Substitute Revenue (USD Million) by Product (2021-2032)
By Type
Salted Processing
Pressed Processing
Pasteurized Processing
By Application
Household
Restaurants
Others
Chapter 14. Caviar and Caviar Substitute Company Profiles
14.1 Business Overview
14.2 Product Profiles
14.3 SWOT Profiles
14.5 Recent Developments
14.6 Financial Profile
List of Companies
Agroittica Lombarda
AMUR Caviar
California Caviar
Caviar de Riofrio
Hubei Tianxia Sturgeon
Quintessence Caviar
Russian Caviar House
Sterling Caviar
15. Methodology and Data Sources
15.1 Customization Offerings
15.2 Subscription Services
15.3 Related Reports
15.4 Publisher Expertise
LIST OF TABLES
Table 1 Market Segmentation Analysis
Table 2 Global Caviar and Caviar Substitute Market Share of Leading Companies, 2023
Table 3 Product Offerings of Leading Companies
Table 4 Low Growth Scenario Forecasts
Table 5 Reference Case Growth Scenario
Table 6 High Growth Case Scenario
Table 7 Global Caviar and Caviar Substitute Revenue (USD Million) And CAGR (%) By Type (2021-2032)
Table 8 Global Caviar and Caviar Substitute Revenue (USD Million) And CAGR (%) By Application (2021-2032)
Table 9 Global Caviar and Caviar Substitute Revenue (USD Million) And CAGR (%) By Product (2021-2032)
Table 10 Global Caviar and Caviar Substitute Market Revenue (USD Million) By Regions (2021-2032)
Table 11 Global Caviar and Caviar Substitute Market Share (%) By Regions (2021-2032)
Table 12 North America Caviar and Caviar Substitute Revenue (USD Million) By Country (2021-2032)
Table 13 Europe Caviar and Caviar Substitute Revenue (USD Million) By Country (2021-2032)
Table 14 Asia Pacific Caviar and Caviar Substitute Revenue (USD Million) By Country (2021-2032)
Table 15 South America Caviar and Caviar Substitute Revenue (USD Million) By Country (2021-2032)
Table 16 Middle East and Africa Caviar and Caviar Substitute Revenue (USD Million) By Region (2021-2032)
Table 17 North America Caviar and Caviar Substitute Revenue (USD Million) By Type (2021-2032)
Table 18 North America Caviar and Caviar Substitute Revenue (USD Million) By Application (2021-2032)
Table 19 North America Caviar and Caviar Substitute Revenue (USD Million) By Product (2021-2032)
Table 20 Europe Caviar and Caviar Substitute Revenue (USD Million) By Type (2021-2032)
Table 21 Europe Caviar and Caviar Substitute Revenue (USD Million) By Application (2021-2032)
Table 22 Europe Caviar and Caviar Substitute Revenue (USD Million) By Product (2021-2032)
Table 23 Asia Pacific Caviar and Caviar Substitute Revenue (USD Million) By Type (2021-2032)
Table 24 Asia Pacific Caviar and Caviar Substitute Revenue (USD Million) By Application (2021-2032)
Table 25 Asia Pacific Caviar and Caviar Substitute Revenue (USD Million) By Product (2021-2032)
Table 26 South America Caviar and Caviar Substitute Revenue (USD Million) By Type (2021-2032)
Table 27 South America Caviar and Caviar Substitute Revenue (USD Million) By Application (2021-2032)
Table 28 South America Caviar and Caviar Substitute Revenue (USD Million) By Product (2021-2032)
Table 29 Middle East and Africa Caviar and Caviar Substitute Revenue (USD Million) By Type (2021-2032)
Table 30 Middle East and Africa Caviar and Caviar Substitute Revenue (USD Million) By Application (2021-2032)
Table 31 Middle East and Africa Caviar and Caviar Substitute Revenue (USD Million) By Product (2021-2032)
LIST OF FIGURES
Figure 1. Market Scope
Figure 2. Pricing Forecasts Per Unit, 2023- 2032
Figure 3. Porter’s Five Forces
Figure 4. Global Caviar and Caviar Substitute Market Revenue (USD Million) By Regions (2021-2032)
Figure 5. Global Caviar and Caviar Substitute Market Share (%) By Regions (2023)
Figure 6. North America Caviar and Caviar Substitute Revenue (USD Million) By Country (2021-2032)
Figure 7. United States Caviar and Caviar Substitute Revenue (USD Million) By Country (2021-2032)
Figure 8. Canada Caviar and Caviar Substitute Revenue (USD Million) By Country (2021-2032)
Figure 9. Mexico Caviar and Caviar Substitute Revenue (USD Million) By Country (2021-2032)
Figure 10. Europe Caviar and Caviar Substitute Revenue (USD Million) By Country (2021-2032)
Figure 11. Germany Caviar and Caviar Substitute Revenue (USD Million) By Country (2021-2032)
Figure 12. France Caviar and Caviar Substitute Revenue (USD Million) By Country (2021-2032)
Figure 13. United Kingdom Caviar and Caviar Substitute Revenue (USD Million) By Country (2021-2032)
Figure 14. Spain Caviar and Caviar Substitute Revenue (USD Million) By Country (2021-2032)
Figure 15. Italy Caviar and Caviar Substitute Revenue (USD Million) By Country (2021-2032)
Figure 16. Russia Caviar and Caviar Substitute Revenue (USD Million) By Country (2021-2032)
Figure 17. Rest of Europe Caviar and Caviar Substitute Revenue (USD Million) By Country (2021-2032)
Figure 11. Asia Pacific Caviar and Caviar Substitute Revenue (USD Million) By Country (2021-2032)
Figure 12. China Caviar and Caviar Substitute Revenue (USD Million) By Country (2021-2032)
Figure 13. Japan Caviar and Caviar Substitute Revenue (USD Million) By Country (2021-2032)
Figure 14. India Caviar and Caviar Substitute Revenue (USD Million) By Country (2021-2032)
Figure 15. South Korea Caviar and Caviar Substitute Revenue (USD Million) By Country (2021-2032)
Figure 16. Australia Caviar and Caviar Substitute Revenue (USD Million) By Country (2021-2032)
Figure 17. South East Asia Caviar and Caviar Substitute Revenue (USD Million) By Country (2021-2032)
Figure 18. South America Caviar and Caviar Substitute Revenue (USD Million) By Country (2021-2032)
Figure 19. Brazil Caviar and Caviar Substitute Revenue (USD Million) By Country (2021-2032)
Figure 20. Argentina Caviar and Caviar Substitute Revenue (USD Million) By Country (2021-2032)
Figure 21. Rest of Asia Pacific Caviar and Caviar Substitute Revenue (USD Million) By Country (2021-2032)
Figure 22. Middle East and Africa Caviar and Caviar Substitute Revenue (USD Million) By Region (2021-2032)
Figure 23. Saudi Arabia Caviar and Caviar Substitute Revenue (USD Million) By Region (2021-2032)
Figure 24. The UAE Caviar and Caviar Substitute Revenue (USD Million) By Region (2021-2032)
Figure 25. Rest of Middle East Caviar and Caviar Substitute Revenue (USD Million) By Region (2021-2032)
Figure 26. South Africa Caviar and Caviar Substitute Revenue (USD Million) By Region (2021-2032)
Figure 27. Africa Caviar and Caviar Substitute Revenue (USD Million) By Region (2021-2032)
Figure 28. North America Caviar and Caviar Substitute Revenue (USD Million) By Type (2021-2032)
Figure 29. North America Caviar and Caviar Substitute Revenue (USD Million) By Application (2021-2032)
Figure 30. North America Caviar and Caviar Substitute Revenue (USD Million) By Product (2021-2032)
Figure 31. Europe Caviar and Caviar Substitute Revenue (USD Million) By Type (2021-2032)
Figure 32. Europe Caviar and Caviar Substitute Revenue (USD Million) By Application (2021-2032)
Figure 33. Europe Caviar and Caviar Substitute Revenue (USD Million) By Product (2021-2032)
Figure 34. Asia Pacific Caviar and Caviar Substitute Revenue (USD Million) By Type (2021-2032)
Figure 35. Asia Pacific Caviar and Caviar Substitute Revenue (USD Million) By Application (2021-2032)
Figure 36. Asia Pacific Caviar and Caviar Substitute Revenue (USD Million) By Product (2021-2032)
Figure 37. South America Caviar and Caviar Substitute Revenue (USD Million) By Type (2021-2032)
Figure 38. South America Caviar and Caviar Substitute Revenue (USD Million) By Application (2021-2032)
Figure 39. South America Caviar and Caviar Substitute Revenue (USD Million) By Product (2021-2032)
Figure 40. Middle East and Africa Caviar and Caviar Substitute Revenue (USD Million) By Type (2021-2032)
Figure 41. Middle East and Africa Caviar and Caviar Substitute Revenue (USD Million) By Application (2021-2032)
Figure 42. Middle East and Africa Caviar and Caviar Substitute Revenue (USD Million) By Product (2021-2032)
By Type
Salted Processing
Pressed Processing
Pasteurized Processing
By Application
Household
Restaurants
Others
Countries Analyzed
North America (US, Canada, Mexico)
Europe (Germany, UK, France, Spain, Italy, Russia, Rest of Europe)
Asia Pacific (China, India, Japan, South Korea, Australia, South East Asia, Rest of Asia)
South America (Brazil, Argentina, Rest of South America)
Middle East and Africa (Saudi Arabia, UAE, Rest of Middle East, South Africa, Egypt, Rest of Africa)
