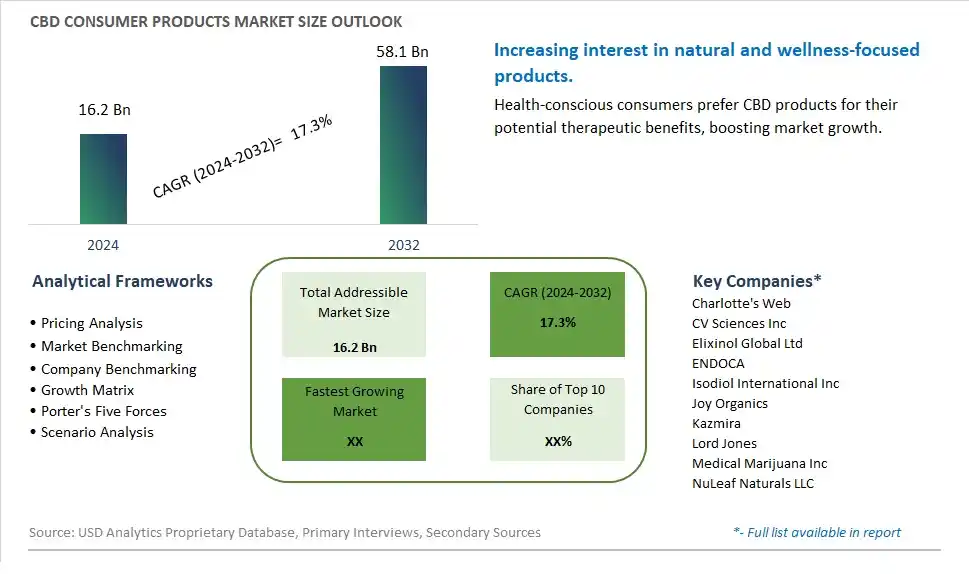
Global CBD Consumer Products Market Size is valued at $16.2 Billion in 2024 and is forecast to register a growth rate (CAGR) of 17.3% to reach $58.1 Billion by 2032.
The global CBD Consumer Products Market Comprehensive Study analyzes and forecasts the market size across 6 regions and 24 countries for diverse segments -By Type (Medical OTC Products, Nutraceuticals), By Application (Online Stores, Retail Stores, Retail Pharmacies, Others)
An Introduction to CBD Consumer Products Market
The CBD Consumer Products market in 2024 is expanding rapidly, driven by the increasing acceptance and demand for cannabidiol (CBD) across various product categories. CBD, known for its potential health benefits such as stress relief, pain management, and anti-inflammatory properties, is being incorporated into a wide range of consumer products including cosmetics, personal care, beverages, and edibles. The market is supported by growing consumer awareness and the trend towards natural and holistic wellness solutions. Advances in CBD extraction and formulation technologies are enhancing the efficacy, safety, and variety of CBD consumer products. The market is also benefiting from the trend towards clean-label and organic products, appealing to health-conscious consumers seeking natural remedies.
CBD Consumer Products Competitive Landscape
The market report analyses the leading companies in the industry including Charlotte's Web, CV Sciences Inc, Elixinol Global Ltd, ENDOCA, Isodiol International Inc , Joy Organics, Kazmira, Lord Jones, Medical Marijuana Inc, NuLeaf Naturals LLC, and Others.
CBD Consumer Products Market Dynamics
Market Trend: Diversification of CBD Product Offerings
The most prominent trend in the CBD Consumer Products Market is the diversification of CBD product offerings. As consumer interest in CBD grows, companies are expanding their product lines to include a wide range of CBD: infused products, such as edibles, topicals, beverages, and wellness supplements. This trend is driven by the desire to cater to different consumer preferences and needs, making CBD accessible in various formats and applications.
Market Driver: Increasing Evidence of CBD's Health Benefits
The key driver of the CBD Consumer Products Market is the increasing evidence of CBD's health benefits. Scientific research and anecdotal reports are highlighting the potential therapeutic effects of CBD, such as pain relief, anxiety reduction, and improved sleep quality. This growing body of evidence is encouraging more consumers to try CBD products as part of their health and wellness routines, driving demand across various product categories.
Market Opportunity: Targeting Niche Consumer Segments
A significant opportunity in the CBD Consumer Products Market lies in targeting niche consumer segments. Companies can develop specialized CBD products tailored to specific demographics, such as athletes, seniors, or beauty enthusiasts, who may benefit from CBD's unique properties. By creating targeted marketing campaigns and offering products designed to meet the needs of these niche segments, businesses can differentiate themselves and capture a loyal customer base.
CBD Consumer Products Market Share Analysis: Nutraceuticals segment generated the highest revenue share in the industry
The Nutraceuticals segment stands out as the largest within the CBD Consumer Products Market. This segment comprises a wide range of products infused with cannabidiol (CBD) that are designed to promote health and well-being through nutritional supplementation. The popularity of CBD-infused nutraceuticals has surged in recent years due to the increasing awareness of the potential health benefits associated with CBD, such as anti-inflammatory properties, stress relief, and support for overall wellness. Consumers are actively seeking natural and holistic alternatives for health management, leading to the growing demand for CBD nutraceuticals across various demographics. Furthermore, the legalization of hemp-derived CBD products in many regions has contributed to the expansion of the nutraceuticals segment within the CBD consumer market. As a result, CBD-infused nutraceuticals have become a significant driver of growth and innovation in the health and wellness industry, with a diverse range of products including CBD capsules, gummies, beverages, and dietary supplements catering to the evolving consumer preferences for holistic well-being solutions.
CBD Consumer Products Market Share Analysis: Online Stores is the fastest growing segment over the forecast period to 2032
The Online Stores segment emerges as the fastest-growing within the CBD Consumer Products Market. With the rapid digital transformation and the increasing preference for online shopping among consumers globally, the CBD industry has witnessed a significant shift towards online channels. Online stores provide a convenient and accessible platform for consumers to explore a wide range of CBD products, compare prices, read reviews, and make informed purchasing decisions from the comfort of their homes. This trend is particularly evident in the CBD market, where consumers often seek detailed information about product ingredients, potency, and certifications before making a purchase. The growing trust in e-commerce platforms, coupled with the convenience of doorstep delivery and the availability of a diverse range of CBD products, has fueled the exponential growth of online stores within the CBD consumer market. As technology continues to advance, online platforms are expected to play a pivotal role in shaping the future of the CBD industry, offering innovative shopping experiences and expanding market reach to a broader audience of health-conscious consumers.
CBD Consumer Products Market Segmentation
By Type
Medical OTC Products
Nutraceuticals
By Application
Online Stores
Retail Stores
Retail Pharmacies
Others
Countries Analyzed
North America (US, Canada, Mexico)
Europe (Germany, UK, France, Spain, Italy, Russia, Rest of Europe)
Asia Pacific (China, India, Japan, South Korea, Australia, South East Asia, Rest of Asia)
South America (Brazil, Argentina, Rest of South America)
Middle East and Africa (Saudi Arabia, UAE, Rest of Middle East, South Africa, Egypt, Rest of Africa)
CBD Consumer Products Companies Profiled in the Study
Charlotte's Web
CV Sciences Inc
Elixinol Global Ltd
ENDOCA
Isodiol International Inc
Joy Organics
Kazmira
Lord Jones
Medical Marijuana Inc
NuLeaf Naturals LLC
*- List Not Exhaustive
Chapter 1. TABLE OF CONTENTS
Chapter 2. Introduction to CBD Consumer Products Market
2.1. Market Overview
2.2. Key Statistics and Report Highlights
2.3. Scope of the Comprehensive Study
2.3.1. Market Definition
2.3.2 Countries and Regions Covered
2.3.3 Research Objective
2.3.4 Units, Currency, and Conversions
2.3.5 Industry Value Chain
2.4. Key Market Segments
2.5. Key Companies
2.6. Study Period
Chapter 3. Strategic Analysis Review
3.1. CBD Consumer Products Pricing Analysis and Forecast
3.2. Porter’s Five Forces
3.3. Market Ecosystem
3.4. SWOT Analysis
3.5. Regulatory Scenario
3.3. Effects of Inflation, Russia-Ukraine War, moderating economic growth, and other macroeconomic factors
Chapter 4. Competitive Landscape
4.1. Market Share Analysis
4.1.1. Global CBD Consumer Products Market Share by Company, 2023
4.1.2. Product Offerings of Leading CBD Consumer Products Companies
4.2. Market Entropy
4.2.1. New Product Launches in the Industry
4.2.2. Mergers, Acquisitions, Joint ventures, and Partnerships
4.3. Key Strategies and Best Practices
Chapter 5. Global Market Projections: Best, Reference, and Low Case Scenarios
5.1. Growth Analysis- Case Scenario Definitions
5.2. Low Growth Case Scenario Forecasts
5.3. Reference Growth Case Scenario Forecasts
5.4. High Growth Case Scenario Forecasts
Chapter 6. Market Dynamics
6.1. CBD Consumer Products Market Drivers
6.2. CBD Consumer Products Market Challenges
6.6. CBD Consumer Products Market Opportunities
6.4. CBD Consumer Products Market Trends
Chapter 7. Global CBD Consumer Products Market Outlook Trends
7.1. Global CBD Consumer Products Revenue (USD Million) and CAGR (%) by Type (2021-2032)
7.2. Global CBD Consumer Products Revenue (USD Million) and CAGR (%) by Application (2021-2032)
7.3. Global CBD Consumer Products Revenue (USD Million) and CAGR (%) by Product (2021-2032)
By Type
Medical OTC Products
Nutraceuticals
By Application
Online Stores
Retail Stores
Retail Pharmacies
Others
Chapter 8. Global CBD Consumer Products Regional Analysis and Outlook
8.1. Global CBD Consumer Products Revenue (USD Million) By Regions (2021- 2032)
8.2. North America CBD Consumer Products Revenue (USD Million) by Country (2021-2032)
8.2.1. United States CBD Consumer Products Regional Analysis and Outlook
8.2.2. Canada CBD Consumer Products Regional Analysis and Outlook
8.2.3. Mexico CBD Consumer Products Regional Analysis and Outlook
8.3. Europe CBD Consumer Products Revenue (USD Million), by Country (2021-2032)
8.3.1. Germany CBD Consumer Products Regional Analysis and Outlook
8.3.2. France CBD Consumer Products Regional Analysis and Outlook
8.3.3. United Kingdom CBD Consumer Products Regional Analysis and Outlook
8.3.4. Spain CBD Consumer Products Regional Analysis and Outlook
8.3.5. Italy CBD Consumer Products Regional Analysis and Outlook
8.3.6. Russia CBD Consumer Products Regional Analysis and Outlook
8.3.7. Rest of Europe CBD Consumer Products Regional Analysis and Outlook
8.4. Asia Pacific CBD Consumer Products Revenue (USD Million) by Country (2021-2032)
8.4.1. China CBD Consumer Products Regional Analysis and Outlook
8.4.2. Japan CBD Consumer Products Regional Analysis and Outlook
8.4.3. India CBD Consumer Products Regional Analysis and Outlook
8.4.4. South Korea CBD Consumer Products Regional Analysis and Outlook
8.4.5. Australia CBD Consumer Products Regional Analysis and Outlook
8.4.6. South East Asia CBD Consumer Products Regional Analysis and Outlook
8.4.7. Rest of Asia Pacific CBD Consumer Products Regional Analysis and Outlook
8.5. South America CBD Consumer Products Revenue (USD Million), by Country (2021-2032)
8.5.1. Brazil CBD Consumer Products Regional Analysis and Outlook
8.5.2. Argentina CBD Consumer Products Regional Analysis and Outlook
8.5.3. Rest of South America CBD Consumer Products Regional Analysis and Outlook
8.6. Middle East and Africa CBD Consumer Products Revenue (USD Million) by Country (2021-2032)
8.6.1. Middle East CBD Consumer Products Regional Analysis and Outlook
8.6.2. Africa CBD Consumer Products Regional Analysis and Outlook
Chapter 9. North America CBD Consumer Products Analysis and Outlook
9.1. North America CBD Consumer Products Revenue (USD Million) by Segments (2021-2032)
9.1.1. North America CBD Consumer Products Revenue (USD Million) by Type (2021-2032)
9.1.2. North America CBD Consumer Products Revenue (USD Million) by Application (2021-2032)
9.1.3. North America CBD Consumer Products Revenue (USD Million) by Product (2021-2032)
By Type
Medical OTC Products
Nutraceuticals
By Application
Online Stores
Retail Stores
Retail Pharmacies
Others
Chapter 10. Europe CBD Consumer Products Analysis and Outlook
10.1. Europe CBD Consumer Products Revenue (USD Million), by Segments (USD Million) (2021-2032)
10.1.1. Europe CBD Consumer Products Revenue (USD Million) by Type (2021-2032)
10.1.2. Europe CBD Consumer Products Revenue (USD Million) by Application (2021-2032)
10.1.3. Europe CBD Consumer Products Revenue (USD Million) by Product (2021-2032)
By Type
Medical OTC Products
Nutraceuticals
By Application
Online Stores
Retail Stores
Retail Pharmacies
Others
Chapter 11. Asia Pacific CBD Consumer Products Analysis and Outlook
11.1. Asia Pacific CBD Consumer Products Revenue (USD Million), and Revenue (USD Million) by Segments (2021-2032)
11.1.1. Asia Pacific CBD Consumer Products Revenue (USD Million) by Type (2021-2032)
11.1.2. Asia Pacific CBD Consumer Products Revenue (USD Million) by Application (2021-2032)
11.1.3. Asia Pacific CBD Consumer Products Revenue (USD Million) by Product (2021-2032)
By Type
Medical OTC Products
Nutraceuticals
By Application
Online Stores
Retail Stores
Retail Pharmacies
Others
Chapter 12. South America CBD Consumer Products Analysis and Outlook
12.1. South America CBD Consumer Products Revenue (USD Million), by Segments (2021-2032)
12.1.1. South America CBD Consumer Products Revenue (USD Million) by Type (2021-2032)
12.1.2. South America CBD Consumer Products Revenue (USD Million) by Application (2021-2032)
12.1.3. South America CBD Consumer Products Revenue (USD Million) by Product (2021-2032)
By Type
Medical OTC Products
Nutraceuticals
By Application
Online Stores
Retail Stores
Retail Pharmacies
Others
Chapter 13. Middle East and Africa CBD Consumer Products Analysis and Outlook
13.1. Middle East and Africa CBD Consumer Products Revenue (USD Million), by Segments (2021-2032)
13.1.1. Middle East and Africa CBD Consumer Products Revenue (USD Million) by Type (2021-2032)
13.1.2. Middle East and Africa CBD Consumer Products Revenue (USD Million) by Application (2021-2032)
13.1.3. Middle East and Africa CBD Consumer Products Revenue (USD Million) by Product (2021-2032)
By Type
Medical OTC Products
Nutraceuticals
By Application
Online Stores
Retail Stores
Retail Pharmacies
Others
Chapter 14. CBD Consumer Products Company Profiles
14.1 Business Overview
14.2 Product Profiles
14.3 SWOT Profiles
14.5 Recent Developments
14.6 Financial Profile
List of Companies
Charlotte's Web
CV Sciences Inc
Elixinol Global Ltd
ENDOCA
Isodiol International Inc
Joy Organics
Kazmira
Lord Jones
Medical Marijuana Inc
NuLeaf Naturals LLC
15. Methodology and Data Sources
15.1 Customization Offerings
15.2 Subscription Services
15.3 Related Reports
15.4 Publisher Expertise
LIST OF TABLES
Table 1 Market Segmentation Analysis
Table 2 Global CBD Consumer Products Market Share of Leading Companies, 2023
Table 3 Product Offerings of Leading Companies
Table 4 Low Growth Scenario Forecasts
Table 5 Reference Case Growth Scenario
Table 6 High Growth Case Scenario
Table 7 Global CBD Consumer Products Revenue (USD Million) And CAGR (%) By Type (2021-2032)
Table 8 Global CBD Consumer Products Revenue (USD Million) And CAGR (%) By Application (2021-2032)
Table 9 Global CBD Consumer Products Revenue (USD Million) And CAGR (%) By Product (2021-2032)
Table 10 Global CBD Consumer Products Market Revenue (USD Million) By Regions (2021-2032)
Table 11 Global CBD Consumer Products Market Share (%) By Regions (2021-2032)
Table 12 North America CBD Consumer Products Revenue (USD Million) By Country (2021-2032)
Table 13 Europe CBD Consumer Products Revenue (USD Million) By Country (2021-2032)
Table 14 Asia Pacific CBD Consumer Products Revenue (USD Million) By Country (2021-2032)
Table 15 South America CBD Consumer Products Revenue (USD Million) By Country (2021-2032)
Table 16 Middle East and Africa CBD Consumer Products Revenue (USD Million) By Region (2021-2032)
Table 17 North America CBD Consumer Products Revenue (USD Million) By Type (2021-2032)
Table 18 North America CBD Consumer Products Revenue (USD Million) By Application (2021-2032)
Table 19 North America CBD Consumer Products Revenue (USD Million) By Product (2021-2032)
Table 20 Europe CBD Consumer Products Revenue (USD Million) By Type (2021-2032)
Table 21 Europe CBD Consumer Products Revenue (USD Million) By Application (2021-2032)
Table 22 Europe CBD Consumer Products Revenue (USD Million) By Product (2021-2032)
Table 23 Asia Pacific CBD Consumer Products Revenue (USD Million) By Type (2021-2032)
Table 24 Asia Pacific CBD Consumer Products Revenue (USD Million) By Application (2021-2032)
Table 25 Asia Pacific CBD Consumer Products Revenue (USD Million) By Product (2021-2032)
Table 26 South America CBD Consumer Products Revenue (USD Million) By Type (2021-2032)
Table 27 South America CBD Consumer Products Revenue (USD Million) By Application (2021-2032)
Table 28 South America CBD Consumer Products Revenue (USD Million) By Product (2021-2032)
Table 29 Middle East and Africa CBD Consumer Products Revenue (USD Million) By Type (2021-2032)
Table 30 Middle East and Africa CBD Consumer Products Revenue (USD Million) By Application (2021-2032)
Table 31 Middle East and Africa CBD Consumer Products Revenue (USD Million) By Product (2021-2032)
LIST OF FIGURES
Figure 1. Market Scope
Figure 2. Pricing Forecasts Per Unit, 2023- 2032
Figure 3. Porter’s Five Forces
Figure 4. Global CBD Consumer Products Market Revenue (USD Million) By Regions (2021-2032)
Figure 5. Global CBD Consumer Products Market Share (%) By Regions (2023)
Figure 6. North America CBD Consumer Products Revenue (USD Million) By Country (2021-2032)
Figure 7. United States CBD Consumer Products Revenue (USD Million) By Country (2021-2032)
Figure 8. Canada CBD Consumer Products Revenue (USD Million) By Country (2021-2032)
Figure 9. Mexico CBD Consumer Products Revenue (USD Million) By Country (2021-2032)
Figure 10. Europe CBD Consumer Products Revenue (USD Million) By Country (2021-2032)
Figure 11. Germany CBD Consumer Products Revenue (USD Million) By Country (2021-2032)
Figure 12. France CBD Consumer Products Revenue (USD Million) By Country (2021-2032)
Figure 13. United Kingdom CBD Consumer Products Revenue (USD Million) By Country (2021-2032)
Figure 14. Spain CBD Consumer Products Revenue (USD Million) By Country (2021-2032)
Figure 15. Italy CBD Consumer Products Revenue (USD Million) By Country (2021-2032)
Figure 16. Russia CBD Consumer Products Revenue (USD Million) By Country (2021-2032)
Figure 17. Rest of Europe CBD Consumer Products Revenue (USD Million) By Country (2021-2032)
Figure 11. Asia Pacific CBD Consumer Products Revenue (USD Million) By Country (2021-2032)
Figure 12. China CBD Consumer Products Revenue (USD Million) By Country (2021-2032)
Figure 13. Japan CBD Consumer Products Revenue (USD Million) By Country (2021-2032)
Figure 14. India CBD Consumer Products Revenue (USD Million) By Country (2021-2032)
Figure 15. South Korea CBD Consumer Products Revenue (USD Million) By Country (2021-2032)
Figure 16. Australia CBD Consumer Products Revenue (USD Million) By Country (2021-2032)
Figure 17. South East Asia CBD Consumer Products Revenue (USD Million) By Country (2021-2032)
Figure 18. South America CBD Consumer Products Revenue (USD Million) By Country (2021-2032)
Figure 19. Brazil CBD Consumer Products Revenue (USD Million) By Country (2021-2032)
Figure 20. Argentina CBD Consumer Products Revenue (USD Million) By Country (2021-2032)
Figure 21. Rest of Asia Pacific CBD Consumer Products Revenue (USD Million) By Country (2021-2032)
Figure 22. Middle East and Africa CBD Consumer Products Revenue (USD Million) By Region (2021-2032)
Figure 23. Saudi Arabia CBD Consumer Products Revenue (USD Million) By Region (2021-2032)
Figure 24. The UAE CBD Consumer Products Revenue (USD Million) By Region (2021-2032)
Figure 25. Rest of Middle East CBD Consumer Products Revenue (USD Million) By Region (2021-2032)
Figure 26. South Africa CBD Consumer Products Revenue (USD Million) By Region (2021-2032)
Figure 27. Africa CBD Consumer Products Revenue (USD Million) By Region (2021-2032)
Figure 28. North America CBD Consumer Products Revenue (USD Million) By Type (2021-2032)
Figure 29. North America CBD Consumer Products Revenue (USD Million) By Application (2021-2032)
Figure 30. North America CBD Consumer Products Revenue (USD Million) By Product (2021-2032)
Figure 31. Europe CBD Consumer Products Revenue (USD Million) By Type (2021-2032)
Figure 32. Europe CBD Consumer Products Revenue (USD Million) By Application (2021-2032)
Figure 33. Europe CBD Consumer Products Revenue (USD Million) By Product (2021-2032)
Figure 34. Asia Pacific CBD Consumer Products Revenue (USD Million) By Type (2021-2032)
Figure 35. Asia Pacific CBD Consumer Products Revenue (USD Million) By Application (2021-2032)
Figure 36. Asia Pacific CBD Consumer Products Revenue (USD Million) By Product (2021-2032)
Figure 37. South America CBD Consumer Products Revenue (USD Million) By Type (2021-2032)
Figure 38. South America CBD Consumer Products Revenue (USD Million) By Application (2021-2032)
Figure 39. South America CBD Consumer Products Revenue (USD Million) By Product (2021-2032)
Figure 40. Middle East and Africa CBD Consumer Products Revenue (USD Million) By Type (2021-2032)
Figure 41. Middle East and Africa CBD Consumer Products Revenue (USD Million) By Application (2021-2032)
Figure 42. Middle East and Africa CBD Consumer Products Revenue (USD Million) By Product (2021-2032)
By Type
Medical OTC Products
Nutraceuticals
By Application
Online Stores
Retail Stores
Retail Pharmacies
Others
Countries Analyzed
North America (US, Canada, Mexico)
Europe (Germany, UK, France, Spain, Italy, Russia, Rest of Europe)
Asia Pacific (China, India, Japan, South Korea, Australia, South East Asia, Rest of Asia)
South America (Brazil, Argentina, Rest of South America)
Middle East and Africa (Saudi Arabia, UAE, Rest of Middle East, South Africa, Egypt, Rest of Africa)
