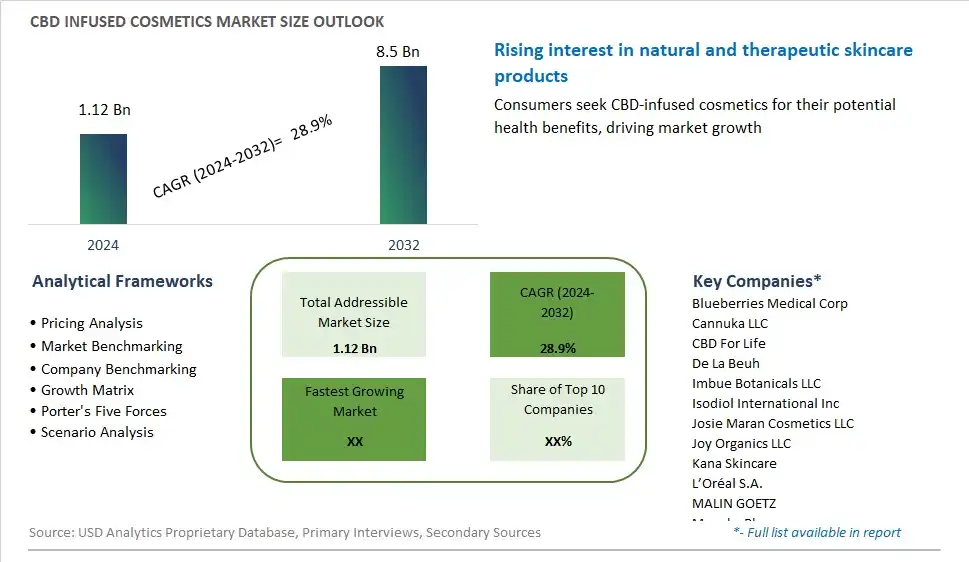
Global CBD Infused Cosmetics Market Size is valued at $1.12 Billion in 2024 and is forecast to register a growth rate (CAGR) of 28.9% to reach $8.5 Billion by 2032.
The global CBD Infused Cosmetics Market Comprehensive Study analyzes and forecasts the market size across 6 regions and 24 countries for diverse segments -By Source (Hemp, Marijuana), By Product (Skincare, Makeup and haircare, Fragrances, Others)
An Introduction to CBD Infused Cosmetics Market
CBD-infused cosmetics represent a growing trend in the beauty and personal care industry in 2024, harnessing the potential benefits of cannabidiol for skin health and wellness. Derived from hemp plants, CBD is prized for its anti-inflammatory, antioxidant, and calming properties, making it a sought-after ingredient in skincare formulations. From serums and creams to masks and lip balms, CBD-infused cosmetics claim to soothe irritation, reduce redness, and promote a clear and radiant complexion. With an increasing emphasis on natural and plant-based ingredients, CBD cosmetics appeal to consumers seeking clean, effective, and holistic solutions for their skincare concerns, reflecting a convergence of wellness and beauty in the beauty market.
CBD Infused Cosmetics Competitive Landscape
The market report analyses the leading companies in the industry including Blueberries Medical Corp, Cannuka LLC, CBD For Life, De La Beuh, Imbue Botanicals LLC, Isodiol International Inc, Josie Maran Cosmetics LLC, Joy Organics LLC, Kana Skincare, L’Oréal S.A., MALIN GOETZ, Manuka Pharm, Medical Marijuana Inc, The CBD Skincare Co, The Estee Lauder Companies Inc, Unilever PLC, Vertly LLC, and Others.
CBD Infused Cosmetics Market Dynamics
CBD Infused Cosmetics Market Trend: Surge in Demand for Natural and Wellness-Focused Beauty Products
The market trend for CBD Infused Cosmetics reflects a surge in demand for natural and wellness-focused beauty products. As consumers increasingly prioritize clean beauty and holistic self-care practices, there's a growing interest in skincare and cosmetics infused with cannabidiol (CBD) derived from hemp plants. CBD is renowned for its potential therapeutic benefits, including anti-inflammatory, antioxidant, and calming properties, making it a sought-after ingredient in skincare and cosmetics. This trend is driven by the desire for effective yet gentle skincare solutions that promote skin health and overall well-being, aligning with the growing consumer preference for clean, natural, and plant-based beauty products.
Market Driver: Shift Towards Cannabis Legalization and Acceptance
A significant driver of the CBD Infused Cosmetics market is the shift towards cannabis legalization and acceptance in various regions worldwide. As regulatory restrictions surrounding cannabis-derived products continue to evolve, there's greater accessibility and acceptance of CBD-infused skincare and cosmetics among consumers. This driver is fueled by changing attitudes towards cannabis and CBD, as well as increasing scientific research supporting their potential benefits for skin health and beauty. With the legalization of hemp-derived CBD products in many countries, companies have the opportunity to leverage the growing acceptance of CBD and tap into a burgeoning market for cannabis-infused beauty products.
Market Opportunity: Innovation in Formulations and Product Offerings
An opportunity in the CBD Infused Cosmetics market lies in innovation in formulations and product offerings to cater to diverse consumer needs and preferences. While CBD has gained popularity in skincare, there's potential to expand its usage across various cosmetic categories, including makeup, haircare, and body care. Companies can explore opportunities to develop innovative CBD-infused cosmetics with advanced formulations that address specific skin concerns such as aging, acne, and sensitivity, while delivering the therapeutic benefits of CBD. Additionally, incorporating CBD into trendy and niche beauty products, such as serums, masks, lip balms, and hair treatments, can appeal to discerning consumers seeking cutting-edge skincare and beauty solutions. By investing in research and development and staying abreast of emerging trends, companies can capitalize on the growing demand for CBD-infused cosmetics and establish a competitive edge in the dynamic beauty market.
CBD Infused Cosmetics Market Share Analysis: Hemp held the dominant market share in 2024
In the burgeoning realm of CBD infused cosmetics, the Hemp segment is the largest, commanding prominence due to its widespread availability, legal status, and versatility in skincare formulations. Hemp-derived CBD offers numerous skincare benefits, including anti-inflammatory, antioxidant, and moisturizing properties, making it a sought-after ingredient in cosmetics and skincare products. Additionally, hemp-derived CBD contains negligible levels of THC, the psychoactive compound found in marijuana, ensuring compliance with legal regulations and safety standards. The growing consumer interest in natural and plant-based skincare solutions further propels the demand for hemp-derived CBD infused cosmetics. Further, the sustainability and eco-friendliness of hemp cultivation appeal to environmentally conscious consumers seeking ethical and sustainable beauty products. As consumers continue to prioritize wellness and clean beauty, the Hemp segment of the CBD infused cosmetics market remains at the forefront, shaping consumer preferences and driving market growth.
CBD Infused Cosmetics Market Share Analysis: Skincare market is poised to register the fastest growth rae over the forecast period to 2032
Among the segments of the CBD infused cosmetics market, Skincare is the fastest-growing segment, driven by increasing consumer demand for natural, effective, and multi-functional skincare products. CBD-infused skincare products offer a range of benefits, including anti-inflammatory, antioxidant, and soothing properties, making them ideal for addressing various skin concerns such as acne, inflammation, and aging. The versatility of CBD allows for its incorporation into various skincare formulations, including serums, creams, masks, and cleansers, catering to diverse skin types and concerns. Further, the growing awareness of CBD's potential therapeutic benefits and its ability to promote skin health and wellness further propels the demand for CBD-infused skincare products. Additionally, the clean beauty movement and the shift towards natural and plant-based ingredients drive consumer preference for skincare products that are free from harsh chemicals and artificial additives. As consumers prioritize skincare as an essential aspect of their self-care routines, the Skincare segment of the CBD infused cosmetics market stands poised for continued expansion, reshaping the landscape of the beauty industry.
CBD Infused Cosmetics Market Segmentation
By Source
Hemp
Marijuana
By Product
Skincare
Make up and haircare
Fragrances
Others
Countries Analyzed
North America (US, Canada, Mexico)
Europe (Germany, UK, France, Spain, Italy, Russia, Rest of Europe)
Asia Pacific (China, India, Japan, South Korea, Australia, South East Asia, Rest of Asia)
South America (Brazil, Argentina, Rest of South America)
Middle East and Africa (Saudi Arabia, UAE, Rest of Middle East, South Africa, Egypt, Rest of Africa)
CBD Infused Cosmetics Companies Profiled in the Study
Blueberries Medical Corp
Cannuka LLC
CBD For Life
De La Beuh
Imbue Botanicals LLC
Isodiol International Inc
Josie Maran Cosmetics LLC
Joy Organics LLC
Kana Skincare
L’Oréal S.A.
MALIN GOETZ
Manuka Pharm
Medical Marijuana Inc
The CBD Skincare Co
The Estee Lauder Companies Inc
Unilever PLC
Vertly LLC
*- List Not Exhaustive
Chapter 1. TABLE OF CONTENTS
Chapter 2. Introduction to CBD Infused Cosmetics Market
2.1. Market Overview
2.2. Key Statistics and Report Highlights
2.3. Scope of the Comprehensive Study
2.3.1. Market Definition
2.3.2 Countries and Regions Covered
2.3.3 Research Objective
2.3.4 Units, Currency, and Conversions
2.3.5 Industry Value Chain
2.4. Key Market Segments
2.5. Key Companies
2.6. Study Period
Chapter 3. Strategic Analysis Review
3.1. CBD Infused Cosmetics Pricing Analysis and Forecast
3.2. Porter’s Five Forces
3.3. Market Ecosystem
3.4. SWOT Analysis
3.5. Regulatory Scenario
3.3. Effects of Inflation, Russia-Ukraine War, moderating economic growth, and other macroeconomic factors
Chapter 4. Competitive Landscape
4.1. Market Share Analysis
4.1.1. Global CBD Infused Cosmetics Market Share by Company, 2023
4.1.2. Product Offerings of Leading CBD Infused Cosmetics Companies
4.2. Market Entropy
4.2.1. New Product Launches in the Industry
4.2.2. Mergers, Acquisitions, Joint ventures, and Partnerships
4.3. Key Strategies and Best Practices
Chapter 5. Global Market Projections: Best, Reference, and Low Case Scenarios
5.1. Growth Analysis- Case Scenario Definitions
5.2. Low Growth Case Scenario Forecasts
5.3. Reference Growth Case Scenario Forecasts
5.4. High Growth Case Scenario Forecasts
Chapter 6. Market Dynamics
6.1. CBD Infused Cosmetics Market Drivers
6.2. CBD Infused Cosmetics Market Challenges
6.6. CBD Infused Cosmetics Market Opportunities
6.4. CBD Infused Cosmetics Market Trends
Chapter 7. Global CBD Infused Cosmetics Market Outlook Trends
7.1. Global CBD Infused Cosmetics Revenue (USD Million) and CAGR (%) by Type (2021-2032)
7.2. Global CBD Infused Cosmetics Revenue (USD Million) and CAGR (%) by Application (2021-2032)
7.3. Global CBD Infused Cosmetics Revenue (USD Million) and CAGR (%) by Product (2021-2032)
By Source
Hemp
Marijuana
By Product
Skincare
Make up and haircare
Fragrances
Others
Chapter 8. Global CBD Infused Cosmetics Regional Analysis and Outlook
8.1. Global CBD Infused Cosmetics Revenue (USD Million) By Regions (2021- 2032)
8.2. North America CBD Infused Cosmetics Revenue (USD Million) by Country (2021-2032)
8.2.1. United States CBD Infused Cosmetics Regional Analysis and Outlook
8.2.2. Canada CBD Infused Cosmetics Regional Analysis and Outlook
8.2.3. Mexico CBD Infused Cosmetics Regional Analysis and Outlook
8.3. Europe CBD Infused Cosmetics Revenue (USD Million), by Country (2021-2032)
8.3.1. Germany CBD Infused Cosmetics Regional Analysis and Outlook
8.3.2. France CBD Infused Cosmetics Regional Analysis and Outlook
8.3.3. United Kingdom CBD Infused Cosmetics Regional Analysis and Outlook
8.3.4. Spain CBD Infused Cosmetics Regional Analysis and Outlook
8.3.5. Italy CBD Infused Cosmetics Regional Analysis and Outlook
8.3.6. Russia CBD Infused Cosmetics Regional Analysis and Outlook
8.3.7. Rest of Europe CBD Infused Cosmetics Regional Analysis and Outlook
8.4. Asia Pacific CBD Infused Cosmetics Revenue (USD Million) by Country (2021-2032)
8.4.1. China CBD Infused Cosmetics Regional Analysis and Outlook
8.4.2. Japan CBD Infused Cosmetics Regional Analysis and Outlook
8.4.3. India CBD Infused Cosmetics Regional Analysis and Outlook
8.4.4. South Korea CBD Infused Cosmetics Regional Analysis and Outlook
8.4.5. Australia CBD Infused Cosmetics Regional Analysis and Outlook
8.4.6. South East Asia CBD Infused Cosmetics Regional Analysis and Outlook
8.4.7. Rest of Asia Pacific CBD Infused Cosmetics Regional Analysis and Outlook
8.5. South America CBD Infused Cosmetics Revenue (USD Million), by Country (2021-2032)
8.5.1. Brazil CBD Infused Cosmetics Regional Analysis and Outlook
8.5.2. Argentina CBD Infused Cosmetics Regional Analysis and Outlook
8.5.3. Rest of South America CBD Infused Cosmetics Regional Analysis and Outlook
8.6. Middle East and Africa CBD Infused Cosmetics Revenue (USD Million) by Country (2021-2032)
8.6.1. Middle East CBD Infused Cosmetics Regional Analysis and Outlook
8.6.2. Africa CBD Infused Cosmetics Regional Analysis and Outlook
Chapter 9. North America CBD Infused Cosmetics Analysis and Outlook
9.1. North America CBD Infused Cosmetics Revenue (USD Million) by Segments (2021-2032)
9.1.1. North America CBD Infused Cosmetics Revenue (USD Million) by Type (2021-2032)
9.1.2. North America CBD Infused Cosmetics Revenue (USD Million) by Application (2021-2032)
9.1.3. North America CBD Infused Cosmetics Revenue (USD Million) by Product (2021-2032)
By Source
Hemp
Marijuana
By Product
Skincare
Make up and haircare
Fragrances
Others
Chapter 10. Europe CBD Infused Cosmetics Analysis and Outlook
10.1. Europe CBD Infused Cosmetics Revenue (USD Million), by Segments (USD Million) (2021-2032)
10.1.1. Europe CBD Infused Cosmetics Revenue (USD Million) by Type (2021-2032)
10.1.2. Europe CBD Infused Cosmetics Revenue (USD Million) by Application (2021-2032)
10.1.3. Europe CBD Infused Cosmetics Revenue (USD Million) by Product (2021-2032)
By Source
Hemp
Marijuana
By Product
Skincare
Make up and haircare
Fragrances
Others
Chapter 11. Asia Pacific CBD Infused Cosmetics Analysis and Outlook
11.1. Asia Pacific CBD Infused Cosmetics Revenue (USD Million), and Revenue (USD Million) by Segments (2021-2032)
11.1.1. Asia Pacific CBD Infused Cosmetics Revenue (USD Million) by Type (2021-2032)
11.1.2. Asia Pacific CBD Infused Cosmetics Revenue (USD Million) by Application (2021-2032)
11.1.3. Asia Pacific CBD Infused Cosmetics Revenue (USD Million) by Product (2021-2032)
By Source
Hemp
Marijuana
By Product
Skincare
Make up and haircare
Fragrances
Others
Chapter 12. South America CBD Infused Cosmetics Analysis and Outlook
12.1. South America CBD Infused Cosmetics Revenue (USD Million), by Segments (2021-2032)
12.1.1. South America CBD Infused Cosmetics Revenue (USD Million) by Type (2021-2032)
12.1.2. South America CBD Infused Cosmetics Revenue (USD Million) by Application (2021-2032)
12.1.3. South America CBD Infused Cosmetics Revenue (USD Million) by Product (2021-2032)
By Source
Hemp
Marijuana
By Product
Skincare
Make up and haircare
Fragrances
Others
Chapter 13. Middle East and Africa CBD Infused Cosmetics Analysis and Outlook
13.1. Middle East and Africa CBD Infused Cosmetics Revenue (USD Million), by Segments (2021-2032)
13.1.1. Middle East and Africa CBD Infused Cosmetics Revenue (USD Million) by Type (2021-2032)
13.1.2. Middle East and Africa CBD Infused Cosmetics Revenue (USD Million) by Application (2021-2032)
13.1.3. Middle East and Africa CBD Infused Cosmetics Revenue (USD Million) by Product (2021-2032)
By Source
Hemp
Marijuana
By Product
Skincare
Make up and haircare
Fragrances
Others
Chapter 14. CBD Infused Cosmetics Company Profiles
14.1 Business Overview
14.2 Product Profiles
14.3 SWOT Profiles
14.5 Recent Developments
14.6 Financial Profile
List of Companies
Blueberries Medical Corp
Cannuka LLC
CBD For Life
De La Beuh
Imbue Botanicals LLC
Isodiol International Inc
Josie Maran Cosmetics LLC
Joy Organics LLC
Kana Skincare
L’Oréal S.A.
MALIN GOETZ
Manuka Pharm
Medical Marijuana Inc
The CBD Skincare Co
The Estee Lauder Companies Inc
Unilever PLC
Vertly LLC
15. Methodology and Data Sources
15.1 Customization Offerings
15.2 Subscription Services
15.3 Related Reports
15.4 Publisher Expertise
LIST OF TABLES
Table 1 Market Segmentation Analysis
Table 2 Global CBD Infused Cosmetics Market Share of Leading Companies, 2023
Table 3 Product Offerings of Leading Companies
Table 4 Low Growth Scenario Forecasts
Table 5 Reference Case Growth Scenario
Table 6 High Growth Case Scenario
Table 7 Global CBD Infused Cosmetics Revenue (USD Million) And CAGR (%) By Type (2021-2032)
Table 8 Global CBD Infused Cosmetics Revenue (USD Million) And CAGR (%) By Application (2021-2032)
Table 9 Global CBD Infused Cosmetics Revenue (USD Million) And CAGR (%) By Product (2021-2032)
Table 10 Global CBD Infused Cosmetics Market Revenue (USD Million) By Regions (2021-2032)
Table 11 Global CBD Infused Cosmetics Market Share (%) By Regions (2021-2032)
Table 12 North America CBD Infused Cosmetics Revenue (USD Million) By Country (2021-2032)
Table 13 Europe CBD Infused Cosmetics Revenue (USD Million) By Country (2021-2032)
Table 14 Asia Pacific CBD Infused Cosmetics Revenue (USD Million) By Country (2021-2032)
Table 15 South America CBD Infused Cosmetics Revenue (USD Million) By Country (2021-2032)
Table 16 Middle East and Africa CBD Infused Cosmetics Revenue (USD Million) By Region (2021-2032)
Table 17 North America CBD Infused Cosmetics Revenue (USD Million) By Type (2021-2032)
Table 18 North America CBD Infused Cosmetics Revenue (USD Million) By Application (2021-2032)
Table 19 North America CBD Infused Cosmetics Revenue (USD Million) By Product (2021-2032)
Table 20 Europe CBD Infused Cosmetics Revenue (USD Million) By Type (2021-2032)
Table 21 Europe CBD Infused Cosmetics Revenue (USD Million) By Application (2021-2032)
Table 22 Europe CBD Infused Cosmetics Revenue (USD Million) By Product (2021-2032)
Table 23 Asia Pacific CBD Infused Cosmetics Revenue (USD Million) By Type (2021-2032)
Table 24 Asia Pacific CBD Infused Cosmetics Revenue (USD Million) By Application (2021-2032)
Table 25 Asia Pacific CBD Infused Cosmetics Revenue (USD Million) By Product (2021-2032)
Table 26 South America CBD Infused Cosmetics Revenue (USD Million) By Type (2021-2032)
Table 27 South America CBD Infused Cosmetics Revenue (USD Million) By Application (2021-2032)
Table 28 South America CBD Infused Cosmetics Revenue (USD Million) By Product (2021-2032)
Table 29 Middle East and Africa CBD Infused Cosmetics Revenue (USD Million) By Type (2021-2032)
Table 30 Middle East and Africa CBD Infused Cosmetics Revenue (USD Million) By Application (2021-2032)
Table 31 Middle East and Africa CBD Infused Cosmetics Revenue (USD Million) By Product (2021-2032)
LIST OF FIGURES
Figure 1. Market Scope
Figure 2. Pricing Forecasts Per Unit, 2023- 2032
Figure 3. Porter’s Five Forces
Figure 4. Global CBD Infused Cosmetics Market Revenue (USD Million) By Regions (2021-2032)
Figure 5. Global CBD Infused Cosmetics Market Share (%) By Regions (2023)
Figure 6. North America CBD Infused Cosmetics Revenue (USD Million) By Country (2021-2032)
Figure 7. United States CBD Infused Cosmetics Revenue (USD Million) By Country (2021-2032)
Figure 8. Canada CBD Infused Cosmetics Revenue (USD Million) By Country (2021-2032)
Figure 9. Mexico CBD Infused Cosmetics Revenue (USD Million) By Country (2021-2032)
Figure 10. Europe CBD Infused Cosmetics Revenue (USD Million) By Country (2021-2032)
Figure 11. Germany CBD Infused Cosmetics Revenue (USD Million) By Country (2021-2032)
Figure 12. France CBD Infused Cosmetics Revenue (USD Million) By Country (2021-2032)
Figure 13. United Kingdom CBD Infused Cosmetics Revenue (USD Million) By Country (2021-2032)
Figure 14. Spain CBD Infused Cosmetics Revenue (USD Million) By Country (2021-2032)
Figure 15. Italy CBD Infused Cosmetics Revenue (USD Million) By Country (2021-2032)
Figure 16. Russia CBD Infused Cosmetics Revenue (USD Million) By Country (2021-2032)
Figure 17. Rest of Europe CBD Infused Cosmetics Revenue (USD Million) By Country (2021-2032)
Figure 11. Asia Pacific CBD Infused Cosmetics Revenue (USD Million) By Country (2021-2032)
Figure 12. China CBD Infused Cosmetics Revenue (USD Million) By Country (2021-2032)
Figure 13. Japan CBD Infused Cosmetics Revenue (USD Million) By Country (2021-2032)
Figure 14. India CBD Infused Cosmetics Revenue (USD Million) By Country (2021-2032)
Figure 15. South Korea CBD Infused Cosmetics Revenue (USD Million) By Country (2021-2032)
Figure 16. Australia CBD Infused Cosmetics Revenue (USD Million) By Country (2021-2032)
Figure 17. South East Asia CBD Infused Cosmetics Revenue (USD Million) By Country (2021-2032)
Figure 18. South America CBD Infused Cosmetics Revenue (USD Million) By Country (2021-2032)
Figure 19. Brazil CBD Infused Cosmetics Revenue (USD Million) By Country (2021-2032)
Figure 20. Argentina CBD Infused Cosmetics Revenue (USD Million) By Country (2021-2032)
Figure 21. Rest of Asia Pacific CBD Infused Cosmetics Revenue (USD Million) By Country (2021-2032)
Figure 22. Middle East and Africa CBD Infused Cosmetics Revenue (USD Million) By Region (2021-2032)
Figure 23. Saudi Arabia CBD Infused Cosmetics Revenue (USD Million) By Region (2021-2032)
Figure 24. The UAE CBD Infused Cosmetics Revenue (USD Million) By Region (2021-2032)
Figure 25. Rest of Middle East CBD Infused Cosmetics Revenue (USD Million) By Region (2021-2032)
Figure 26. South Africa CBD Infused Cosmetics Revenue (USD Million) By Region (2021-2032)
Figure 27. Africa CBD Infused Cosmetics Revenue (USD Million) By Region (2021-2032)
Figure 28. North America CBD Infused Cosmetics Revenue (USD Million) By Type (2021-2032)
Figure 29. North America CBD Infused Cosmetics Revenue (USD Million) By Application (2021-2032)
Figure 30. North America CBD Infused Cosmetics Revenue (USD Million) By Product (2021-2032)
Figure 31. Europe CBD Infused Cosmetics Revenue (USD Million) By Type (2021-2032)
Figure 32. Europe CBD Infused Cosmetics Revenue (USD Million) By Application (2021-2032)
Figure 33. Europe CBD Infused Cosmetics Revenue (USD Million) By Product (2021-2032)
Figure 34. Asia Pacific CBD Infused Cosmetics Revenue (USD Million) By Type (2021-2032)
Figure 35. Asia Pacific CBD Infused Cosmetics Revenue (USD Million) By Application (2021-2032)
Figure 36. Asia Pacific CBD Infused Cosmetics Revenue (USD Million) By Product (2021-2032)
Figure 37. South America CBD Infused Cosmetics Revenue (USD Million) By Type (2021-2032)
Figure 38. South America CBD Infused Cosmetics Revenue (USD Million) By Application (2021-2032)
Figure 39. South America CBD Infused Cosmetics Revenue (USD Million) By Product (2021-2032)
Figure 40. Middle East and Africa CBD Infused Cosmetics Revenue (USD Million) By Type (2021-2032)
Figure 41. Middle East and Africa CBD Infused Cosmetics Revenue (USD Million) By Application (2021-2032)
Figure 42. Middle East and Africa CBD Infused Cosmetics Revenue (USD Million) By Product (2021-2032)
By Source
Hemp
Marijuana
By Product
Skincare
Make up and haircare
Fragrances
Others
Countries Analyzed
North America (US, Canada, Mexico)
Europe (Germany, UK, France, Spain, Italy, Russia, Rest of Europe)
Asia Pacific (China, India, Japan, South Korea, Australia, South East Asia, Rest of Asia)
South America (Brazil, Argentina, Rest of South America)
Middle East and Africa (Saudi Arabia, UAE, Rest of Middle East, South Africa, Egypt, Rest of Africa)
