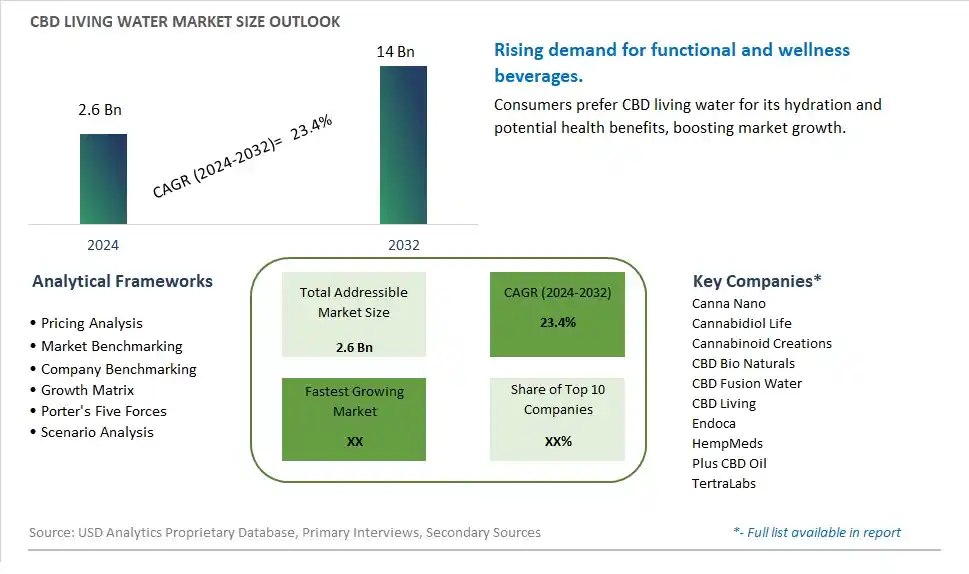
Global CBD Living Water Market Size is valued at $2.6 Billion in 2024 and is forecast to register a growth rate (CAGR) of 23.4% to reach $14 Billion by 2032.
The global CBD Living Water Market Comprehensive Study analyzes and forecasts the market size across 6 regions and 24 countries for diverse segments -By Type (Pure CBD Water, Mixed CBD Water), By Sales Channel (Online, Offline)
An Introduction to CBD Living Water Market
The CBD Living Water market in 2024 is expanding rapidly, driven by the increasing demand for functional beverages that offer both hydration and health benefits. CBD living water, infused with cannabidiol and designed for optimal absorption, is popular for its potential to promote relaxation, reduce inflammation, and improve overall well-being. The market is supported by the growing trend towards wellness and natural health products. Advances in water infusion and nanoemulsion technologies are enhancing the bioavailability and stability of CBD in beverages. The market is also benefiting from the trend towards clean-label and functional drinks, appealing to health-conscious consumers seeking convenient and effective wellness solutions.
CBD Living Water Competitive Landscape
The market report analyses the leading companies in the industry including Canna Nano, Cannabidiol Life, Cannabinoid Creations, CBD Bio Naturals, CBD Fusion Water, CBD Living, Endoca, HempMeds, Plus CBD Oil, TertraLabs, and Others.
CBD Living Water Market Dynamics
CBD Living Water Market Trend: Increasing Demand for CBD-infused Beverages
The most prominent market trend for CBD Living Water is the increasing demand for CBD-infused beverages. As consumers become more health-conscious and seek alternative wellness solutions, there is a growing interest in functional beverages that offer the potential benefits of CBD, such as relaxation, stress relief, and anti-inflammatory properties. This trend is driven by a shift towards natural ingredients and holistic approaches to health and wellness.
CBD Living Water Market Driver: Health and Wellness Trends
A key market driver for CBD Living Water is the overarching health and wellness trends influencing consumer choices. People are actively seeking products that not only quench their thirst but also provide additional health benefits. CBD-infused beverages, like CBD Living Water, align with these trends by offering a convenient way to consume CBD while staying hydrated. The appeal also extends to athletes and fitness enthusiasts looking for natural recovery aids and performance enhancers.
CBD Living Water Market Opportunity: Diversification and Product Innovation
An opportunity within the CBD Living Water market lies in diversification and product innovation. Manufacturers can explore different CBD concentrations, flavor profiles, and packaging options to cater to diverse consumer preferences. Collaborations with health experts or endorsements from wellness influencers can also enhance credibility and trust among consumers. Furthermore, educating consumers about the potential benefits of CBD and highlighting the quality and purity of CBD-infused water can further expand market reach and consumer adoption.
CBD Living Water Market Share Analysis: Pure CBD Water segment generated the highest revenue share in the industry
Pure CBD Water is the largest segment in the CBD Living Water market by type. This dominance is primarily due to its straightforward formulation, which appeals to consumers looking for a simple and effective way to consume CBD. Pure CBD Water contains only water infused with cannabidiol (CBD), without any additional flavors or additives, making it an attractive option for those who want to avoid extra ingredients. The market's preference for pure formulations is driven by the increasing health consciousness among consumers, who are seeking clean, natural products with clear health benefits. Pure CBD Water is often perceived as a more authentic and potent form of CBD consumption, as it provides the therapeutic benefits of CBD without potential interference from other compounds. Additionally, the growing body of research supporting the efficacy of CBD in managing conditions such as anxiety, inflammation, and pain contributes to the rising demand for pure CBD products. As a result, Pure CBD Water continues to lead the market, with its simplicity and perceived purity driving consumer preference and market growth.
CBD Living Water Market Share Analysis: Online is the fastest growing segment over the forecast period to 2032
The Online segment is expected to be the fastest growing in the CBD Living Water market by sales channel through 2032. This growth is driven by the increasing shift towards e-commerce for purchasing CBD products, including CBD Living Water. Online sales channels offer convenience, accessibility, and a wider range of product choices, making them highly attractive to consumers seeking CBD products. Further, the online marketplace provides a platform for CBD brands to reach a global audience without the limitations of physical retail presence. The Past few yearsfurther accelerated this trend as consumers turned to online shopping for safety and convenience. Additionally, digital marketing strategies and the availability of information online have boosted consumer confidence in purchasing CBD products over the internet. The Online segment's growth is also supported by technological advancements in secure payment systems and efficient logistics, ensuring reliable delivery of CBD Living Water products to consumers worldwide. As regulatory frameworks evolve to accommodate online CBD sales, this segment is poised for significant expansion, driven by convenience-driven consumer preferences and the growing acceptance of e-commerce as a primary retail channel for CBD products.
CBD Living Water Market Segmentation
By Type
Pure CBD Water
Mixed CBD Water
By Sales Channel
Online
Offline
Countries Analyzed
North America (US, Canada, Mexico)
Europe (Germany, UK, France, Spain, Italy, Russia, Rest of Europe)
Asia Pacific (China, India, Japan, South Korea, Australia, South East Asia, Rest of Asia)
South America (Brazil, Argentina, Rest of South America)
Middle East and Africa (Saudi Arabia, UAE, Rest of Middle East, South Africa, Egypt, Rest of Africa)
CBD Living Water Companies Profiled in the Study
Canna Nano
Cannabidiol Life
Cannabinoid Creations
CBD Bio Naturals
CBD Fusion Water
CBD Living
Endoca
HempMeds
Plus CBD Oil
TertraLabs
*- List Not Exhaustive
Chapter 1. TABLE OF CONTENTS
Chapter 2. Introduction to CBD Living Water Market
2.1. Market Overview
2.2. Key Statistics and Report Highlights
2.3. Scope of the Comprehensive Study
2.3.1. Market Definition
2.3.2 Countries and Regions Covered
2.3.3 Research Objective
2.3.4 Units, Currency, and Conversions
2.3.5 Industry Value Chain
2.4. Key Market Segments
2.5. Key Companies
2.6. Study Period
Chapter 3. Strategic Analysis Review
3.1. CBD Living Water Pricing Analysis and Forecast
3.2. Porter’s Five Forces
3.3. Market Ecosystem
3.4. SWOT Analysis
3.5. Regulatory Scenario
3.3. Effects of Inflation, Russia-Ukraine War, moderating economic growth, and other macroeconomic factors
Chapter 4. Competitive Landscape
4.1. Market Share Analysis
4.1.1. Global CBD Living Water Market Share by Company, 2023
4.1.2. Product Offerings of Leading CBD Living Water Companies
4.2. Market Entropy
4.2.1. New Product Launches in the Industry
4.2.2. Mergers, Acquisitions, Joint ventures, and Partnerships
4.3. Key Strategies and Best Practices
Chapter 5. Global Market Projections: Best, Reference, and Low Case Scenarios
5.1. Growth Analysis- Case Scenario Definitions
5.2. Low Growth Case Scenario Forecasts
5.3. Reference Growth Case Scenario Forecasts
5.4. High Growth Case Scenario Forecasts
Chapter 6. Market Dynamics
6.1. CBD Living Water Market Drivers
6.2. CBD Living Water Market Challenges
6.6. CBD Living Water Market Opportunities
6.4. CBD Living Water Market Trends
Chapter 7. Global CBD Living Water Market Outlook Trends
7.1. Global CBD Living Water Revenue (USD Million) and CAGR (%) by Type (2021-2032)
7.2. Global CBD Living Water Revenue (USD Million) and CAGR (%) by Application (2021-2032)
7.3. Global CBD Living Water Revenue (USD Million) and CAGR (%) by Product (2021-2032)
By Type
Pure CBD Water
Mixed CBD Water
By Sales Channel
Online
Offline
Chapter 8. Global CBD Living Water Regional Analysis and Outlook
8.1. Global CBD Living Water Revenue (USD Million) By Regions (2021- 2032)
8.2. North America CBD Living Water Revenue (USD Million) by Country (2021-2032)
8.2.1. United States CBD Living Water Regional Analysis and Outlook
8.2.2. Canada CBD Living Water Regional Analysis and Outlook
8.2.3. Mexico CBD Living Water Regional Analysis and Outlook
8.3. Europe CBD Living Water Revenue (USD Million), by Country (2021-2032)
8.3.1. Germany CBD Living Water Regional Analysis and Outlook
8.3.2. France CBD Living Water Regional Analysis and Outlook
8.3.3. United Kingdom CBD Living Water Regional Analysis and Outlook
8.3.4. Spain CBD Living Water Regional Analysis and Outlook
8.3.5. Italy CBD Living Water Regional Analysis and Outlook
8.3.6. Russia CBD Living Water Regional Analysis and Outlook
8.3.7. Rest of Europe CBD Living Water Regional Analysis and Outlook
8.4. Asia Pacific CBD Living Water Revenue (USD Million) by Country (2021-2032)
8.4.1. China CBD Living Water Regional Analysis and Outlook
8.4.2. Japan CBD Living Water Regional Analysis and Outlook
8.4.3. India CBD Living Water Regional Analysis and Outlook
8.4.4. South Korea CBD Living Water Regional Analysis and Outlook
8.4.5. Australia CBD Living Water Regional Analysis and Outlook
8.4.6. South East Asia CBD Living Water Regional Analysis and Outlook
8.4.7. Rest of Asia Pacific CBD Living Water Regional Analysis and Outlook
8.5. South America CBD Living Water Revenue (USD Million), by Country (2021-2032)
8.5.1. Brazil CBD Living Water Regional Analysis and Outlook
8.5.2. Argentina CBD Living Water Regional Analysis and Outlook
8.5.3. Rest of South America CBD Living Water Regional Analysis and Outlook
8.6. Middle East and Africa CBD Living Water Revenue (USD Million) by Country (2021-2032)
8.6.1. Middle East CBD Living Water Regional Analysis and Outlook
8.6.2. Africa CBD Living Water Regional Analysis and Outlook
Chapter 9. North America CBD Living Water Analysis and Outlook
9.1. North America CBD Living Water Revenue (USD Million) by Segments (2021-2032)
9.1.1. North America CBD Living Water Revenue (USD Million) by Type (2021-2032)
9.1.2. North America CBD Living Water Revenue (USD Million) by Application (2021-2032)
9.1.3. North America CBD Living Water Revenue (USD Million) by Product (2021-2032)
By Type
Pure CBD Water
Mixed CBD Water
By Sales Channel
Online
Offline
Chapter 10. Europe CBD Living Water Analysis and Outlook
10.1. Europe CBD Living Water Revenue (USD Million), by Segments (USD Million) (2021-2032)
10.1.1. Europe CBD Living Water Revenue (USD Million) by Type (2021-2032)
10.1.2. Europe CBD Living Water Revenue (USD Million) by Application (2021-2032)
10.1.3. Europe CBD Living Water Revenue (USD Million) by Product (2021-2032)
By Type
Pure CBD Water
Mixed CBD Water
By Sales Channel
Online
Offline
Chapter 11. Asia Pacific CBD Living Water Analysis and Outlook
11.1. Asia Pacific CBD Living Water Revenue (USD Million), and Revenue (USD Million) by Segments (2021-2032)
11.1.1. Asia Pacific CBD Living Water Revenue (USD Million) by Type (2021-2032)
11.1.2. Asia Pacific CBD Living Water Revenue (USD Million) by Application (2021-2032)
11.1.3. Asia Pacific CBD Living Water Revenue (USD Million) by Product (2021-2032)
By Type
Pure CBD Water
Mixed CBD Water
By Sales Channel
Online
Offline
Chapter 12. South America CBD Living Water Analysis and Outlook
12.1. South America CBD Living Water Revenue (USD Million), by Segments (2021-2032)
12.1.1. South America CBD Living Water Revenue (USD Million) by Type (2021-2032)
12.1.2. South America CBD Living Water Revenue (USD Million) by Application (2021-2032)
12.1.3. South America CBD Living Water Revenue (USD Million) by Product (2021-2032)
By Type
Pure CBD Water
Mixed CBD Water
By Sales Channel
Online
Offline
Chapter 13. Middle East and Africa CBD Living Water Analysis and Outlook
13.1. Middle East and Africa CBD Living Water Revenue (USD Million), by Segments (2021-2032)
13.1.1. Middle East and Africa CBD Living Water Revenue (USD Million) by Type (2021-2032)
13.1.2. Middle East and Africa CBD Living Water Revenue (USD Million) by Application (2021-2032)
13.1.3. Middle East and Africa CBD Living Water Revenue (USD Million) by Product (2021-2032)
By Type
Pure CBD Water
Mixed CBD Water
By Sales Channel
Online
Offline
Chapter 14. CBD Living Water Company Profiles
14.1 Business Overview
14.2 Product Profiles
14.3 SWOT Profiles
14.5 Recent Developments
14.6 Financial Profile
List of Companies
Canna Nano
Cannabidiol Life
Cannabinoid Creations
CBD Bio Naturals
CBD Fusion Water
CBD Living
Endoca
HempMeds
Plus CBD Oil
TertraLabs
15. Methodology and Data Sources
15.1 Customization Offerings
15.2 Subscription Services
15.3 Related Reports
15.4 Publisher Expertise
LIST OF TABLES
Table 1 Market Segmentation Analysis
Table 2 Global CBD Living Water Market Share of Leading Companies, 2023
Table 3 Product Offerings of Leading Companies
Table 4 Low Growth Scenario Forecasts
Table 5 Reference Case Growth Scenario
Table 6 High Growth Case Scenario
Table 7 Global CBD Living Water Revenue (USD Million) And CAGR (%) By Type (2021-2032)
Table 8 Global CBD Living Water Revenue (USD Million) And CAGR (%) By Application (2021-2032)
Table 9 Global CBD Living Water Revenue (USD Million) And CAGR (%) By Product (2021-2032)
Table 10 Global CBD Living Water Market Revenue (USD Million) By Regions (2021-2032)
Table 11 Global CBD Living Water Market Share (%) By Regions (2021-2032)
Table 12 North America CBD Living Water Revenue (USD Million) By Country (2021-2032)
Table 13 Europe CBD Living Water Revenue (USD Million) By Country (2021-2032)
Table 14 Asia Pacific CBD Living Water Revenue (USD Million) By Country (2021-2032)
Table 15 South America CBD Living Water Revenue (USD Million) By Country (2021-2032)
Table 16 Middle East and Africa CBD Living Water Revenue (USD Million) By Region (2021-2032)
Table 17 North America CBD Living Water Revenue (USD Million) By Type (2021-2032)
Table 18 North America CBD Living Water Revenue (USD Million) By Application (2021-2032)
Table 19 North America CBD Living Water Revenue (USD Million) By Product (2021-2032)
Table 20 Europe CBD Living Water Revenue (USD Million) By Type (2021-2032)
Table 21 Europe CBD Living Water Revenue (USD Million) By Application (2021-2032)
Table 22 Europe CBD Living Water Revenue (USD Million) By Product (2021-2032)
Table 23 Asia Pacific CBD Living Water Revenue (USD Million) By Type (2021-2032)
Table 24 Asia Pacific CBD Living Water Revenue (USD Million) By Application (2021-2032)
Table 25 Asia Pacific CBD Living Water Revenue (USD Million) By Product (2021-2032)
Table 26 South America CBD Living Water Revenue (USD Million) By Type (2021-2032)
Table 27 South America CBD Living Water Revenue (USD Million) By Application (2021-2032)
Table 28 South America CBD Living Water Revenue (USD Million) By Product (2021-2032)
Table 29 Middle East and Africa CBD Living Water Revenue (USD Million) By Type (2021-2032)
Table 30 Middle East and Africa CBD Living Water Revenue (USD Million) By Application (2021-2032)
Table 31 Middle East and Africa CBD Living Water Revenue (USD Million) By Product (2021-2032)
LIST OF FIGURES
Figure 1. Market Scope
Figure 2. Pricing Forecasts Per Unit, 2023- 2032
Figure 3. Porter’s Five Forces
Figure 4. Global CBD Living Water Market Revenue (USD Million) By Regions (2021-2032)
Figure 5. Global CBD Living Water Market Share (%) By Regions (2023)
Figure 6. North America CBD Living Water Revenue (USD Million) By Country (2021-2032)
Figure 7. United States CBD Living Water Revenue (USD Million) By Country (2021-2032)
Figure 8. Canada CBD Living Water Revenue (USD Million) By Country (2021-2032)
Figure 9. Mexico CBD Living Water Revenue (USD Million) By Country (2021-2032)
Figure 10. Europe CBD Living Water Revenue (USD Million) By Country (2021-2032)
Figure 11. Germany CBD Living Water Revenue (USD Million) By Country (2021-2032)
Figure 12. France CBD Living Water Revenue (USD Million) By Country (2021-2032)
Figure 13. United Kingdom CBD Living Water Revenue (USD Million) By Country (2021-2032)
Figure 14. Spain CBD Living Water Revenue (USD Million) By Country (2021-2032)
Figure 15. Italy CBD Living Water Revenue (USD Million) By Country (2021-2032)
Figure 16. Russia CBD Living Water Revenue (USD Million) By Country (2021-2032)
Figure 17. Rest of Europe CBD Living Water Revenue (USD Million) By Country (2021-2032)
Figure 11. Asia Pacific CBD Living Water Revenue (USD Million) By Country (2021-2032)
Figure 12. China CBD Living Water Revenue (USD Million) By Country (2021-2032)
Figure 13. Japan CBD Living Water Revenue (USD Million) By Country (2021-2032)
Figure 14. India CBD Living Water Revenue (USD Million) By Country (2021-2032)
Figure 15. South Korea CBD Living Water Revenue (USD Million) By Country (2021-2032)
Figure 16. Australia CBD Living Water Revenue (USD Million) By Country (2021-2032)
Figure 17. South East Asia CBD Living Water Revenue (USD Million) By Country (2021-2032)
Figure 18. South America CBD Living Water Revenue (USD Million) By Country (2021-2032)
Figure 19. Brazil CBD Living Water Revenue (USD Million) By Country (2021-2032)
Figure 20. Argentina CBD Living Water Revenue (USD Million) By Country (2021-2032)
Figure 21. Rest of Asia Pacific CBD Living Water Revenue (USD Million) By Country (2021-2032)
Figure 22. Middle East and Africa CBD Living Water Revenue (USD Million) By Region (2021-2032)
Figure 23. Saudi Arabia CBD Living Water Revenue (USD Million) By Region (2021-2032)
Figure 24. The UAE CBD Living Water Revenue (USD Million) By Region (2021-2032)
Figure 25. Rest of Middle East CBD Living Water Revenue (USD Million) By Region (2021-2032)
Figure 26. South Africa CBD Living Water Revenue (USD Million) By Region (2021-2032)
Figure 27. Africa CBD Living Water Revenue (USD Million) By Region (2021-2032)
Figure 28. North America CBD Living Water Revenue (USD Million) By Type (2021-2032)
Figure 29. North America CBD Living Water Revenue (USD Million) By Application (2021-2032)
Figure 30. North America CBD Living Water Revenue (USD Million) By Product (2021-2032)
Figure 31. Europe CBD Living Water Revenue (USD Million) By Type (2021-2032)
Figure 32. Europe CBD Living Water Revenue (USD Million) By Application (2021-2032)
Figure 33. Europe CBD Living Water Revenue (USD Million) By Product (2021-2032)
Figure 34. Asia Pacific CBD Living Water Revenue (USD Million) By Type (2021-2032)
Figure 35. Asia Pacific CBD Living Water Revenue (USD Million) By Application (2021-2032)
Figure 36. Asia Pacific CBD Living Water Revenue (USD Million) By Product (2021-2032)
Figure 37. South America CBD Living Water Revenue (USD Million) By Type (2021-2032)
Figure 38. South America CBD Living Water Revenue (USD Million) By Application (2021-2032)
Figure 39. South America CBD Living Water Revenue (USD Million) By Product (2021-2032)
Figure 40. Middle East and Africa CBD Living Water Revenue (USD Million) By Type (2021-2032)
Figure 41. Middle East and Africa CBD Living Water Revenue (USD Million) By Application (2021-2032)
Figure 42. Middle East and Africa CBD Living Water Revenue (USD Million) By Product (2021-2032)
By Type
Pure CBD Water
Mixed CBD Water
By Sales Channel
Online
Offline
Countries Analyzed
North America (US, Canada, Mexico)
Europe (Germany, UK, France, Spain, Italy, Russia, Rest of Europe)
Asia Pacific (China, India, Japan, South Korea, Australia, South East Asia, Rest of Asia)
South America (Brazil, Argentina, Rest of South America)
Middle East and Africa (Saudi Arabia, UAE, Rest of Middle East, South Africa, Egypt, Rest of Africa)
