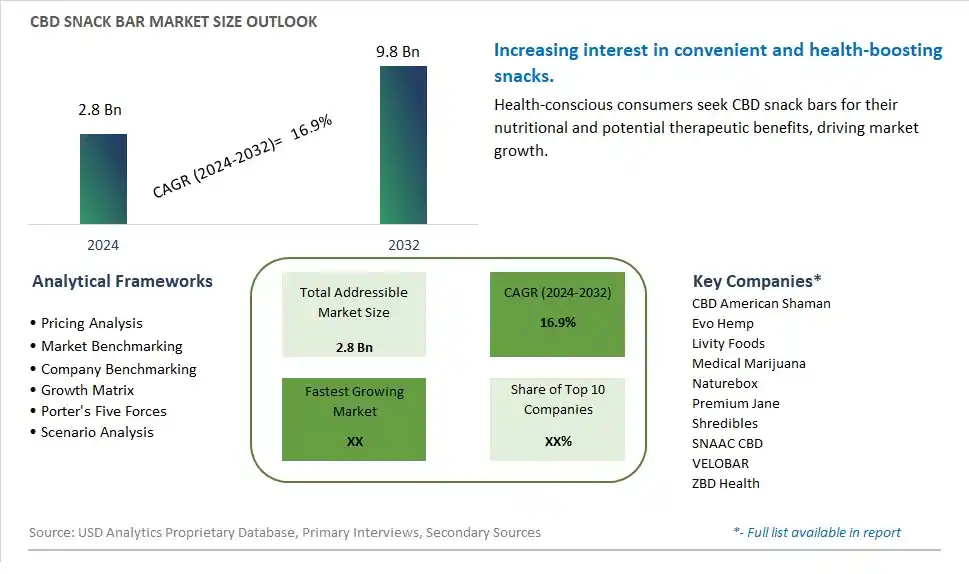
Global CBD Snack Bar Market Size is valued at $2.8 Billion in 2024 and is forecast to register a growth rate (CAGR) of 16.9% to reach $9.8 Billion by 2032.
The global CBD Snack Bar Market Comprehensive Study analyzes and forecasts the market size across 6 regions and 24 countries for diverse segments -By Type (Vegetarian Nutrition Bars, Sports Nutrition Bars, Others), By Application (Online, Offline)
An Introduction to CBD Snack Bar Market
In 2024, the CBD Snack Bar market is witnessing robust growth, driven by the increasing demand for convenient, nutritious, and functional snacks. CBD snack bars, which combine the benefits of CBD with healthy ingredients such as nuts, seeds, and fruits, are popular among health-conscious consumers seeking stress relief, pain management, and overall wellness. The market is supported by the growing trend towards functional foods that offer more than just basic nutrition. Advances in snack bar formulation and CBD infusion technologies are enhancing the taste, texture, and efficacy of CBD snack bars. The market is also benefiting from the trend towards clean-label and organic products, appealing to consumers seeking natural and effective health solutions.
CBD Snack Bar Competitive Landscape
The market report analyses the leading companies in the industry including CBD American Shaman, Evo Hemp, Livity Foods, Medical Marijuana, Naturebox, Premium Jane, Shredibles, SNAAC CBD, VELOBAR, ZBD Health, and Others.
CBD Snack Bar Market Dynamics
CBD Snack Bar Market Trend: Growing Demand for CBD-infused Snacks
The most prominent market trend for CBD Snack Bars is the growing demand for CBD-infused snacks. As consumers seek convenient and enjoyable ways to incorporate CBD into their daily routine, the snack bar category presents an appealing option. This trend is driven by the increasing awareness of CBD's potential health benefits, including stress relief, relaxation, and overall wellness support.
CBD Snack Bar Market Driver: Health and Wellness Consciousness
A key market driver for CBD Snack Bars is the rising health and wellness consciousness among consumers. People are actively seeking snacks that not only satisfy their cravings but also offer functional benefits. CBD-infused snack bars cater to this demand by providing a convenient and discreet way to consume CBD while enjoying a tasty snack. The market driver is further fueled by the preference for natural and plant-based ingredients.
CBD Snack Bar Market Opportunity: Product Diversification and Brand Innovation
An opportunity within the CBD Snack Bar market lies in product diversification and brand innovation. Manufacturers can explore a variety of flavor profiles, ingredient combinations, and nutritional enhancements to appeal to different consumer preferences and dietary needs. Collaborations with chefs, nutritionists, and wellness experts can help create unique formulations and elevate the overall quality of CBD snack bars. Additionally, innovative packaging designs, eco-friendly materials, and transparent labeling can enhance brand trust and resonate with environmentally conscious consumers.
CBD Snack Bar Market Share Analysis: Vegetarian Nutrition Bars segment generated the highest revenue share in the industry
Vegetarian Nutrition Bars stand out as the largest segment in the CBD Snack Bar market by type. This segment's dominance is driven by the increasing consumer preference for plant-based and vegetarian dietary options. Vegetarian Nutrition Bars appeal to health-conscious consumers who seek snacks that are not only convenient but also align with their dietary preferences and values, such as sustainability and animal welfare. The market for vegetarian nutrition bars has expanded significantly as more consumers adopt vegetarian and vegan lifestyles or simply prioritize plant-based options for health reasons. Further, these bars often feature a blend of nutritious ingredients, including nuts, seeds, fruits, and now CBD, which adds a wellness dimension by offering potential therapeutic benefits like stress relief and anti-inflammatory properties. The popularity of CBD-infused vegetarian nutrition bars is further propelled by growing awareness of CBD's health benefits and its integration into daily wellness routines. As a result, the Vegetarian Nutrition Bars segment continues to lead the CBD Snack Bar market, benefiting from both dietary trends and the increasing acceptance of CBD in mainstream consumer products.
CBD Snack Bar Market Share Analysis: Online is the fastest growing segment over the forecast period to 2032
The Online segment is anticipated to be the fastest growing in the CBD Snack Bar market by application through 2032. This growth is driven by the increasing consumer shift towards e-commerce platforms for purchasing CBD products, including snack bars. Online channels offer several advantages such as convenience, a wider range of product choices, and the ability to reach a global audience without the constraints of physical retail locations. The Past few yearsaccelerated the trend towards online shopping as consumers sought safer and more convenient ways to purchase goods. Furthermore, digital marketing strategies, influencer endorsements, and targeted advertising have significantly boosted the visibility and accessibility of CBD snack bars online. The ease of comparing prices, reading reviews, and accessing detailed product information online also contributes to the growing preference for purchasing CBD snack bars through digital channels. As regulatory frameworks continue to evolve to accommodate online sales of CBD products, the Online segment is poised for substantial growth, driven by consumer convenience, expanding digital infrastructure, and the growing acceptance of e-commerce as a primary retail channel for CBD snack bars.
CBD Snack Bar Market Segmentation
By Type
Vegetarian Nutrition Bars
Sports Nutrition Bars
Others
By Application
Online
Offline
Countries Analyzed
North America (US, Canada, Mexico)
Europe (Germany, UK, France, Spain, Italy, Russia, Rest of Europe)
Asia Pacific (China, India, Japan, South Korea, Australia, South East Asia, Rest of Asia)
South America (Brazil, Argentina, Rest of South America)
Middle East and Africa (Saudi Arabia, UAE, Rest of Middle East, South Africa, Egypt, Rest of Africa)
CBD Snack Bar Companies Profiled in the Study
CBD American Shaman
Evo Hemp
Livity Foods
Medical Marijuana
Naturebox
Premium Jane
Shredibles
SNAAC CBD
VELOBAR
ZBD Health
*- List Not Exhaustive
Chapter 1. TABLE OF CONTENTS
Chapter 2. Introduction to CBD Snack Bar Market
2.1. Market Overview
2.2. Key Statistics and Report Highlights
2.3. Scope of the Comprehensive Study
2.3.1. Market Definition
2.3.2 Countries and Regions Covered
2.3.3 Research Objective
2.3.4 Units, Currency, and Conversions
2.3.5 Industry Value Chain
2.4. Key Market Segments
2.5. Key Companies
2.6. Study Period
Chapter 3. Strategic Analysis Review
3.1. CBD Snack Bar Pricing Analysis and Forecast
3.2. Porter’s Five Forces
3.3. Market Ecosystem
3.4. SWOT Analysis
3.5. Regulatory Scenario
3.3. Effects of Inflation, Russia-Ukraine War, moderating economic growth, and other macroeconomic factors
Chapter 4. Competitive Landscape
4.1. Market Share Analysis
4.1.1. Global CBD Snack Bar Market Share by Company, 2023
4.1.2. Product Offerings of Leading CBD Snack Bar Companies
4.2. Market Entropy
4.2.1. New Product Launches in the Industry
4.2.2. Mergers, Acquisitions, Joint ventures, and Partnerships
4.3. Key Strategies and Best Practices
Chapter 5. Global Market Projections: Best, Reference, and Low Case Scenarios
5.1. Growth Analysis- Case Scenario Definitions
5.2. Low Growth Case Scenario Forecasts
5.3. Reference Growth Case Scenario Forecasts
5.4. High Growth Case Scenario Forecasts
Chapter 6. Market Dynamics
6.1. CBD Snack Bar Market Drivers
6.2. CBD Snack Bar Market Challenges
6.6. CBD Snack Bar Market Opportunities
6.4. CBD Snack Bar Market Trends
Chapter 7. Global CBD Snack Bar Market Outlook Trends
7.1. Global CBD Snack Bar Revenue (USD Million) and CAGR (%) by Type (2021-2032)
7.2. Global CBD Snack Bar Revenue (USD Million) and CAGR (%) by Application (2021-2032)
7.3. Global CBD Snack Bar Revenue (USD Million) and CAGR (%) by Product (2021-2032)
By Type
Vegetarian Nutrition Bars
Sports Nutrition Bars
Others
By Application
Online
Offline
Chapter 8. Global CBD Snack Bar Regional Analysis and Outlook
8.1. Global CBD Snack Bar Revenue (USD Million) By Regions (2021- 2032)
8.2. North America CBD Snack Bar Revenue (USD Million) by Country (2021-2032)
8.2.1. United States CBD Snack Bar Regional Analysis and Outlook
8.2.2. Canada CBD Snack Bar Regional Analysis and Outlook
8.2.3. Mexico CBD Snack Bar Regional Analysis and Outlook
8.3. Europe CBD Snack Bar Revenue (USD Million), by Country (2021-2032)
8.3.1. Germany CBD Snack Bar Regional Analysis and Outlook
8.3.2. France CBD Snack Bar Regional Analysis and Outlook
8.3.3. United Kingdom CBD Snack Bar Regional Analysis and Outlook
8.3.4. Spain CBD Snack Bar Regional Analysis and Outlook
8.3.5. Italy CBD Snack Bar Regional Analysis and Outlook
8.3.6. Russia CBD Snack Bar Regional Analysis and Outlook
8.3.7. Rest of Europe CBD Snack Bar Regional Analysis and Outlook
8.4. Asia Pacific CBD Snack Bar Revenue (USD Million) by Country (2021-2032)
8.4.1. China CBD Snack Bar Regional Analysis and Outlook
8.4.2. Japan CBD Snack Bar Regional Analysis and Outlook
8.4.3. India CBD Snack Bar Regional Analysis and Outlook
8.4.4. South Korea CBD Snack Bar Regional Analysis and Outlook
8.4.5. Australia CBD Snack Bar Regional Analysis and Outlook
8.4.6. South East Asia CBD Snack Bar Regional Analysis and Outlook
8.4.7. Rest of Asia Pacific CBD Snack Bar Regional Analysis and Outlook
8.5. South America CBD Snack Bar Revenue (USD Million), by Country (2021-2032)
8.5.1. Brazil CBD Snack Bar Regional Analysis and Outlook
8.5.2. Argentina CBD Snack Bar Regional Analysis and Outlook
8.5.3. Rest of South America CBD Snack Bar Regional Analysis and Outlook
8.6. Middle East and Africa CBD Snack Bar Revenue (USD Million) by Country (2021-2032)
8.6.1. Middle East CBD Snack Bar Regional Analysis and Outlook
8.6.2. Africa CBD Snack Bar Regional Analysis and Outlook
Chapter 9. North America CBD Snack Bar Analysis and Outlook
9.1. North America CBD Snack Bar Revenue (USD Million) by Segments (2021-2032)
9.1.1. North America CBD Snack Bar Revenue (USD Million) by Type (2021-2032)
9.1.2. North America CBD Snack Bar Revenue (USD Million) by Application (2021-2032)
9.1.3. North America CBD Snack Bar Revenue (USD Million) by Product (2021-2032)
By Type
Vegetarian Nutrition Bars
Sports Nutrition Bars
Others
By Application
Online
Offline
Chapter 10. Europe CBD Snack Bar Analysis and Outlook
10.1. Europe CBD Snack Bar Revenue (USD Million), by Segments (USD Million) (2021-2032)
10.1.1. Europe CBD Snack Bar Revenue (USD Million) by Type (2021-2032)
10.1.2. Europe CBD Snack Bar Revenue (USD Million) by Application (2021-2032)
10.1.3. Europe CBD Snack Bar Revenue (USD Million) by Product (2021-2032)
By Type
Vegetarian Nutrition Bars
Sports Nutrition Bars
Others
By Application
Online
Offline
Chapter 11. Asia Pacific CBD Snack Bar Analysis and Outlook
11.1. Asia Pacific CBD Snack Bar Revenue (USD Million), and Revenue (USD Million) by Segments (2021-2032)
11.1.1. Asia Pacific CBD Snack Bar Revenue (USD Million) by Type (2021-2032)
11.1.2. Asia Pacific CBD Snack Bar Revenue (USD Million) by Application (2021-2032)
11.1.3. Asia Pacific CBD Snack Bar Revenue (USD Million) by Product (2021-2032)
By Type
Vegetarian Nutrition Bars
Sports Nutrition Bars
Others
By Application
Online
Offline
Chapter 12. South America CBD Snack Bar Analysis and Outlook
12.1. South America CBD Snack Bar Revenue (USD Million), by Segments (2021-2032)
12.1.1. South America CBD Snack Bar Revenue (USD Million) by Type (2021-2032)
12.1.2. South America CBD Snack Bar Revenue (USD Million) by Application (2021-2032)
12.1.3. South America CBD Snack Bar Revenue (USD Million) by Product (2021-2032)
By Type
Vegetarian Nutrition Bars
Sports Nutrition Bars
Others
By Application
Online
Offline
Chapter 13. Middle East and Africa CBD Snack Bar Analysis and Outlook
13.1. Middle East and Africa CBD Snack Bar Revenue (USD Million), by Segments (2021-2032)
13.1.1. Middle East and Africa CBD Snack Bar Revenue (USD Million) by Type (2021-2032)
13.1.2. Middle East and Africa CBD Snack Bar Revenue (USD Million) by Application (2021-2032)
13.1.3. Middle East and Africa CBD Snack Bar Revenue (USD Million) by Product (2021-2032)
By Type
Vegetarian Nutrition Bars
Sports Nutrition Bars
Others
By Application
Online
Offline
Chapter 14. CBD Snack Bar Company Profiles
14.1 Business Overview
14.2 Product Profiles
14.3 SWOT Profiles
14.5 Recent Developments
14.6 Financial Profile
List of Companies
CBD American Shaman
Evo Hemp
Livity Foods
Medical Marijuana
Naturebox
Premium Jane
Shredibles
SNAAC CBD
VELOBAR
ZBD Health
15. Methodology and Data Sources
15.1 Customization Offerings
15.2 Subscription Services
15.3 Related Reports
15.4 Publisher Expertise
LIST OF TABLES
Table 1 Market Segmentation Analysis
Table 2 Global CBD Snack Bar Market Share of Leading Companies, 2023
Table 3 Product Offerings of Leading Companies
Table 4 Low Growth Scenario Forecasts
Table 5 Reference Case Growth Scenario
Table 6 High Growth Case Scenario
Table 7 Global CBD Snack Bar Revenue (USD Million) And CAGR (%) By Type (2021-2032)
Table 8 Global CBD Snack Bar Revenue (USD Million) And CAGR (%) By Application (2021-2032)
Table 9 Global CBD Snack Bar Revenue (USD Million) And CAGR (%) By Product (2021-2032)
Table 10 Global CBD Snack Bar Market Revenue (USD Million) By Regions (2021-2032)
Table 11 Global CBD Snack Bar Market Share (%) By Regions (2021-2032)
Table 12 North America CBD Snack Bar Revenue (USD Million) By Country (2021-2032)
Table 13 Europe CBD Snack Bar Revenue (USD Million) By Country (2021-2032)
Table 14 Asia Pacific CBD Snack Bar Revenue (USD Million) By Country (2021-2032)
Table 15 South America CBD Snack Bar Revenue (USD Million) By Country (2021-2032)
Table 16 Middle East and Africa CBD Snack Bar Revenue (USD Million) By Region (2021-2032)
Table 17 North America CBD Snack Bar Revenue (USD Million) By Type (2021-2032)
Table 18 North America CBD Snack Bar Revenue (USD Million) By Application (2021-2032)
Table 19 North America CBD Snack Bar Revenue (USD Million) By Product (2021-2032)
Table 20 Europe CBD Snack Bar Revenue (USD Million) By Type (2021-2032)
Table 21 Europe CBD Snack Bar Revenue (USD Million) By Application (2021-2032)
Table 22 Europe CBD Snack Bar Revenue (USD Million) By Product (2021-2032)
Table 23 Asia Pacific CBD Snack Bar Revenue (USD Million) By Type (2021-2032)
Table 24 Asia Pacific CBD Snack Bar Revenue (USD Million) By Application (2021-2032)
Table 25 Asia Pacific CBD Snack Bar Revenue (USD Million) By Product (2021-2032)
Table 26 South America CBD Snack Bar Revenue (USD Million) By Type (2021-2032)
Table 27 South America CBD Snack Bar Revenue (USD Million) By Application (2021-2032)
Table 28 South America CBD Snack Bar Revenue (USD Million) By Product (2021-2032)
Table 29 Middle East and Africa CBD Snack Bar Revenue (USD Million) By Type (2021-2032)
Table 30 Middle East and Africa CBD Snack Bar Revenue (USD Million) By Application (2021-2032)
Table 31 Middle East and Africa CBD Snack Bar Revenue (USD Million) By Product (2021-2032)
LIST OF FIGURES
Figure 1. Market Scope
Figure 2. Pricing Forecasts Per Unit, 2023- 2032
Figure 3. Porter’s Five Forces
Figure 4. Global CBD Snack Bar Market Revenue (USD Million) By Regions (2021-2032)
Figure 5. Global CBD Snack Bar Market Share (%) By Regions (2023)
Figure 6. North America CBD Snack Bar Revenue (USD Million) By Country (2021-2032)
Figure 7. United States CBD Snack Bar Revenue (USD Million) By Country (2021-2032)
Figure 8. Canada CBD Snack Bar Revenue (USD Million) By Country (2021-2032)
Figure 9. Mexico CBD Snack Bar Revenue (USD Million) By Country (2021-2032)
Figure 10. Europe CBD Snack Bar Revenue (USD Million) By Country (2021-2032)
Figure 11. Germany CBD Snack Bar Revenue (USD Million) By Country (2021-2032)
Figure 12. France CBD Snack Bar Revenue (USD Million) By Country (2021-2032)
Figure 13. United Kingdom CBD Snack Bar Revenue (USD Million) By Country (2021-2032)
Figure 14. Spain CBD Snack Bar Revenue (USD Million) By Country (2021-2032)
Figure 15. Italy CBD Snack Bar Revenue (USD Million) By Country (2021-2032)
Figure 16. Russia CBD Snack Bar Revenue (USD Million) By Country (2021-2032)
Figure 17. Rest of Europe CBD Snack Bar Revenue (USD Million) By Country (2021-2032)
Figure 11. Asia Pacific CBD Snack Bar Revenue (USD Million) By Country (2021-2032)
Figure 12. China CBD Snack Bar Revenue (USD Million) By Country (2021-2032)
Figure 13. Japan CBD Snack Bar Revenue (USD Million) By Country (2021-2032)
Figure 14. India CBD Snack Bar Revenue (USD Million) By Country (2021-2032)
Figure 15. South Korea CBD Snack Bar Revenue (USD Million) By Country (2021-2032)
Figure 16. Australia CBD Snack Bar Revenue (USD Million) By Country (2021-2032)
Figure 17. South East Asia CBD Snack Bar Revenue (USD Million) By Country (2021-2032)
Figure 18. South America CBD Snack Bar Revenue (USD Million) By Country (2021-2032)
Figure 19. Brazil CBD Snack Bar Revenue (USD Million) By Country (2021-2032)
Figure 20. Argentina CBD Snack Bar Revenue (USD Million) By Country (2021-2032)
Figure 21. Rest of Asia Pacific CBD Snack Bar Revenue (USD Million) By Country (2021-2032)
Figure 22. Middle East and Africa CBD Snack Bar Revenue (USD Million) By Region (2021-2032)
Figure 23. Saudi Arabia CBD Snack Bar Revenue (USD Million) By Region (2021-2032)
Figure 24. The UAE CBD Snack Bar Revenue (USD Million) By Region (2021-2032)
Figure 25. Rest of Middle East CBD Snack Bar Revenue (USD Million) By Region (2021-2032)
Figure 26. South Africa CBD Snack Bar Revenue (USD Million) By Region (2021-2032)
Figure 27. Africa CBD Snack Bar Revenue (USD Million) By Region (2021-2032)
Figure 28. North America CBD Snack Bar Revenue (USD Million) By Type (2021-2032)
Figure 29. North America CBD Snack Bar Revenue (USD Million) By Application (2021-2032)
Figure 30. North America CBD Snack Bar Revenue (USD Million) By Product (2021-2032)
Figure 31. Europe CBD Snack Bar Revenue (USD Million) By Type (2021-2032)
Figure 32. Europe CBD Snack Bar Revenue (USD Million) By Application (2021-2032)
Figure 33. Europe CBD Snack Bar Revenue (USD Million) By Product (2021-2032)
Figure 34. Asia Pacific CBD Snack Bar Revenue (USD Million) By Type (2021-2032)
Figure 35. Asia Pacific CBD Snack Bar Revenue (USD Million) By Application (2021-2032)
Figure 36. Asia Pacific CBD Snack Bar Revenue (USD Million) By Product (2021-2032)
Figure 37. South America CBD Snack Bar Revenue (USD Million) By Type (2021-2032)
Figure 38. South America CBD Snack Bar Revenue (USD Million) By Application (2021-2032)
Figure 39. South America CBD Snack Bar Revenue (USD Million) By Product (2021-2032)
Figure 40. Middle East and Africa CBD Snack Bar Revenue (USD Million) By Type (2021-2032)
Figure 41. Middle East and Africa CBD Snack Bar Revenue (USD Million) By Application (2021-2032)
Figure 42. Middle East and Africa CBD Snack Bar Revenue (USD Million) By Product (2021-2032)
By Type
Vegetarian Nutrition Bars
Sports Nutrition Bars
Others
By Application
Online
Offline
Countries Analyzed
North America (US, Canada, Mexico)
Europe (Germany, UK, France, Spain, Italy, Russia, Rest of Europe)
Asia Pacific (China, India, Japan, South Korea, Australia, South East Asia, Rest of Asia)
South America (Brazil, Argentina, Rest of South America)
Middle East and Africa (Saudi Arabia, UAE, Rest of Middle East, South Africa, Egypt, Rest of Africa)
