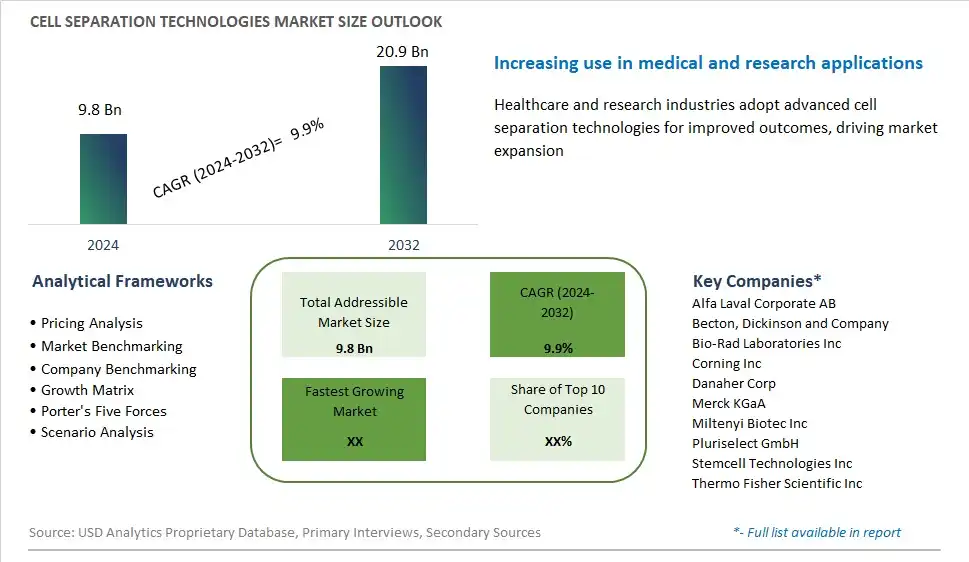
Global Cell Separation Technologies Market Size is valued at $9.8 Billion in 2024 and is forecast to register a growth rate (CAGR) of 9.9% to reach $20.9 Billion by 2032.
The global Cell Separation Technologies Market Comprehensive Study analyzes and forecasts the market size across 6 regions and 24 countries for diverse segments -By Product (Instruments, Consumables), By Technology (Gradient Centrifugation, Surface Markers Separation, Fluorescence Activated Cell Sorting, Magnetic Cell Sorting, Filtration Based Separation), By Application (Oncology Research, Neuroscience Research, Stem Cell Research, Microbiology, Immunology Research, Others), By End-User (Research laboratories & Institute, Biotechnology & Biopharmaceutical Companies, Cell Banks)
An Introduction to Cell Separation Technologies Market
Cell separation technologies, also known as cell sorting or cell isolation, play a pivotal role in various biomedical and biotechnological applications in 2024. By enabling the isolation and purification of specific cell populations from complex mixtures, these technologies facilitate research, diagnostics, and therapeutic development in fields such as immunology, oncology, regenerative medicine, and bioprocessing. From traditional methods such as fluorescence-activated cell sorting (FACS) to emerging techniques like microfluidics and magnetic cell separation, cell separation technologies offer precise and efficient solutions for studying cellular behavior, characterizing biomarkers, and producing cell-based therapies. With advancements in automation, miniaturization, and multiplexing, these technologies continue to drive innovation and progress in life sciences and healthcare.
Cell Separation Technologies Competitive Landscape
The market report analyses the leading companies in the industry including Alfa Laval Corporate AB, Becton, Dickinson and Company, Bio-Rad Laboratories Inc, Corning Inc, Danaher Corp, Merck KGaA, Miltenyi Biotec Inc, Pluriselect GmbH, Stemcell Technologies Inc, Thermo Fisher Scientific Inc, and Others.
Cell Separation Technologies Market Dynamics
Cell Separation Technologies Market Trend: Advancements in Precision Medicine and Personalized Therapies
The market trend for Cell Separation Technologies reflects advancements in precision medicine and personalized therapies. As healthcare shifts towards tailored treatment approaches based on individual genetic makeup and disease characteristics, there's a growing demand for technologies that enable the isolation and purification of specific cell types for diagnostic and therapeutic purposes. Cell separation technologies, such as flow cytometry, magnetic-activated cell sorting (MACS), and microfluidics, are increasingly utilized in research, clinical diagnostics, and cell-based therapies to isolate rare cell populations, analyze cellular heterogeneity, and develop targeted treatments. This trend is driven by the promise of precision medicine to improve patient outcomes, optimize drug development processes, and revolutionize healthcare delivery by tailoring treatments to individual patients' needs.
Market Driver: Rise in Chronic Diseases and Age-Related Conditions
A significant driver of the Cell Separation Technologies market is the rise in chronic diseases and age-related conditions. With an aging global population and increasing prevalence of chronic illnesses such as cancer, autoimmune disorders, and neurodegenerative diseases, there's a growing demand for innovative technologies that enable the isolation and characterization of specific cell populations implicated in disease pathology. Cell separation technologies play a crucial role in biomarker discovery, disease diagnosis, and therapeutic development by enabling researchers and clinicians to isolate and study disease-associated cells, monitor disease progression, and develop targeted therapies tailored to individual patients. The driver is fueled by the urgent need for effective diagnostic and therapeutic strategies to address the growing burden of chronic diseases and age-related conditions on healthcare systems worldwide.
Market Opportunity: Integration of Artificial Intelligence and Automation
An opportunity in the Cell Separation Technologies market lies in the integration of artificial intelligence (AI) and automation to enhance efficiency, accuracy, and scalability. As the complexity and volume of data generated from cell-based assays and omics technologies increase, there's a growing need for intelligent algorithms and automated workflows to streamline data analysis, decision-making, and experimental protocols in cell separation processes. Companies can leverage AI-driven platforms and robotic systems to optimize cell isolation protocols, improve cell yield and purity, and accelerate research and clinical workflows. Additionally, integrating AI-powered image analysis and machine learning algorithms can enable real-time monitoring of cell behavior and phenotype, facilitating rapid and precise cell sorting and characterization. By embracing AI and automation technologies, companies can unlock new levels of productivity, reproducibility, and innovation in cell separation applications, positioning themselves as leaders in the rapidly evolving field of precision medicine and cell-based therapies.
Cell Separation Technologies Market Share Analysis: Instruments held the dominant market share in 2024
In the dynamic landscape of cell separation technologies, the Instruments segment is the largest, commanding prominence due to its pivotal role in facilitating efficient and precise cell isolation processes. Instruments such as centrifuges, flow cytometers, magnetic-activated cell sorting (MACS) systems, and microfluidic devices play a crucial role in separating and purifying different types of cells for various research, diagnostic, and therapeutic applications. These instruments offer high throughput, scalability, and reproducibility, enabling researchers and clinicians to isolate specific cell populations with high purity and yield. Further, ongoing technological advancements and innovations in instrument design and functionality continue to enhance the efficiency and versatility of cell separation techniques, driving the adoption of instruments in academic research institutions, biotechnology companies, and clinical laboratories worldwide. As the demand for cell-based therapies, personalized medicine, and regenerative medicine continues to grow, the Instruments segment of the cell separation technologies market remains at the forefront, shaping advancements in biomedical research and healthcare.
Cell Separation Technologies Market Share Analysis: Magnetic Cell Sorting market is poised to register the fastest growth rae over the forecast period to 2032
Among the segments of the cell separation technologies market, Magnetic Cell Sorting is the fastest-growing segment, driven by its high efficiency, versatility, and non-invasive nature. Magnetic cell sorting utilizes magnetic beads conjugated with specific antibodies to label target cells, enabling their isolation from heterogeneous cell populations. This technology offers numerous advantages, including rapid processing times, high purity, and gentle handling of cells, making it ideal for various research, clinical, and therapeutic applications. Further, magnetic cell sorting allows for the isolation of rare cell populations with precision and specificity, facilitating downstream analyses and applications in fields such as stem cell research, cancer diagnostics, and immunotherapy. Additionally, the continuous development of novel magnetic nanoparticles, magnetic sorting systems, and automation technologies further enhances the capabilities and applicability of magnetic cell sorting in cell separation processes. As researchers and clinicians increasingly rely on efficient and reliable cell isolation techniques for their studies and therapies, the Magnetic Cell Sorting segment of the cell separation technologies market stands poised for continued expansion, driving advancements in biomedical research and healthcare.
Cell Separation Technologies Market Share Analysis: Oncology Research held the dominant market share in 2024
In the multifaceted landscape of cell separation technologies, Oncology Research is the largest segment, commanding prominence due to its pivotal role in advancing our understanding of cancer biology, diagnostics, and therapeutic interventions. Cell separation technologies play a critical role in isolating and characterizing cancer cells from complex biological samples, enabling researchers to study tumor heterogeneity, identify biomarkers, and develop targeted therapies. These technologies facilitate the isolation of circulating tumor cells (CTCs), tumor-infiltrating lymphocytes (TILs), and cancer stem cells, providing valuable insights into cancer progression, metastasis, and treatment resistance. Further, the growing prevalence of cancer and the increasing emphasis on precision medicine drive the demand for advanced cell separation technologies in oncology research. As researchers strive to unravel the complexities of cancer and develop more effective treatment strategies, the Oncology Research segment of the cell separation technologies market remains at the forefront, driving innovation and progress in cancer research and therapeutics.
Cell Separation Technologies Market Segmentation
By Product
Instruments
Consumables
By Technology
Gradient Centrifugation
Surface Markers Separation
Fluorescence Activated Cell Sorting
Magnetic Cell Sorting
Filtration Based Separation
By Application
Oncology Research
Neuroscience Research
Stem Cell Research
Microbiology
Immunology Research
Others
By End-User
Research laboratories & Institute
Biotechnology & Biopharmaceutical Companies
Cell Banks
Countries Analyzed
North America (US, Canada, Mexico)
Europe (Germany, UK, France, Spain, Italy, Russia, Rest of Europe)
Asia Pacific (China, India, Japan, South Korea, Australia, South East Asia, Rest of Asia)
South America (Brazil, Argentina, Rest of South America)
Middle East and Africa (Saudi Arabia, UAE, Rest of Middle East, South Africa, Egypt, Rest of Africa)
Cell Separation Technologies Companies Profiled in the Study
Alfa Laval Corporate AB
Becton, Dickinson and Company
Bio-Rad Laboratories Inc
Corning Inc
Danaher Corp
Merck KGaA
Miltenyi Biotec Inc
Pluriselect GmbH
Stemcell Technologies Inc
Thermo Fisher Scientific Inc
*- List Not Exhaustive
Chapter 1. TABLE OF CONTENTS
Chapter 2. Introduction to Cell Separation Technologies Market
2.1. Market Overview
2.2. Key Statistics and Report Highlights
2.3. Scope of the Comprehensive Study
2.3.1. Market Definition
2.3.2 Countries and Regions Covered
2.3.3 Research Objective
2.3.4 Units, Currency, and Conversions
2.3.5 Industry Value Chain
2.4. Key Market Segments
2.5. Key Companies
2.6. Study Period
Chapter 3. Strategic Analysis Review
3.1. Cell Separation Technologies Pricing Analysis and Forecast
3.2. Porter’s Five Forces
3.3. Market Ecosystem
3.4. SWOT Analysis
3.5. Regulatory Scenario
3.3. Effects of Inflation, Russia-Ukraine War, moderating economic growth, and other macroeconomic factors
Chapter 4. Competitive Landscape
4.1. Market Share Analysis
4.1.1. Global Cell Separation Technologies Market Share by Company, 2023
4.1.2. Product Offerings of Leading Cell Separation Technologies Companies
4.2. Market Entropy
4.2.1. New Product Launches in the Industry
4.2.2. Mergers, Acquisitions, Joint ventures, and Partnerships
4.3. Key Strategies and Best Practices
Chapter 5. Global Market Projections: Best, Reference, and Low Case Scenarios
5.1. Growth Analysis- Case Scenario Definitions
5.2. Low Growth Case Scenario Forecasts
5.3. Reference Growth Case Scenario Forecasts
5.4. High Growth Case Scenario Forecasts
Chapter 6. Market Dynamics
6.1. Cell Separation Technologies Market Drivers
6.2. Cell Separation Technologies Market Challenges
6.6. Cell Separation Technologies Market Opportunities
6.4. Cell Separation Technologies Market Trends
Chapter 7. Global Cell Separation Technologies Market Outlook Trends
7.1. Global Cell Separation Technologies Revenue (USD Million) and CAGR (%) by Type (2021-2032)
7.2. Global Cell Separation Technologies Revenue (USD Million) and CAGR (%) by Application (2021-2032)
7.3. Global Cell Separation Technologies Revenue (USD Million) and CAGR (%) by Product (2021-2032)
By Product
Instruments
Consumables
By Technology
Gradient Centrifugation
Surface Markers Separation
Fluorescence Activated Cell Sorting
Magnetic Cell Sorting
Filtration Based Separation
By Application
Oncology Research
Neuroscience Research
Stem Cell Research
Microbiology
Immunology Research
Others
By End-User
Research laboratories & Institute
Biotechnology & Biopharmaceutical Companies
Cell Banks
Chapter 8. Global Cell Separation Technologies Regional Analysis and Outlook
8.1. Global Cell Separation Technologies Revenue (USD Million) By Regions (2021- 2032)
8.2. North America Cell Separation Technologies Revenue (USD Million) by Country (2021-2032)
8.2.1. United States Cell Separation Technologies Regional Analysis and Outlook
8.2.2. Canada Cell Separation Technologies Regional Analysis and Outlook
8.2.3. Mexico Cell Separation Technologies Regional Analysis and Outlook
8.3. Europe Cell Separation Technologies Revenue (USD Million), by Country (2021-2032)
8.3.1. Germany Cell Separation Technologies Regional Analysis and Outlook
8.3.2. France Cell Separation Technologies Regional Analysis and Outlook
8.3.3. United Kingdom Cell Separation Technologies Regional Analysis and Outlook
8.3.4. Spain Cell Separation Technologies Regional Analysis and Outlook
8.3.5. Italy Cell Separation Technologies Regional Analysis and Outlook
8.3.6. Russia Cell Separation Technologies Regional Analysis and Outlook
8.3.7. Rest of Europe Cell Separation Technologies Regional Analysis and Outlook
8.4. Asia Pacific Cell Separation Technologies Revenue (USD Million) by Country (2021-2032)
8.4.1. China Cell Separation Technologies Regional Analysis and Outlook
8.4.2. Japan Cell Separation Technologies Regional Analysis and Outlook
8.4.3. India Cell Separation Technologies Regional Analysis and Outlook
8.4.4. South Korea Cell Separation Technologies Regional Analysis and Outlook
8.4.5. Australia Cell Separation Technologies Regional Analysis and Outlook
8.4.6. South East Asia Cell Separation Technologies Regional Analysis and Outlook
8.4.7. Rest of Asia Pacific Cell Separation Technologies Regional Analysis and Outlook
8.5. South America Cell Separation Technologies Revenue (USD Million), by Country (2021-2032)
8.5.1. Brazil Cell Separation Technologies Regional Analysis and Outlook
8.5.2. Argentina Cell Separation Technologies Regional Analysis and Outlook
8.5.3. Rest of South America Cell Separation Technologies Regional Analysis and Outlook
8.6. Middle East and Africa Cell Separation Technologies Revenue (USD Million) by Country (2021-2032)
8.6.1. Middle East Cell Separation Technologies Regional Analysis and Outlook
8.6.2. Africa Cell Separation Technologies Regional Analysis and Outlook
Chapter 9. North America Cell Separation Technologies Analysis and Outlook
9.1. North America Cell Separation Technologies Revenue (USD Million) by Segments (2021-2032)
9.1.1. North America Cell Separation Technologies Revenue (USD Million) by Type (2021-2032)
9.1.2. North America Cell Separation Technologies Revenue (USD Million) by Application (2021-2032)
9.1.3. North America Cell Separation Technologies Revenue (USD Million) by Product (2021-2032)
By Product
Instruments
Consumables
By Technology
Gradient Centrifugation
Surface Markers Separation
Fluorescence Activated Cell Sorting
Magnetic Cell Sorting
Filtration Based Separation
By Application
Oncology Research
Neuroscience Research
Stem Cell Research
Microbiology
Immunology Research
Others
By End-User
Research laboratories & Institute
Biotechnology & Biopharmaceutical Companies
Cell Banks
Chapter 10. Europe Cell Separation Technologies Analysis and Outlook
10.1. Europe Cell Separation Technologies Revenue (USD Million), by Segments (USD Million) (2021-2032)
10.1.1. Europe Cell Separation Technologies Revenue (USD Million) by Type (2021-2032)
10.1.2. Europe Cell Separation Technologies Revenue (USD Million) by Application (2021-2032)
10.1.3. Europe Cell Separation Technologies Revenue (USD Million) by Product (2021-2032)
By Product
Instruments
Consumables
By Technology
Gradient Centrifugation
Surface Markers Separation
Fluorescence Activated Cell Sorting
Magnetic Cell Sorting
Filtration Based Separation
By Application
Oncology Research
Neuroscience Research
Stem Cell Research
Microbiology
Immunology Research
Others
By End-User
Research laboratories & Institute
Biotechnology & Biopharmaceutical Companies
Cell Banks
Chapter 11. Asia Pacific Cell Separation Technologies Analysis and Outlook
11.1. Asia Pacific Cell Separation Technologies Revenue (USD Million), and Revenue (USD Million) by Segments (2021-2032)
11.1.1. Asia Pacific Cell Separation Technologies Revenue (USD Million) by Type (2021-2032)
11.1.2. Asia Pacific Cell Separation Technologies Revenue (USD Million) by Application (2021-2032)
11.1.3. Asia Pacific Cell Separation Technologies Revenue (USD Million) by Product (2021-2032)
By Product
Instruments
Consumables
By Technology
Gradient Centrifugation
Surface Markers Separation
Fluorescence Activated Cell Sorting
Magnetic Cell Sorting
Filtration Based Separation
By Application
Oncology Research
Neuroscience Research
Stem Cell Research
Microbiology
Immunology Research
Others
By End-User
Research laboratories & Institute
Biotechnology & Biopharmaceutical Companies
Cell Banks
Chapter 12. South America Cell Separation Technologies Analysis and Outlook
12.1. South America Cell Separation Technologies Revenue (USD Million), by Segments (2021-2032)
12.1.1. South America Cell Separation Technologies Revenue (USD Million) by Type (2021-2032)
12.1.2. South America Cell Separation Technologies Revenue (USD Million) by Application (2021-2032)
12.1.3. South America Cell Separation Technologies Revenue (USD Million) by Product (2021-2032)
By Product
Instruments
Consumables
By Technology
Gradient Centrifugation
Surface Markers Separation
Fluorescence Activated Cell Sorting
Magnetic Cell Sorting
Filtration Based Separation
By Application
Oncology Research
Neuroscience Research
Stem Cell Research
Microbiology
Immunology Research
Others
By End-User
Research laboratories & Institute
Biotechnology & Biopharmaceutical Companies
Cell Banks
Chapter 13. Middle East and Africa Cell Separation Technologies Analysis and Outlook
13.1. Middle East and Africa Cell Separation Technologies Revenue (USD Million), by Segments (2021-2032)
13.1.1. Middle East and Africa Cell Separation Technologies Revenue (USD Million) by Type (2021-2032)
13.1.2. Middle East and Africa Cell Separation Technologies Revenue (USD Million) by Application (2021-2032)
13.1.3. Middle East and Africa Cell Separation Technologies Revenue (USD Million) by Product (2021-2032)
By Product
Instruments
Consumables
By Technology
Gradient Centrifugation
Surface Markers Separation
Fluorescence Activated Cell Sorting
Magnetic Cell Sorting
Filtration Based Separation
By Application
Oncology Research
Neuroscience Research
Stem Cell Research
Microbiology
Immunology Research
Others
By End-User
Research laboratories & Institute
Biotechnology & Biopharmaceutical Companies
Cell Banks
Chapter 14. Cell Separation Technologies Company Profiles
14.1 Business Overview
14.2 Product Profiles
14.3 SWOT Profiles
14.5 Recent Developments
14.6 Financial Profile
List of Companies
Alfa Laval Corporate AB
Becton, Dickinson and Company
Bio-Rad Laboratories Inc
Corning Inc
Danaher Corp
Merck KGaA
Miltenyi Biotec Inc
Pluriselect GmbH
Stemcell Technologies Inc
Thermo Fisher Scientific Inc
15. Methodology and Data Sources
15.1 Customization Offerings
15.2 Subscription Services
15.3 Related Reports
15.4 Publisher Expertise
LIST OF TABLES
Table 1 Market Segmentation Analysis
Table 2 Global Cell Separation Technologies Market Share of Leading Companies, 2023
Table 3 Product Offerings of Leading Companies
Table 4 Low Growth Scenario Forecasts
Table 5 Reference Case Growth Scenario
Table 6 High Growth Case Scenario
Table 7 Global Cell Separation Technologies Revenue (USD Million) And CAGR (%) By Type (2021-2032)
Table 8 Global Cell Separation Technologies Revenue (USD Million) And CAGR (%) By Application (2021-2032)
Table 9 Global Cell Separation Technologies Revenue (USD Million) And CAGR (%) By Product (2021-2032)
Table 10 Global Cell Separation Technologies Market Revenue (USD Million) By Regions (2021-2032)
Table 11 Global Cell Separation Technologies Market Share (%) By Regions (2021-2032)
Table 12 North America Cell Separation Technologies Revenue (USD Million) By Country (2021-2032)
Table 13 Europe Cell Separation Technologies Revenue (USD Million) By Country (2021-2032)
Table 14 Asia Pacific Cell Separation Technologies Revenue (USD Million) By Country (2021-2032)
Table 15 South America Cell Separation Technologies Revenue (USD Million) By Country (2021-2032)
Table 16 Middle East and Africa Cell Separation Technologies Revenue (USD Million) By Region (2021-2032)
Table 17 North America Cell Separation Technologies Revenue (USD Million) By Type (2021-2032)
Table 18 North America Cell Separation Technologies Revenue (USD Million) By Application (2021-2032)
Table 19 North America Cell Separation Technologies Revenue (USD Million) By Product (2021-2032)
Table 20 Europe Cell Separation Technologies Revenue (USD Million) By Type (2021-2032)
Table 21 Europe Cell Separation Technologies Revenue (USD Million) By Application (2021-2032)
Table 22 Europe Cell Separation Technologies Revenue (USD Million) By Product (2021-2032)
Table 23 Asia Pacific Cell Separation Technologies Revenue (USD Million) By Type (2021-2032)
Table 24 Asia Pacific Cell Separation Technologies Revenue (USD Million) By Application (2021-2032)
Table 25 Asia Pacific Cell Separation Technologies Revenue (USD Million) By Product (2021-2032)
Table 26 South America Cell Separation Technologies Revenue (USD Million) By Type (2021-2032)
Table 27 South America Cell Separation Technologies Revenue (USD Million) By Application (2021-2032)
Table 28 South America Cell Separation Technologies Revenue (USD Million) By Product (2021-2032)
Table 29 Middle East and Africa Cell Separation Technologies Revenue (USD Million) By Type (2021-2032)
Table 30 Middle East and Africa Cell Separation Technologies Revenue (USD Million) By Application (2021-2032)
Table 31 Middle East and Africa Cell Separation Technologies Revenue (USD Million) By Product (2021-2032)
LIST OF FIGURES
Figure 1. Market Scope
Figure 2. Pricing Forecasts Per Unit, 2023- 2032
Figure 3. Porter’s Five Forces
Figure 4. Global Cell Separation Technologies Market Revenue (USD Million) By Regions (2021-2032)
Figure 5. Global Cell Separation Technologies Market Share (%) By Regions (2023)
Figure 6. North America Cell Separation Technologies Revenue (USD Million) By Country (2021-2032)
Figure 7. United States Cell Separation Technologies Revenue (USD Million) By Country (2021-2032)
Figure 8. Canada Cell Separation Technologies Revenue (USD Million) By Country (2021-2032)
Figure 9. Mexico Cell Separation Technologies Revenue (USD Million) By Country (2021-2032)
Figure 10. Europe Cell Separation Technologies Revenue (USD Million) By Country (2021-2032)
Figure 11. Germany Cell Separation Technologies Revenue (USD Million) By Country (2021-2032)
Figure 12. France Cell Separation Technologies Revenue (USD Million) By Country (2021-2032)
Figure 13. United Kingdom Cell Separation Technologies Revenue (USD Million) By Country (2021-2032)
Figure 14. Spain Cell Separation Technologies Revenue (USD Million) By Country (2021-2032)
Figure 15. Italy Cell Separation Technologies Revenue (USD Million) By Country (2021-2032)
Figure 16. Russia Cell Separation Technologies Revenue (USD Million) By Country (2021-2032)
Figure 17. Rest of Europe Cell Separation Technologies Revenue (USD Million) By Country (2021-2032)
Figure 11. Asia Pacific Cell Separation Technologies Revenue (USD Million) By Country (2021-2032)
Figure 12. China Cell Separation Technologies Revenue (USD Million) By Country (2021-2032)
Figure 13. Japan Cell Separation Technologies Revenue (USD Million) By Country (2021-2032)
Figure 14. India Cell Separation Technologies Revenue (USD Million) By Country (2021-2032)
Figure 15. South Korea Cell Separation Technologies Revenue (USD Million) By Country (2021-2032)
Figure 16. Australia Cell Separation Technologies Revenue (USD Million) By Country (2021-2032)
Figure 17. South East Asia Cell Separation Technologies Revenue (USD Million) By Country (2021-2032)
Figure 18. South America Cell Separation Technologies Revenue (USD Million) By Country (2021-2032)
Figure 19. Brazil Cell Separation Technologies Revenue (USD Million) By Country (2021-2032)
Figure 20. Argentina Cell Separation Technologies Revenue (USD Million) By Country (2021-2032)
Figure 21. Rest of Asia Pacific Cell Separation Technologies Revenue (USD Million) By Country (2021-2032)
Figure 22. Middle East and Africa Cell Separation Technologies Revenue (USD Million) By Region (2021-2032)
Figure 23. Saudi Arabia Cell Separation Technologies Revenue (USD Million) By Region (2021-2032)
Figure 24. The UAE Cell Separation Technologies Revenue (USD Million) By Region (2021-2032)
Figure 25. Rest of Middle East Cell Separation Technologies Revenue (USD Million) By Region (2021-2032)
Figure 26. South Africa Cell Separation Technologies Revenue (USD Million) By Region (2021-2032)
Figure 27. Africa Cell Separation Technologies Revenue (USD Million) By Region (2021-2032)
Figure 28. North America Cell Separation Technologies Revenue (USD Million) By Type (2021-2032)
Figure 29. North America Cell Separation Technologies Revenue (USD Million) By Application (2021-2032)
Figure 30. North America Cell Separation Technologies Revenue (USD Million) By Product (2021-2032)
Figure 31. Europe Cell Separation Technologies Revenue (USD Million) By Type (2021-2032)
Figure 32. Europe Cell Separation Technologies Revenue (USD Million) By Application (2021-2032)
Figure 33. Europe Cell Separation Technologies Revenue (USD Million) By Product (2021-2032)
Figure 34. Asia Pacific Cell Separation Technologies Revenue (USD Million) By Type (2021-2032)
Figure 35. Asia Pacific Cell Separation Technologies Revenue (USD Million) By Application (2021-2032)
Figure 36. Asia Pacific Cell Separation Technologies Revenue (USD Million) By Product (2021-2032)
Figure 37. South America Cell Separation Technologies Revenue (USD Million) By Type (2021-2032)
Figure 38. South America Cell Separation Technologies Revenue (USD Million) By Application (2021-2032)
Figure 39. South America Cell Separation Technologies Revenue (USD Million) By Product (2021-2032)
Figure 40. Middle East and Africa Cell Separation Technologies Revenue (USD Million) By Type (2021-2032)
Figure 41. Middle East and Africa Cell Separation Technologies Revenue (USD Million) By Application (2021-2032)
Figure 42. Middle East and Africa Cell Separation Technologies Revenue (USD Million) By Product (2021-2032)
By Product
Instruments
Consumables
By Technology
Gradient Centrifugation
Surface Markers Separation
Fluorescence Activated Cell Sorting
Magnetic Cell Sorting
Filtration Based Separation
By Application
Oncology Research
Neuroscience Research
Stem Cell Research
Microbiology
Immunology Research
Others
By End-User
Research laboratories & Institute
Biotechnology & Biopharmaceutical Companies
Cell Banks
Countries Analyzed
North America (US, Canada, Mexico)
Europe (Germany, UK, France, Spain, Italy, Russia, Rest of Europe)
Asia Pacific (China, India, Japan, South Korea, Australia, South East Asia, Rest of Asia)
South America (Brazil, Argentina, Rest of South America)
Middle East and Africa (Saudi Arabia, UAE, Rest of Middle East, South Africa, Egypt, Rest of Africa)
