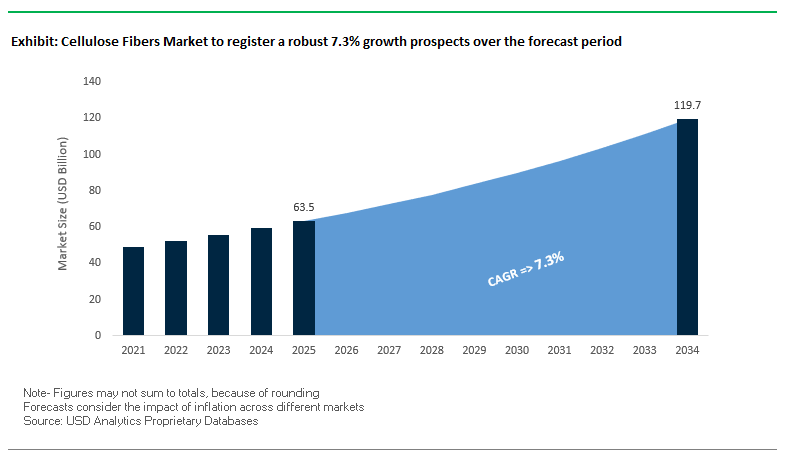
Cellulose Fiber Market to Reach USD 119.7 Billion by 2034 with 7.3% CAGR as Sustainable Textiles Gain Momentum
The global cellulose fiber market is set to grow from USD 63.5 billion in 2025 to USD 119.7 billion by 2034, registering a CAGR of 7.3%. This growth is underpinned by rising demand for sustainable textiles, biodegradable fibers, and circular economy models across fashion, non-woven, and technical applications. Unlike petroleum-based synthetics, cellulose fibers such as viscose, modal, and lyocell are derived from wood pulp sourced from sustainably managed forests, ensuring reduced environmental persistence and a lower carbon footprint.
Advancements in processing technology, particularly closed-loop solvent systems, are improving fiber performance, with benefits like moisture management, breathability, and enhanced durability. The adoption of these methods not only strengthens the market’s eco-credentials but also improves energy and water efficiency by recycling up to 99% of solvents and water. These factors are making cellulose fibers more attractive for both high-performance apparel and industrial textile applications.
Key Insights for Market Professionals
- Market size trajectory: USD 63.5B (2025) → USD 119.7B (2034), CAGR 7.3%.
- Derived from renewable raw materials, mainly sustainably managed forests.
- Biodegradability positions cellulose fibers as a strong alternative to synthetics.
- Closed-loop systems reduce environmental footprint by recycling solvents/water.
- Growth in fashion, non-woven, and technical textiles is driving adoption.
Market Analysis: Strategic Deals and Policy Shifts Shape Cellulose Fiber Expansion
The cellulose fiber market is experiencing rapid evolution, fueled by strategic M&A, innovation in sustainable fiber technologies, and policy-driven momentum toward circular textiles.
In August 2025, American Industrial Partners (AIP) announced the acquisition of International Paper’s Global Cellulose Fibers (GCF) division for USD 1.5 billion, signaling a renewed focus on scaling absorbent pulp and specialty fiber applications. On the same timeline, the Karnataka government in India revealed its plan to revive the Mysore Paper Mills, expanding India’s domestic cellulose fiber capacity.
Policy initiatives are further accelerating demand. The EU’s Sustainable Textile Strategy, rolled out in June 2025, introduced stricter sustainability requirements across textile supply chains, compelling apparel brands to increase their reliance on eco-friendly fibers like lyocell and viscose. That same month, Eastman launched Naia Renew for denim, blending 40% certified recycled content with 60% sustainable wood pulp, highlighting how recycled feedstocks are shaping product portfolios.
Fashion collaborations are also reshaping the market. In April 2025, Lenzing Group partnered with designer Diane von Furstenberg (DVF) to integrate TENCEL and ECOVERO fibers into global fashion collections, pushing cellulosic textiles into mainstream visibility. Meanwhile, ANDRITZ’s new technical center in France (December 2024) is advancing dry molded fiber (DMF) technologies for packaging, expanding cellulose applications beyond textiles into the sustainable packaging industry.
Emerging Trends and Strategic Opportunities Shaping the Global Cellulose Fiber Market
Strategic Shift Towards Circular Feedstocks and Waste Cotton Recycling
The cellulose fiber market is witnessing a transformative trend as manufacturers pivot towards circular economy principles and the utilization of recycled textile waste as primary feedstocks. Leading industry players, such as Lenzing AG, have developed REFIBRA™ technology, upcycling pre- and post-consumer cotton scraps into dissolving pulp to produce TENCEL™ Lyocell fibers, exemplifying a strong commitment to sustainability and resource efficiency. Similarly, Birla Cellulose launched Liva Reviva, a viscose fiber derived from pre-consumer cotton waste, further demonstrating industry adoption of circular feedstocks. This shift is propelled by the staggering volume of textile waste, with less than 1% being recycled into new garments, emphasizing the environmental and economic imperative for change. Partnerships between technology innovators and fiber producers, such as Renewcell and Valmet, are scaling chemical recycling of textile waste into industrially viable feedstocks, creating a new supply chain and fundamentally reshaping the cellulose fiber value chain. The strategic emphasis on recycled cotton positions the industry to reduce dependence on virgin forestry resources while enhancing brand reputation and consumer appeal.
Next-Generation Solvent Systems for Eco-Friendly Lyocell Production
Innovation in solvent systems is driving the eco-friendly Lyocell production trend, with the industry moving beyond traditional N-Methylmorpholine N-oxide (NMMO) to explore next-generation, energy-efficient solvents, including ionic liquids. While NMMO is largely recycled in existing Lyocell processes, its thermal sensitivity and energy-intensive recovery create opportunities for more sustainable alternatives. Academic research highlights that ionic liquids can dissolve cellulose at lower temperatures without additional chemicals, enabling reduced energy consumption and improved fiber quality. Industry pioneers, including Lenzing, continue to optimize solvent recovery systems, achieving over 99% recovery while significantly lowering water and energy usage. This trend presents a high-growth avenue for the cellulose fiber market, offering enhanced production efficiency, superior fiber properties, and a competitive edge against synthetic and man-made fibers.
Cellulose Fiber-Based Nonwovens for Plastic-Free Hygiene Products
The demand for plastic-free, biodegradable nonwovens is creating substantial growth opportunities for cellulose fiber producers. Regulatory frameworks, such as the EU Single-Use Plastics Directive and the UK’s upcoming bans on plastic-containing wet wipes, are driving adoption. Consumers increasingly favor environmentally friendly hygiene products, creating strong market demand. Leading companies, including Lenzing VEOCEL™, market cellulose fibers specifically for single-use nonwovens, highlighting compostability and biodegradability. This trend allows manufacturers of wet wipes, facial masks, and hygiene products to meet regulatory requirements while differentiating their offerings in a competitive market. The expansion of cellulose-based nonwovens represents a major growth avenue by replacing synthetic polymers, reducing plastic waste, and capturing a premium eco-conscious consumer segment.
High-Strength Cellulose Filaments for Technical and Composite Applications
Beyond textiles and hygiene, high-tenacity cellulose filaments are gaining traction as sustainable reinforcements for lightweight composites, providing an alternative to glass or carbon fibers. Research published in Composites Science and Technology demonstrates their high strength-to-weight ratio, reduced abrasiveness on machinery, and suitability for thermoplastic composites. The automotive and aerospace industries are key adopters, leveraging cellulose filaments to meet lightweighting and sustainability targets while reducing carbon footprints. Companies are actively collaborating with industrial partners to validate performance in real-world applications, expanding the cellulose fiber market into a high-value technical segment. This trend not only diversifies end-use applications but also positions cellulose fiber as a pivotal material in the emerging bio-based economy.
Competitive Landscape: Leading Companies Driving the Global Cellulose Fiber Industry
The cellulose fiber market is moderately consolidated, with global leaders like Lenzing, Birla Cellulose, Eastman, Sateri, Sappi, and International Paper (GCF/AIP) driving innovation in sustainable fibers, recycling technologies, and bio-based materials.
Lenzing AG Strengthens Leadership with Sustainable Fiber Partnerships
Lenzing is a pioneer in cellulosic fibers, offering brands like TENCEL and VEOCEL. In October 2024, it acquired a minority stake in TreeToTextile AB, partnering with H&M and Stora Enso to scale next-gen sustainable fibers. Lenzing’s closed-loop production systems recycle up to 99% of water and solvents, making it a global benchmark in circular fiber production. Its fibers are widely used in fashion, home textiles, non-wovens, and industrial applications.
Birla Cellulose Innovates with Sustainable Dyeing Solutions
Part of the Aditya Birla Group, Birla Cellulose is among the largest global producers of viscose, modal, and lyocell fibers. In 2024, it launched Birla Viscose (Intellicolor), a breakthrough dyeing process eliminating soda ash and salt, reducing water and chemical use in textile finishing. With vertical integration across forestry, pulp, and fiber production, Birla holds a supply chain advantage, serving the sustainable fashion industry at scale.
Eastman Expands Circular Portfolio with Naia Renew
Eastman leverages its specialty materials expertise to deliver sustainable fibers under the Naia brand. In June 2025, it introduced Naia Renew for denim, a cellulosic acetate fiber blending recycled content with sustainable wood pulp. Positioned as a leader in circular textiles, Eastman emphasizes comfort, moisture management, and skin-friendly performance, making Naia highly attractive to the apparel and home textile industries.
Sateri Pilots Textile-to-Textile Recycling with FINEX Technology
Asia-based Sateri is one of the world’s largest viscose producers. In August 2024, it piloted its FINEX closed-loop recycling system, converting textile waste back into new fibers a significant step toward textile circularity. Its scale and expertise position Sateri as a cornerstone in the Asian sustainable textile market, particularly in fashion and apparel.
Sappi Ltd. Advances Bio-Based Materials with Dissolving Pulp
Sappi focuses on wood-derived dissolving pulp, a key input for cellulose fiber production. Its sustainability strategy includes decarbonizing operations and expanding bio-based applications beyond textiles, into specialty papers and non-wovens. With a stronghold in renewable materials, Sappi is aligning its portfolio with the global bioeconomy model.
International Paper’s GCF Division Transitions to AIP Ownership
The Global Cellulose Fibers (GCF) division of International Paper, now being acquired by American Industrial Partners (August 2025), produces fluff pulp and specialty pulp for personal care applications like diapers and feminine hygiene. With USD 2.5 billion revenue in 2024, GCF will now sharpen its focus under AIP ownership, driving innovation in absorbent and specialty fibers for the hygiene sector.
Cellulose Fiber Market Share Insights
Man-Made Cellulose Fibers Lead Market Share by Product Type in the Cellulose Fiber Industry
Man-made cellulose fibers (MMCFs) account for 68% of the global cellulose fiber market, cementing their position as the dominant category. Fibers such as viscose, lyocell, and modal combine sustainability credentials with superior performance attributes including softness, drapability, and moisture-wicking making them highly competitive against synthetic fibers like polyester. The versatility of MMCFs enables adoption across fashion, hygiene, and technical applications, ensuring steady volume growth. A key growth driver is lyocell, produced through a closed-loop process that reduces chemical waste and water usage, aligning strongly with circular economy goals and brand-level sustainability commitments. While natural cellulose fibers like cotton remain significant, volatility in pricing, high resource consumption, and rising ESG scrutiny are eroding their relative dominance. The innovation pipeline and premium positioning of MMCFs secure their majority share.
Apparel & Textiles Secure the Largest Market Share by Application in the Cellulose Fiber Industry
The apparel and textiles segment consumes 48% of global cellulose fiber demand, confirming its position as the industry’s anchor application. Fashion brands, from fast fashion retailers to premium luxury houses, are accelerating adoption of MMCFs as part of their eco-conscious collections, responding to consumer demand for renewable, biodegradable materials. The sector benefits from cellulose fibers’ ability to provide cotton-like comfort with lower environmental impact, making them central to sustainable fashion narratives. Beyond apparel, hygiene and medical applications represent a high-value, non-cyclical demand driver, but apparel’s sheer scale makes it the undisputed leader. Post-pandemic shifts toward sustainability, combined with increasing regulatory pressures on textile waste, continue to fuel adoption of cellulose fibers in apparel, reinforcing its dominant market share.
United States: Sustainability Regulations and Smart Investments Driving Cellulose Fiber Adoption
The United States cellulose fiber market is witnessing rapid expansion fueled by sustainability regulations, corporate investments, and technological innovation. The EPA’s National Strategy to Prevent Plastic Pollution (Nov 2024) promotes biodegradable alternatives and is compelling industries to shift toward eco-friendly cellulose fibers. In line with this, Lenzing AG expanded its Tencel brand in 2023, while Eastman Chemical Company invested in a bio-based cellulose fiber facility in Feb 2025, underscoring the growing consumer preference for green materials. On the technology front, innovations like ionic liquid dissolution are boosting fiber yield and purity, while Sci-Lume Labs’ “Bylon” (Jan 2025) a melt-spinnable circular fiber from agricultural waste represents a breakthrough in bio-based synthetics.
Demand is strongest in textiles and apparel, with global brands such as Levi Strauss & Co. and Nike integrating cellulose fibers into sustainable collections. Rising use in home textiles, nonwovens, and technical textiles further diversifies applications. Government support through the Technology Development Board (TDB), which funds fiber development from hemp, flax, and nettle, strengthens the circular economy framework. Additionally, the surge in direct-to-consumer (DTC) e-commerce packaging has positioned cellulose fibers as a sustainable alternative in logistics and packaging. Together, regulatory incentives, corporate initiatives, and growing applications ensure the U.S. maintains a leadership role in the global cellulose fiber industry.
Germany: EU Packaging Rules and Industry 4.0 Advancing Cellulose Fiber Innovation
Germany’s cellulose fiber market is driven by one of the strictest sustainability frameworks in Europe. The EU Packaging and Packaging Waste Regulation (PPWR), enforced in Feb 2025, mandates that all packaging be recyclable or reusable by 2030, directly impacting the pulp, paper, and textile sectors. This regulatory push aligns with Germany’s broader commitment to a circular economy and high water-quality standards, boosting adoption of eco-friendly cellulose fibers. At the same time, the Plattform Industrie 4.0 initiative is transforming fiber production with automation, IoT, and smart factory solutions, ensuring efficiency and scalability.
Germany is also a hub for technological breakthroughs. In Jan 2025, Fibers365 was nominated for its chemical-free hemp365 process, while SA-Dynamics was recognized for its cellulose aerogel textiles, which deliver sustainable insulation. Applications are strongest in textiles, nonwovens, and specialty papers, with hygiene-related nonwoven products seeing sharp demand growth. German companies and universities are heavily investing in R&D collaborations, exploring new fiber materials and performance functionalities. The country’s strong emphasis on sustainability, automation, and innovation makes Germany a European leader in advancing cellulose fiber technology.
China: Dual Carbon Policy and Domestic Manufacturing Scaling Cellulose Fiber Market
China’s cellulose fiber market is propelled by the government’s dual carbon goal, which emphasizes green industrial transformation under the 14th Five-Year Plan (2021–2025). The China National Textile and Apparel Council’s (CNTAC) 30:60 Carbon Neutrality Acceleration Plan supports companies in integrating low-carbon cellulose fibers into textiles and consumer goods. The State Administration for Market Regulation (SAMR) is updating GB standards to align with global benchmarks, ensuring industrial safety and consumer trust.
Chinese manufacturers are accelerating automation, AI, and “5G + industrial internet” integration to scale fiber production efficiently. A major trend is domestic substitution, as local firms expand to replace imported fibers with homegrown alternatives. Demand is driven by the booming textile and apparel sector, particularly for sustainable and premium-quality fabrics. China is also a leader in cellulose fiber patents, reflecting its commitment to innovation and research into new production methods. These initiatives, combined with strong domestic consumption and policy support, position China as both a high-volume producer and a global innovator in cellulose fiber manufacturing.
India: Government Missions and Export Growth Driving Cellulose Fiber Expansion
India’s cellulose fiber market is advancing under strong government initiatives and rising export opportunities. The Make in India and Zero Effect Zero Defect missions emphasize domestic sustainable production, while the Technology Development Board (TDB) funded Grasim Industries in establishing a 50 TPD solvent-spun Lyocell fiber line in Gujarat, enhancing India’s position in advanced fiber manufacturing. Regulatory efforts by the MoEFCC, including bans on single-use plastics and a 30% recycled plastic mandate in beverage bottles (effective April 2025), indicate a broader national direction toward sustainable materials.
The Indian market is also seeing significant corporate investment, with Siegwerk announcing INR 350 crore (Sept 2025) for sustainability and innovation projects. On the technology side, companies are adopting automated processes to convert agricultural waste into cellulose fibers, ensuring cost-efficient production. Exports play a pivotal role, as Indian firms upgrade facilities to meet European and North American standards, boosting their global competitiveness. The expanding textile and apparel industry, coupled with government-backed sustainability mandates, ensures India’s cellulose fiber sector continues to thrive as a major global supplier.
Brazil: Recycling Laws and Sustainable Practices Strengthening Cellulose Fiber Demand
Brazil’s cellulose fiber market is growing rapidly due to a combination of regulatory reforms, sustainability targets, and technological upgrades. The 2010 National Solid Waste Policy and the 2024 ban on single-use disposable items (effective by 2030) directly influence pulp and paper industries to adopt recyclable and compostable materials. New rules requiring 30% mandatory recycling by 2025 and 50% by 2040 further reinforce the role of cellulose fibers in sustainable manufacturing. ANVISA’s RDC 843/2024 has simplified compliance, enabling companies to bring eco-friendly products to market faster.
Brazilian pulp and paper leaders are also embracing robotics and AI for automated sorting and defect detection, driving efficiency and precision. Companies like Suzano (formerly Fibria) and Veolia are global sustainability benchmarks, converting industrial cellulose waste into soil acidity correctives for eucalyptus plantations, demonstrating true circular economy practices. Applications remain strongest in pulp, paper, food processing, and packaging, while corporate investments in advanced machinery ensure readiness for new green material requirements. Brazil’s regulatory backing, sustainable innovation, and strong pulp production base solidify its role as a Latin American hub for cellulose fiber growth.
Japan: CNF Innovation and Precision Manufacturing Transforming Cellulose Fiber Applications
Japan stands out in the cellulose fiber market with its strong emphasis on nanotechnology and precision engineering. The Plastic Resource Circulation Act (2022) has laid the foundation for a sustainable fiber ecosystem by encouraging manufacturers to reduce plastics and design eco-friendly materials. Japan leads in cellulose nanofiber (CNF) commercialization, with Asahi Kasei (Apr 2025) launching CNF-reinforced thermoplastics for EV components and Oji Holdings (Mar 2025) introducing CNF-based flexible sheets for electronics and automotive sectors.
The Japanese cellulose fiber industry is also known for constant functional innovation, producing high-performance fibers with enhanced heat resistance, dimensional stability, and deformation resistance. Corporate players like Toppan are advancing recyclable, high-barrier packaging solutions, while Nippon Paper Industries (Feb 2025) expanded CNF production at its Ishinomaki mill to support packaging and electronic applications. Universities and research institutes further drive innovation by experimenting with biopolymers and natural agents to develop next-gen cellulose fiber solutions. With its blend of precision manufacturing, nanotechnology, and regulatory support, Japan continues to shape the global future of cellulose fiber innovation.
Cellulose Fibers Market Report Scope
Cellulose Fibers Market
|
Parameter
|
Details
|
|
Market Size (2025)
|
$63.5 Billion
|
|
Market Size (2034)
|
$119.7 Billion
|
|
Market Growth Rate
|
7.3%
|
|
Segments
|
By Product Type (Natural Cellulose Fiber, Man-made Cellulose Fiber), By Application (Apparel & Textiles, Industrial, Hygiene & Medical, Technical Textiles, Home Furnishings, Paper & Pulp, Composites), By End-Use Industry (Fashion & Apparel, Construction, Automotive, Healthcare, Packaging, Filtration), By Raw Material Source (Wood Pulp, Non-wood Plant Sources)
|
|
Study Period
|
2019- 2024 and 2025-2034
|
|
Units
|
Revenue (USD)
|
|
Qualitative Analysis
|
Porter’s Five Forces, SWOT Profile, Market Share, Scenario Forecasts, Market Ecosystem, Company Ranking, Market Dynamics, Industry Benchmarking
|
|
Companies
|
Lenzing AG, Aditya Birla Group (Grasim Industries), Sateri, Eastman Chemical Company, Nippon Paper Industries Co., Ltd., Suzano S.A., Sappi Limited, Kelheim Fibres GmbH, Tangshan Sanyou Group Xingda Chemical Fibre Co., Ltd., Fulida Group Holding Co. Ltd, Thai Rayon Public Co., Ltd., CFF GmbH & Co. KG, Fibrex, Nanocellulose & Cellulose Nanofibers (CNF), China Hi-Tech Group Corporation
|
|
Countries
|
US, Canada, Mexico, Germany, France, Spain, Italy, UK, Russia, China, India, Japan, South Korea, Australia, South East Asia, Brazil, Argentina, Middle East, Africa
|
Cellulose Fiber Market Segmentation
By Product Type
- Natural Cellulose Fiber
- Man-made Cellulose Fiber
By Application
- Apparel & Textiles
- Industrial
- Hygiene & Medical
- Technical Textiles
- Home Furnishings
- Paper & Pulp
- Composites
By End-Use Industry
- Fashion & Apparel
- Construction
- Automotive
- Healthcare
- Packaging
- Filtration
By Raw Material Source
- Wood Pulp
- Non-wood Plant Sources
Countries Analyzed
- North America (US, Canada, Mexico)
- Europe (Germany, UK, France, Spain, Italy, Russia, Rest of Europe)
- Asia Pacific (China, India, Japan, South Korea, Australia, South East Asia, Rest of Asia)
- South America (Brazil, Argentina, Rest of South America)
- Middle East and Africa (Saudi Arabia, UAE, Rest of Middle East, South Africa, Egypt, Rest of Africa)
Top Companies in Cellulose Fiber Market
- Lenzing AG
- Aditya Birla Group (Grasim Industries)
- Sateri
- Eastman Chemical Company
- Nippon Paper Industries Co., Ltd.
- Suzano S.A.
- Sappi Limited
- Kelheim Fibres GmbH
- Tangshan Sanyou Group Xingda Chemical Fibre Co., Ltd.
- Fulida Group Holding Co. Ltd
- Thai Rayon Public Co., Ltd.
- CFF GmbH & Co. KG
- Fibrex
- Nanocellulose & Cellulose Nanofibers (CNF)
- China Hi-Tech Group Corporation
* List Not Exhaustive
Methodology
USDAnalytics employs a robust, multi-step research methodology to deliver accurate, actionable insights into the global cellulose fiber market. Our approach combines primary research, including detailed interviews with key stakeholders such as fiber manufacturers, textile innovators, industrial end-users, and regulatory experts, with exhaustive secondary research from company filings, sustainability reports, academic publications, patent databases, and global policy frameworks. Market sizing, growth projections, and trend analyses cover product types such as natural and man-made cellulose fibers including viscose, lyocell, and modal across applications spanning apparel, non-wovens, hygiene, technical textiles, and composites. USDAnalytics also evaluates raw material sourcing strategies, including wood pulp and non-wood plant alternatives, as well as circular economy initiatives like recycled cotton feedstocks and closed-loop solvent systems. Regional regulatory landscapes including EU sustainability mandates, U.S. EPA directives, China’s dual carbon policy, India’s Make in India mission, and Brazil’s recycling laws are integrated into market forecasts to reflect compliance-driven demand. Furthermore, corporate strategies, technological innovations such as ionic liquid solvent systems, cellulose nanofibers, and high-tenacity filaments, along with strategic M&A and partnerships, are analyzed to provide industry professionals with a holistic view of market opportunities, competitive dynamics, and sustainable growth avenues.
Deliverables:
- Comprehensive Market Research Report (PDF and Excel) with detailed tables, charts, and interactive visualizations.
- Country-Specific Forecasts & Analysis.
- Segment-Wise Revenue Forecasts (2025–2034).
- Competitive Analysis, Benchmarking, and SWOT Profiles.
- Recent Developments & Innovation Tracker.
- Executive Summary & Analyst Commentary.
- Post-Purchase Analyst Support for Client-Specific Questions and Custom Data Requirements.
