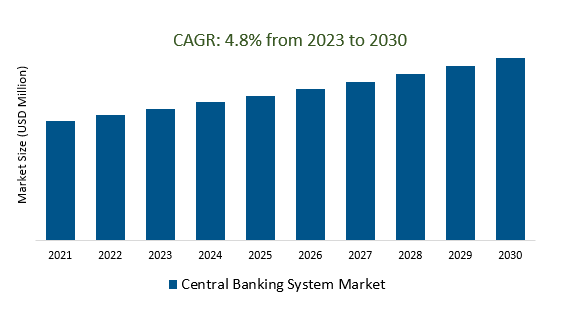
The Global Central Banking System Market Size is estimated to register 4.8% growth over the forecast period from 2023 to 2030.
The Central Banking System Market is influenced by various drivers and trends, including monetary policy, economic stability, FinTech, regulatory changes, global economic conditions, and cybersecurity. Central banks are exploring digital currencies (CBDCs) to modernize payment systems, integrating sustainability into their policies, leveraging data analytics and AI for better forecasting, real-time payments, and collaboration with FinTech firms. They are also exploring cryptocurrencies and digital assets to mitigate risks and ensure consumer protection. Financial inclusion is a growing focus, and blockchain technology is being explored for applications like digital identity and cross-border payments. Climate risk assessments are also being incorporated into financial stability evaluations, and cybersecurity measures are being enhanced to protect critical financial infrastructure from cyber threats.
The Impact of Central Banks' Monetary Policy on Financial Markets.
Central banks play a pivotal role in shaping financial markets within the central banking system. Their monetary policy decisions exert a profound influence on market dynamics. Through interest rate adjustments and open market operations, central banks manage money supply and influence borrowing costs. These actions can stimulate economic growth or curb inflation, directly impacting stock, bond, and currency markets. Investors closely watch central bank announcements, as shifts in policy can lead to market rallies or downturns. Central banks also serve as lenders of last resort, providing stability during financial crises, thereby averting systemic collapses. The interplay between central bank policies and financial markets remains a central element of the modern financial landscape.
The Emergence of Central Bank Digital Currencies (CBDCs) in Response to the FinTech Revolution is boosting the market.
The emergence of Central Bank Digital Currencies (CBDCs) represents a pivotal response to the transformative wave of financial technology (FinTech) innovations. As the financial landscape evolves rapidly, CBDCs are becoming instrumental in reshaping the global monetary framework. This development is profoundly impacting the Central Banking System Market, driving significant growth and adaptation. CBDCs promise to streamline financial transactions, enhance security, and improve transparency, which are all crucial aspects in an era marked by digital financial acceleration. As central banks worldwide explore and implement CBDCs, they are adapting to meet the changing needs of a digital-first economy. This not only ensures greater financial stability but also reinforces the position of central banks as key players in the digital economy, underlining the symbiotic relationship between CBDCs and the Central Banking System Market.
The Integration of Data Analytics and AI for Enhanced Forecasting, Risk Assessment, and Regulatory Compliance is fuelling demand in the market.
The seamless integration of data analytics and artificial intelligence (AI) has emerged as a powerful catalyst within the Central Banking System Market. This dynamic synergy empowers central banks to achieve superior forecasting accuracy, robust risk assessment capabilities, and heightened regulatory compliance. By harnessing AI-driven algorithms and data analytics tools, central banks can dissect vast datasets to extract valuable insights, facilitating well-informed monetary policy decisions. This innovative approach not only enhances the efficiency of central banking operations but also bolsters their ability to navigate an increasingly complex financial landscape. Consequently, the demand for such cutting-edge technologies is surging, as central banks worldwide recognize the imperative of adapting to this transformative trend to ensure economic stability and sustainable growth.
Market Share Analysis:
On-premises central banking systems have long been the stalwarts of financial institutions, offering a robust and secure infrastructure for managing the intricate processes of monetary control. However, in recent times, a significant shift is occurred as cloud-based systems are swiftly rising in prominence.
The transition is driven by the need for greater flexibility, scalability, and cost-efficiency. Cloud-based solutions provide central banks with the ability to adapt swiftly to evolving financial landscapes and dynamic economic conditions. Their appeal lies in the agility they offer, enabling central banks to access data and resources from anywhere, enhancing collaboration and real-time decision-making. Despite the ongoing dominance of on-premises systems, the burgeoning popularity of cloud solutions suggests a transformative era for central banking operations, one that emphasizes innovation, adaptability, and the efficient allocation of resources. In this changing landscape, central banks are compelled to carefully weigh the advantages and security concerns associated with both options before embracing the future of financial management.
Banks stand as the undisputed cornerstone of the central banking system market.
Their pivotal role is characterized by the vast web of financial services they offer, including deposit-taking, lending, and monetary policy implementation. Central to this system, banks act as intermediaries between the central bank and the public, playing an essential role in the transmission of monetary policy. They also foster economic growth by providing credit to individuals and businesses. Furthermore, banks serve as gatekeepers, safeguarding the stability and integrity of the financial system through prudent risk management. Their influence extends to international finance, with global banks exerting a significant impact on foreign exchange markets and cross-border capital flows. In essence, banks reign supreme in the central banking system, wielding considerable power and responsibility in shaping the financial landscape.
North America stands as the paramount stronghold in the central banking system market.
Renowned for its economic prowess and financial stability, this region exerts a substantial influence on the global financial landscape. Central banks within North America, including the Federal Reserve in the United States and the Bank of Canada, are instrumental in shaping monetary policies that resonate worldwide. Their innovative approaches to managing currency, interest rates, and financial stability have set the benchmark for central banking practices across the globe. North America's dominance in the central banking system market is further underscored by its commitment to technological advancements, financial regulation, and economic research. The region's financial institutions, cutting-edge technologies, and deep-rooted expertise contribute to the resilience and adaptability of its central banking sector. As a result, North America's influence reverberates far beyond its borders, leaving an indelible mark on the global financial ecosystem and reinforcing its role as a central hub for the world's economic stability and monetary policy development.
Central Banking System Market Segmentation
By Type
By Application
- Financial Institution
- Banks
- Insurance Institution
- Others
By Region
- North America (United States, Canada, Mexico)
- Europe (Germany, France, United Kingdom, Spain, Italy, Others)
- Asia Pacific (China, India, Japan, South Korea, Australia, Others)
- Latin America (Brazil, Argentina, Others)
- Middle East and Africa (Saudi Arabia, UAE, Kuwait, Other Middle East, South Africa, Nigeria, Other Africa)
Central Banking System Market Companies
- FIS
- Oracle
- Infosys
- Capgemini
- Tata Consultancy Services
- Temenos Group
- SAP
- Finastra
- Unisys
- HCL Technologies
- Infrasoft Technologies
- Fiserv
- Jack Henry & Associates
- EdgeVerve
- Intellect Design Arena
- Sopra Steria
- Ares International
- BML Istisharat
- Symitar
- Intertech
- AutoRek
- ACI Worldwide
- Five Degrees
- ERI Bancaire
- Exictos
*List not exhaustive
Central Banking System Market Outlook 2023
1 Market Overview
1.1 Introduction to the Central Banking System Market
1.2 Scope of the Study
1.3 Research Objective
1.3.1 Key Market Scope and Segments
1.3.2 Players Covered
1.3.3 Years Considered
2 Executive Summary
2.1 2023 Central Banking System Industry- Market Statistics
3 Market Dynamics
3.1 Market Drivers
3.2 Market Challenges
3.3 Market Opportunities
3.4 Market Trends
4 Market Factor Analysis
4.1 Porter’s Five Forces
4.2 Market Entropy
4.2.1 Global Central Banking System Market Companies with Area Served
4.2.2 Products Offerings Global Central Banking System Market
5 COVID-19 Impact Analysis and Outlook Scenarios
5.1.1 Covid-19 Impact Analysis
5.1.2 post-COVID-19 Scenario- Low Growth Case
5.1.3 post-COVID-19 Scenario- Reference Growth Case
5.1.4 post-COVID-19 Scenario- Low Growth Case
6 Global Central Banking System Market Trends
6.1 Global Central Banking System Revenue (USD Million) and CAGR (%) by Type (2018-2030)
6.2 Global Central Banking System Revenue (USD Million) and CAGR (%) by Applications (2018-2030)
6.3 Global Central Banking System Revenue (USD Million) and CAGR (%) by regions (2018-2030)
7 Global Central Banking System Market Revenue (USD Million) by Type, and Applications (2018-2022)
7.1 Global Central Banking System Revenue (USD Million) by Type (2018-2022)
7.1.1 Global Central Banking System Revenue (USD Million), Market Share (%) by Type (2018-2022)
7.2 Global Central Banking System Revenue (USD Million) by Applications (2018-2022)
7.2.1 Global Central Banking System Revenue (USD Million), Market Share (%) by Applications (2018-2022)
8 Global Central Banking System Development Regional Status and Outlook
8.1 Global Central Banking System Revenue (USD Million) By Regions (2018-2022)
8.2 North America Central Banking System Revenue (USD Million) by Type, and Application (2018-2022)
8.2.1 North America Central Banking System Revenue (USD Million) by Country (2018-2022)
8.2.2 North America Central Banking System Revenue (USD Million) by Type (2018-2022)
8.2.3 North America Central Banking System Revenue (USD Million) by Applications (2018-2022)
8.3 Europe Central Banking System Revenue (USD Million), by Type, and Applications (USD Million) (2018-2022)
8.3.1 Europe Central Banking System Revenue (USD Million), by Country (2018-2022)
8.3.2 Europe Central Banking System Revenue (USD Million) by Type (2018-2022)
8.3.3 Europe Central Banking System Revenue (USD Million) by Applications (2018-2022)
8.4 Asia Pacific Central Banking System Revenue (USD Million), and Revenue (USD Million) by Type, and Applications (2018-2022)
8.4.1 Asia Pacific Central Banking System Revenue (USD Million) by Country (2018-2022)
8.4.2 Asia Pacific Central Banking System Revenue (USD Million) by Type (2018-2022)
8.4.3 Asia Pacific Central Banking System Revenue (USD Million) by Applications (2018-2022)
8.5 South America Central Banking System Revenue (USD Million), by Type, and Applications (2018-2022)
8.5.1 South America Central Banking System Revenue (USD Million), by Country (2018-2022)
8.5.2 South America Central Banking System Revenue (USD Million) by Type (2018-2022)
8.5.3 South America Central Banking System Revenue (USD Million) by Applications (2018-2022)
8.6 Middle East and Africa Central Banking System Revenue (USD Million), by Type, Technology, Application, Thickness (2018-2022)
8.6.1 Middle East and Africa Central Banking System Revenue (USD Million) by Country (2018-2022)
8.6.2 Middle East and Africa Central Banking System Revenue (USD Million) by Type (2018-2022)
8.6.3 Middle East and Africa Central Banking System Revenue (USD Million) by Applications (2018-2022)
9 Company Profiles
10 Global Central Banking System Market Revenue (USD Million), by Type, and Applications (2023-2030)
10.1 Global Central Banking System Revenue (USD Million) and Market Share (%) by Type (2023-2030)
10.1.1 Global Central Banking System Revenue (USD Million), and Market Share (%) by Type (2023-2030)
10.2 Global Central Banking System Revenue (USD Million) and Market Share (%) by Applications (2023-2030)
10.2.1 Global Central Banking System Revenue (USD Million), and Market Share (%) by Applications (2023-2030)
11 Global Central Banking System Development Regional Status and Outlook Forecast
11.1 Global Central Banking System Revenue (USD Million) By Regions (2023-2030)
11.2 North America Central Banking System Revenue (USD Million) by Type, and Applications (2023-2030)
11.2.1 North America Central Banking System Revenue (USD) Million by Country (2023-2030)
11.2.2 North America Central Banking System Revenue (USD Million), by Type (2023-2030)
11.2.3 North America Central Banking System Revenue (USD Million), Market Share (%) by Applications (2023-2030)
11.3 Europe Central Banking System Revenue (USD Million), by Type, and Applications (2023-2030)
11.3.1 Europe Central Banking System Revenue (USD Million), by Country (2023-2030)
11.3.2 Europe Central Banking System Revenue (USD Million), by Type (2023-2030)
11.3.3 Europe Central Banking System Revenue (USD Million), by Applications (2023-2030)
11.4 Asia Pacific Central Banking System Revenue (USD Million) by Type, and Applications (2023-2030)
11.4.1 Asia Pacific Central Banking System Revenue (USD Million), by Country (2023-2030)
11.4.2 Asia Pacific Central Banking System Revenue (USD Million), by Type (2023-2030)
11.4.3 Asia Pacific Central Banking System Revenue (USD Million), by Applications (2023-2030)
11.5 South America Central Banking System Revenue (USD Million), by Type, and Applications (2023-2030)
11.5.1 South America Central Banking System Revenue (USD Million), by Country (2023-2030)
11.5.2 South America Central Banking System Revenue (USD Million), by Type (2023-2030)
11.5.3 South America Central Banking System Revenue (USD Million), by Applications (2023-2030)
11.6 Middle East and Africa Central Banking System Revenue (USD Million), by Type, and Applications (2023-2030)
11.6.1 Middle East and Africa Central Banking System Revenue (USD Million), by region (2023-2030)
11.6.2 Middle East and Africa Central Banking System Revenue (USD Million), by Type (2023-2030)
11.6.3 Middle East and Africa Central Banking System Revenue (USD Million), by Applications (2023-2030)
12 Methodology and Data Sources
12.1 Methodology/Research Approach
12.1.1 Research Programs/Design
12.1.2 Market Size Estimation
12.1.3 Market Breakdown and Data Triangulation
12.2 Data Sources
12.2.1 Secondary Sources
12.2.2 Primary Sources
12.3 Disclaimer
List of Tables
Table 1 Market Segmentation Analysis
Table 2 Global Central Banking System Market Companies with Areas Served
Table 3 Products Offerings Global Central Banking System Market
Table 4 Low Growth Scenario Forecasts
Table 5 Reference Case Growth Scenario
Table 6 High Growth Case Scenario
Table 7 Global Central Banking System Revenue (USD Million) And CAGR (%) By Type (2018-2030)
Table 8 Global Central Banking System Revenue (USD Million) And CAGR (%) By Applications (2018-2030)
Table 9 Global Central Banking System Revenue (USD Million) And CAGR (%) By Regions (2018-2030)
Table 10 Global Central Banking System Revenue (USD Million) By Type (2018-2022)
Table 11 Global Central Banking System Revenue Market Share (%) By Type (2018-2022)
Table 12 Global Central Banking System Revenue (USD Million) By Applications (2018-2022)
Table 13 Global Central Banking System Revenue Market Share (%) By Applications (2018-2022)
Table 14 Global Central Banking System Market Revenue (USD Million) By Regions (2018-2022)
Table 15 Global Central Banking System Market Share (%) By Regions (2018-2022)
Table 16 North America Central Banking System Revenue (USD Million) By Country (2018-2022)
Table 17 North America Central Banking System Revenue (USD Million) By Type (2018-2022)
Table 18 North America Central Banking System Revenue (USD Million) By Applications (2018-2022)
Table 19 Europe Central Banking System Revenue (USD Million) By Country (2018-2022)
Table 20 Europe Central Banking System Revenue (USD Million) By Type (2018-2022)
Table 21 Europe Central Banking System Revenue (USD Million) By Applications (2018-2022)
Table 22 Asia Pacific Central Banking System Revenue (USD Million) By Country (2018-2022)
Table 23 Asia Pacific Central Banking System Revenue (USD Million) By Type (2018-2022)
Table 24 Asia Pacific Central Banking System Revenue (USD Million) By Applications (2018-2022)
Table 25 South America Central Banking System Revenue (USD Million) By Country (2018-2022)
Table 26 South America Central Banking System Revenue (USD Million) By Type (2018-2022)
Table 27 South America Central Banking System Revenue (USD Million) By Applications (2018-2022)
Table 28 Middle East and Africa Central Banking System Revenue (USD Million) By Region (2018-2022)
Table 29 Middle East and Africa Central Banking System Revenue (USD Million) By Type (2018-2022)
Table 30 Middle East and Africa Central Banking System Revenue (USD Million) By Applications (2018-2022)
Table 31 Financial Analysis
Table 32 Global Central Banking System Revenue (USD Million) By Type (2023-2030)
Table 33 Global Central Banking System Revenue Market Share (%) By Type (2023-2030)
Table 34 Global Central Banking System Revenue (USD Million) By Applications (2023-2030)
Table 35 Global Central Banking System Revenue Market Share (%) By Applications (2023-2030)
Table 36 Global Central Banking System Market Revenue (USD Million), And Revenue (USD Million) By Regions (2023-2030)
Table 37 North America Central Banking System Revenue (USD)By Country (2023-2030)
Table 38 North America Central Banking System Revenue (USD Million) By Type (2023-2030)
Table 39 North America Central Banking System Revenue (USD Million) By Applications (2023-2030)
Table 40 Europe Central Banking System Revenue (USD Million) By Country (2023-2030)
Table 41 Europe Central Banking System Revenue (USD Million) By Type (2023-2030)
Table 42 Europe Central Banking System Revenue (USD Million) By Applications (2023-2030)
Table 43 Asia Pacific Central Banking System Revenue (USD Million) By Country (2023-2030)
Table 44 Asia Pacific Central Banking System Revenue (USD Million) By Type (2023-2030)
Table 45 Asia Pacific Central Banking System Revenue (USD Million) By Applications (2023-2030)
Table 46 South America Central Banking System Revenue (USD Million) By Country (2023-2030)
Table 47 South America Central Banking System Revenue (USD Million) By Type (2023-2030)
Table 48 South America Central Banking System Revenue (USD Million) By Applications (2023-2030)
Table 49 Middle East and Africa Central Banking System Revenue (USD Million) By Region (2023-2030)
Table 50 Middle East and Africa Central Banking System Revenue (USD Million) By Region (2023-2030)
Table 51 Middle East and Africa Central Banking System Revenue (USD Million) By Type (2023-2030)
Table 52 Middle East and Africa Central Banking System Revenue (USD Million) By Applications (2023-2030)
Table 53 Research Programs/Design for This Report
Table 54 Key Data Information from Secondary Sources
Table 55 Key Data Information from Primary Sources
List of Figures
Figure 1 Market Scope
Figure 2 Porter’s Five Forces
Figure 3 Global Central Banking System Revenue (USD Million) By Type (2018-2022)
Figure 4 Global Central Banking System Revenue Market Share (%) By Type (2022)
Figure 5 Global Central Banking System Revenue (USD Million) By Applications (2018-2022)
Figure 6 Global Central Banking System Revenue Market Share (%) By Applications (2022)
Figure 7 Global Central Banking System Market Revenue (USD Million) By Regions (2018-2022)
Figure 8 Global Central Banking System Market Share (%) By Regions (2022)
Figure 9 North America Central Banking System Revenue (USD Million) By Country (2018-2022)
Figure 10 North America Central Banking System Revenue (USD Million) By Type (2018-2022)
Figure 11 North America Central Banking System Revenue (USD Million) By Applications (2018-2022)
Figure 12 Europe Central Banking System Revenue (USD Million) By Country (2018-2022)
Figure 13 Europe Central Banking System Revenue (USD Million) By Type (2018-2022)
Figure 14 Europe Central Banking System Revenue (USD Million) By Applications (2018-2022)
Figure 15 Asia Pacific Central Banking System Revenue (USD Million) By Country (2018-2022)
Figure 16 Asia Pacific Central Banking System Revenue (USD Million) By Type (2018-2022)
Figure 17 Asia Pacific Central Banking System Revenue (USD Million) By Applications (2018-2022)
Figure 18 South America Central Banking System Revenue (USD Million) By Country (2018-2022)
Figure 19 South America Central Banking System Revenue (USD Million) By Type (2018-2022)
Figure 20 South America Central Banking System Revenue (USD Million) By Applications (2018-2022)
Figure 21 Middle East and Africa Central Banking System Revenue (USD Million) By Region (2018-2022)
Figure 22 Middle East and Africa Central Banking System Revenue (USD Million) By Type (2018-2022)
Figure 23 Middle East and Africa Central Banking System Revenue (USD Million) By Applications (2018-2022)
Figure 24 Global Central Banking System Revenue (USD Million) By Type (2023-2030)
Figure 25 Global Central Banking System Revenue Market Share (%) By Type (2030)
Figure 26 Global Central Banking System Revenue (USD Million) By Applications (2023-2030)
Figure 27 Global Central Banking System Revenue Market Share (%) By Applications (2030)
Figure 28 Global Central Banking System Market Revenue (USD Million) By Regions (2023-2030)
Figure 29 North America Central Banking System Revenue (USD Million) By Country (2023-2030)
Figure 30 North America Central Banking System Revenue (USD Million) By Type (2023-2030)
Figure 31 North America Central Banking System Revenue (USD Million) By Applications (2023-2030)
Figure 32 Europe Central Banking System Revenue (USD Million) By Country (2023-2030)
Figure 33 Europe Central Banking System Revenue (USD Million) By Type (2023-2030)
Figure 34 Europe Central Banking System Revenue (USD Million) By Applications (2023-2030)
Figure 35 Asia Pacific Central Banking System Revenue (USD Million) By Country (2023-2030)
Figure 36 Asia Pacific Central Banking System Revenue (USD Million) By Type (2023-2030)
Figure 37 Asia Pacific Central Banking System Revenue (USD Million) By Applications (2023-2030)
Figure 38 South America Central Banking System Revenue (USD Million) By Country (2023-2030)
Figure 39 South America Central Banking System Revenue (USD Million) By Type (2023-2030)
Figure 40 South America Central Banking System Revenue (USD Million) By Applications (2023-2030)
Figure 41 Middle East and Africa Central Banking System Revenue (USD Million) By Region (2023-2030)
Figure 42 Middle East and Africa Central Banking System Revenue (USD Million) By Region (2023-2030)
Figure 43 Middle East and Africa Central Banking System Revenue (USD Million) By Type (2023-2030)
Figure 44 Middle East and Africa Central Banking System Revenue (USD Million) By Applications (2023-2030)
Figure 45 Bottom-Up and Top-Down Approaches for This Report
Figure 46 Data Triangulation
