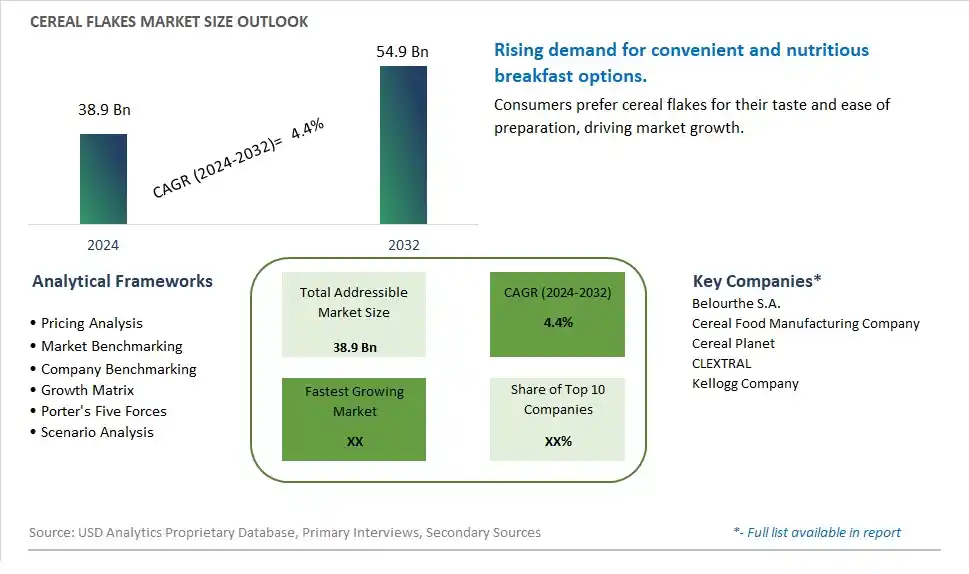
Global Cereal Flakes Market Size is valued at $38.9 Billion in 2024 and is forecast to register a growth rate (CAGR) of 4.4% to reach $54.9 Billion by 2032.
The global Cereal Flakes Market Comprehensive Study analyzes and forecasts the market size across 6 regions and 24 countries for diverse segments -By Type (Traditional, Ready to eat), By Product (Organic, Conventional), By Raw Material (Wheat, Barley, Rice, Maize, Oats, Popcorn, Rye), By Distribution Channel (Supermarkets/Hypermarkets, Convenience Stores, Online Retail, Others)
An Introduction to Cereal Flakes Market
The Cereal Flakes market in 2024 is expanding rapidly, driven by the increasing demand for convenient and nutritious breakfast options. Cereal flakes, made from grains such as corn, wheat, and oats, are popular for their versatility, ease of preparation, and nutritional benefits. The market is supported by the growing trend towards healthy eating and the demand for high-quality, minimally processed breakfast foods. Advances in cereal production and fortification technologies are enhancing the flavor, texture, and nutritional content of cereal flakes. The market is also benefiting from the trend towards clean-label and organic products, appealing to health-conscious consumers seeking wholesome and convenient breakfast options.
Cereal Flakes Competitive Landscape
The market report analyses the leading companies in the industry including Belourthe S.A., Cereal Food Manufacturing Company, Cereal Planet, CLEXTRAL, Kellogg Company, and Others.
Cereal Flakes Market Dynamics
Cereal Flakes Market Trend: Shift Towards Healthy Breakfast Options
One of the most prominent market trends for cereal flakes is the ongoing shift towards healthier breakfast options among consumers. As more individuals prioritize health and wellness, they are opting for breakfast choices that offer nutritional benefits, convenience, and satiety. Cereal flakes, known for their whole grain content, fiber, and vitamins, are gaining popularity as a nutritious and convenient breakfast solution, driving the growth of this market segment.
Cereal Flakes Market Driver: Busy Lifestyles and Convenience
A key driver fueling the demand for cereal flakes is the modern consumer's busy lifestyle and the need for convenient meal options. With hectic schedules and limited time for meal preparation, consumers are turning to quick and easy breakfast solutions that still provide essential nutrients and energy. Cereal flakes offer a convenient breakfast choice that can be enjoyed with milk, yogurt, or as part of a smoothie, catering to the on-the-go needs of busy individuals and families.
Cereal Flakes Market Opportunity: Innovation in Flavor Profiles and Packaging
An exciting opportunity in the cereal flakes market lies in innovating flavor profiles and packaging to attract and retain consumers. Manufacturers can explore creating new and unique flavor combinations, such as exotic fruits, spices, or superfood additions, to appeal to diverse taste preferences and attract health-conscious consumers. Additionally, investing in sustainable and eco-friendly packaging solutions, such as recyclable or compostable materials, can further enhance the appeal of cereal flakes to environmentally conscious consumers, tapping into a growing segment of the market and driving long-term growth and sustainability.
Cereal Flakes Market Share Analysis: Ready to Eat segment generated the highest revenue share in the industry
The Ready to Eat segment dominates the Cereal Flakes market by type. This segment's prominence is driven by the growing demand for convenient and quick breakfast options that require minimal preparation. Ready to Eat cereal flakes are processed and packaged to be consumed directly out of the box without the need for additional cooking or preparation, making them highly convenient for busy consumers. They come in a variety of flavors and formulations, catering to diverse taste preferences and nutritional needs. Ready to Eat cereal flakes are popular among households, students, and professionals who prioritize convenience in their daily routines. Further, advancements in food technology and packaging have improved the shelf life and freshness of Ready to Eat cereal flakes, enhancing their appeal to consumers seeking longer-lasting breakfast options. As consumer lifestyles become increasingly fast-paced, the Ready to Eat segment continues to grow, supported by innovation in flavors, health-conscious formulations, and strategic marketing campaigns that highlight convenience and nutritional benefits. Additionally, the segment's accessibility through various retail channels further boosts its market presence, making Ready to Eat cereal flakes the largest segment in the Cereal Flakes market.
Cereal Flakes Market Share Analysis: Organic is the fastest growing segment over the forecast period to 2032
The Organic segment is anticipated to be the fastest growing in the Cereal Flakes market by product through 2032. This growth is driven by increasing consumer preference for organic food products perceived as healthier, safer, and more environmentally sustainable. Organic cereal flakes are produced without synthetic pesticides, fertilizers, or genetically modified organisms (GMOs), adhering to strict organic farming standards. They appeal to consumers who prioritize health and wellness, as organic farming practices are believed to preserve soil fertility, reduce pollution, and promote biodiversity. Further, organic cereal flakes are perceived to have higher nutritional value and superior taste compared to conventional counterparts, further boosting their demand among health-conscious consumers. The organic food market has been experiencing robust growth globally, supported by growing awareness of sustainable agriculture practices and concerns over food safety. As a result, manufacturers and retailers are expanding their organic product offerings, including a variety of organic cereal flakes, to meet increasing consumer demand. Regulatory support and certifications further enhance consumer trust in organic products, driving the segment's rapid growth trajectory in the Cereal Flakes market.
Cereal Flakes Market Share Analysis: Wheat segment generated the highest revenue share in the industry
The Wheat segment dominates the Cereal Flakes market by raw material. Wheat is widely used in the production of cereal flakes due to its nutritional profile, availability, and versatile applications in food processing. Cereal flakes made from wheat are popular among consumers for their mild flavor, crispy texture, and ability to hold various flavors and additives well. Wheat-based cereal flakes are commonly found in a variety of breakfast cereals, including flakes, biscuits, and granolas. The segment's leadership is further reinforced by wheat's status as a staple crop globally, ensuring consistent supply and affordability. Additionally, wheat is rich in carbohydrates, fiber, proteins, vitamins, and minerals, making it a nutritious choice for breakfast or snacks. As consumer demand for convenient and healthy breakfast options grows, wheat-based cereal flakes remain a preferred choice due to their widespread availability, nutritional benefits, and versatility in product formulations. The Wheat segment is expected to maintain its position as the largest segment in the Cereal Flakes market, supported by ongoing innovation in cereal manufacturing and increasing consumer preference for wholesome breakfast alternatives.
Cereal Flakes Market Share Analysis: Online Retail is the fastest growing segment over the forecast period to 2032
The Online Retail segment is anticipated to be the fastest growing in the Cereal Flakes market by distribution channel through 2032. This growth is driven by the increasing trend towards e-commerce and online shopping for groceries and packaged foods. Online retail platforms offer consumers convenience, a wide range of product choices, and the ability to compare prices and read reviews from the comfort of their homes. The Past few yearsaccelerated the shift towards online grocery shopping as consumers sought safer and more convenient shopping options. Cereal flakes are particularly well-suited for online retail due to their non-perishable nature and the ease of shipping and handling compared to fresh produce. Further, digital marketing strategies, promotional offers, and loyalty programs implemented by online retailers contribute to the segment's growth by attracting and retaining customers. As technological advancements improve the efficiency of logistics and delivery services, online retail continues to expand its market share in the food and beverage sector, including cereal flakes. The Online Retail segment's rapid growth trajectory in the Cereal Flakes market underscores its importance as a key distribution channel, poised to capture a growing share of consumer spending on breakfast cereals and convenience foods.
Cereal Flakes Market Segmentation
By Type
Traditional
Ready to eat
By Product
Organic
Conventional
By Raw Material
Wheat
Barley
Rice
Maize
Oats
Popcorn
Rye
By Distribution Channel
Supermarkets/Hypermarkets
Convenience Stores
Online Retail
Others
Countries Analyzed
North America (US, Canada, Mexico)
Europe (Germany, UK, France, Spain, Italy, Russia, Rest of Europe)
Asia Pacific (China, India, Japan, South Korea, Australia, South East Asia, Rest of Asia)
South America (Brazil, Argentina, Rest of South America)
Middle East and Africa (Saudi Arabia, UAE, Rest of Middle East, South Africa, Egypt, Rest of Africa)
Cereal Flakes Companies Profiled in the Study
Belourthe S.A.
Cereal Food Manufacturing Company
Cereal Planet
CLEXTRAL
Kellogg Company
*- List Not Exhaustive
Chapter 1. TABLE OF CONTENTS
Chapter 2. Introduction to Cereal Flakes Market
2.1. Market Overview
2.2. Key Statistics and Report Highlights
2.3. Scope of the Comprehensive Study
2.3.1. Market Definition
2.3.2 Countries and Regions Covered
2.3.3 Research Objective
2.3.4 Units, Currency, and Conversions
2.3.5 Industry Value Chain
2.4. Key Market Segments
2.5. Key Companies
2.6. Study Period
Chapter 3. Strategic Analysis Review
3.1. Cereal Flakes Pricing Analysis and Forecast
3.2. Porter’s Five Forces
3.3. Market Ecosystem
3.4. SWOT Analysis
3.5. Regulatory Scenario
3.3. Effects of Inflation, Russia-Ukraine War, moderating economic growth, and other macroeconomic factors
Chapter 4. Competitive Landscape
4.1. Market Share Analysis
4.1.1. Global Cereal Flakes Market Share by Company, 2023
4.1.2. Product Offerings of Leading Cereal Flakes Companies
4.2. Market Entropy
4.2.1. New Product Launches in the Industry
4.2.2. Mergers, Acquisitions, Joint ventures, and Partnerships
4.3. Key Strategies and Best Practices
Chapter 5. Global Market Projections: Best, Reference, and Low Case Scenarios
5.1. Growth Analysis- Case Scenario Definitions
5.2. Low Growth Case Scenario Forecasts
5.3. Reference Growth Case Scenario Forecasts
5.4. High Growth Case Scenario Forecasts
Chapter 6. Market Dynamics
6.1. Cereal Flakes Market Drivers
6.2. Cereal Flakes Market Challenges
6.6. Cereal Flakes Market Opportunities
6.4. Cereal Flakes Market Trends
Chapter 7. Global Cereal Flakes Market Outlook Trends
7.1. Global Cereal Flakes Revenue (USD Million) and CAGR (%) by Type (2021-2032)
7.2. Global Cereal Flakes Revenue (USD Million) and CAGR (%) by Application (2021-2032)
7.3. Global Cereal Flakes Revenue (USD Million) and CAGR (%) by Product (2021-2032)
By Type
Traditional
Ready to eat
By Product
Organic
Conventional
By Raw Material
Wheat
Barley
Rice
Maize
Oats
Popcorn
Rye
By Distribution Channel
Supermarkets/Hypermarkets
Convenience Stores
Online Retail
Others
Chapter 8. Global Cereal Flakes Regional Analysis and Outlook
8.1. Global Cereal Flakes Revenue (USD Million) By Regions (2021- 2032)
8.2. North America Cereal Flakes Revenue (USD Million) by Country (2021-2032)
8.2.1. United States Cereal Flakes Regional Analysis and Outlook
8.2.2. Canada Cereal Flakes Regional Analysis and Outlook
8.2.3. Mexico Cereal Flakes Regional Analysis and Outlook
8.3. Europe Cereal Flakes Revenue (USD Million), by Country (2021-2032)
8.3.1. Germany Cereal Flakes Regional Analysis and Outlook
8.3.2. France Cereal Flakes Regional Analysis and Outlook
8.3.3. United Kingdom Cereal Flakes Regional Analysis and Outlook
8.3.4. Spain Cereal Flakes Regional Analysis and Outlook
8.3.5. Italy Cereal Flakes Regional Analysis and Outlook
8.3.6. Russia Cereal Flakes Regional Analysis and Outlook
8.3.7. Rest of Europe Cereal Flakes Regional Analysis and Outlook
8.4. Asia Pacific Cereal Flakes Revenue (USD Million) by Country (2021-2032)
8.4.1. China Cereal Flakes Regional Analysis and Outlook
8.4.2. Japan Cereal Flakes Regional Analysis and Outlook
8.4.3. India Cereal Flakes Regional Analysis and Outlook
8.4.4. South Korea Cereal Flakes Regional Analysis and Outlook
8.4.5. Australia Cereal Flakes Regional Analysis and Outlook
8.4.6. South East Asia Cereal Flakes Regional Analysis and Outlook
8.4.7. Rest of Asia Pacific Cereal Flakes Regional Analysis and Outlook
8.5. South America Cereal Flakes Revenue (USD Million), by Country (2021-2032)
8.5.1. Brazil Cereal Flakes Regional Analysis and Outlook
8.5.2. Argentina Cereal Flakes Regional Analysis and Outlook
8.5.3. Rest of South America Cereal Flakes Regional Analysis and Outlook
8.6. Middle East and Africa Cereal Flakes Revenue (USD Million) by Country (2021-2032)
8.6.1. Middle East Cereal Flakes Regional Analysis and Outlook
8.6.2. Africa Cereal Flakes Regional Analysis and Outlook
Chapter 9. North America Cereal Flakes Analysis and Outlook
9.1. North America Cereal Flakes Revenue (USD Million) by Segments (2021-2032)
9.1.1. North America Cereal Flakes Revenue (USD Million) by Type (2021-2032)
9.1.2. North America Cereal Flakes Revenue (USD Million) by Application (2021-2032)
9.1.3. North America Cereal Flakes Revenue (USD Million) by Product (2021-2032)
By Type
Traditional
Ready to eat
By Product
Organic
Conventional
By Raw Material
Wheat
Barley
Rice
Maize
Oats
Popcorn
Rye
By Distribution Channel
Supermarkets/Hypermarkets
Convenience Stores
Online Retail
Others
Chapter 10. Europe Cereal Flakes Analysis and Outlook
10.1. Europe Cereal Flakes Revenue (USD Million), by Segments (USD Million) (2021-2032)
10.1.1. Europe Cereal Flakes Revenue (USD Million) by Type (2021-2032)
10.1.2. Europe Cereal Flakes Revenue (USD Million) by Application (2021-2032)
10.1.3. Europe Cereal Flakes Revenue (USD Million) by Product (2021-2032)
By Type
Traditional
Ready to eat
By Product
Organic
Conventional
By Raw Material
Wheat
Barley
Rice
Maize
Oats
Popcorn
Rye
By Distribution Channel
Supermarkets/Hypermarkets
Convenience Stores
Online Retail
Others
Chapter 11. Asia Pacific Cereal Flakes Analysis and Outlook
11.1. Asia Pacific Cereal Flakes Revenue (USD Million), and Revenue (USD Million) by Segments (2021-2032)
11.1.1. Asia Pacific Cereal Flakes Revenue (USD Million) by Type (2021-2032)
11.1.2. Asia Pacific Cereal Flakes Revenue (USD Million) by Application (2021-2032)
11.1.3. Asia Pacific Cereal Flakes Revenue (USD Million) by Product (2021-2032)
By Type
Traditional
Ready to eat
By Product
Organic
Conventional
By Raw Material
Wheat
Barley
Rice
Maize
Oats
Popcorn
Rye
By Distribution Channel
Supermarkets/Hypermarkets
Convenience Stores
Online Retail
Others
Chapter 12. South America Cereal Flakes Analysis and Outlook
12.1. South America Cereal Flakes Revenue (USD Million), by Segments (2021-2032)
12.1.1. South America Cereal Flakes Revenue (USD Million) by Type (2021-2032)
12.1.2. South America Cereal Flakes Revenue (USD Million) by Application (2021-2032)
12.1.3. South America Cereal Flakes Revenue (USD Million) by Product (2021-2032)
By Type
Traditional
Ready to eat
By Product
Organic
Conventional
By Raw Material
Wheat
Barley
Rice
Maize
Oats
Popcorn
Rye
By Distribution Channel
Supermarkets/Hypermarkets
Convenience Stores
Online Retail
Others
Chapter 13. Middle East and Africa Cereal Flakes Analysis and Outlook
13.1. Middle East and Africa Cereal Flakes Revenue (USD Million), by Segments (2021-2032)
13.1.1. Middle East and Africa Cereal Flakes Revenue (USD Million) by Type (2021-2032)
13.1.2. Middle East and Africa Cereal Flakes Revenue (USD Million) by Application (2021-2032)
13.1.3. Middle East and Africa Cereal Flakes Revenue (USD Million) by Product (2021-2032)
By Type
Traditional
Ready to eat
By Product
Organic
Conventional
By Raw Material
Wheat
Barley
Rice
Maize
Oats
Popcorn
Rye
By Distribution Channel
Supermarkets/Hypermarkets
Convenience Stores
Online Retail
Others
Chapter 14. Cereal Flakes Company Profiles
14.1 Business Overview
14.2 Product Profiles
14.3 SWOT Profiles
14.5 Recent Developments
14.6 Financial Profile
List of Companies
Belourthe S.A.
Cereal Food Manufacturing Company
Cereal Planet
CLEXTRAL
Kellogg Company
15. Methodology and Data Sources
15.1 Customization Offerings
15.2 Subscription Services
15.3 Related Reports
15.4 Publisher Expertise
LIST OF TABLES
Table 1 Market Segmentation Analysis
Table 2 Global Cereal Flakes Market Share of Leading Companies, 2023
Table 3 Product Offerings of Leading Companies
Table 4 Low Growth Scenario Forecasts
Table 5 Reference Case Growth Scenario
Table 6 High Growth Case Scenario
Table 7 Global Cereal Flakes Revenue (USD Million) And CAGR (%) By Type (2021-2032)
Table 8 Global Cereal Flakes Revenue (USD Million) And CAGR (%) By Application (2021-2032)
Table 9 Global Cereal Flakes Revenue (USD Million) And CAGR (%) By Product (2021-2032)
Table 10 Global Cereal Flakes Market Revenue (USD Million) By Regions (2021-2032)
Table 11 Global Cereal Flakes Market Share (%) By Regions (2021-2032)
Table 12 North America Cereal Flakes Revenue (USD Million) By Country (2021-2032)
Table 13 Europe Cereal Flakes Revenue (USD Million) By Country (2021-2032)
Table 14 Asia Pacific Cereal Flakes Revenue (USD Million) By Country (2021-2032)
Table 15 South America Cereal Flakes Revenue (USD Million) By Country (2021-2032)
Table 16 Middle East and Africa Cereal Flakes Revenue (USD Million) By Region (2021-2032)
Table 17 North America Cereal Flakes Revenue (USD Million) By Type (2021-2032)
Table 18 North America Cereal Flakes Revenue (USD Million) By Application (2021-2032)
Table 19 North America Cereal Flakes Revenue (USD Million) By Product (2021-2032)
Table 20 Europe Cereal Flakes Revenue (USD Million) By Type (2021-2032)
Table 21 Europe Cereal Flakes Revenue (USD Million) By Application (2021-2032)
Table 22 Europe Cereal Flakes Revenue (USD Million) By Product (2021-2032)
Table 23 Asia Pacific Cereal Flakes Revenue (USD Million) By Type (2021-2032)
Table 24 Asia Pacific Cereal Flakes Revenue (USD Million) By Application (2021-2032)
Table 25 Asia Pacific Cereal Flakes Revenue (USD Million) By Product (2021-2032)
Table 26 South America Cereal Flakes Revenue (USD Million) By Type (2021-2032)
Table 27 South America Cereal Flakes Revenue (USD Million) By Application (2021-2032)
Table 28 South America Cereal Flakes Revenue (USD Million) By Product (2021-2032)
Table 29 Middle East and Africa Cereal Flakes Revenue (USD Million) By Type (2021-2032)
Table 30 Middle East and Africa Cereal Flakes Revenue (USD Million) By Application (2021-2032)
Table 31 Middle East and Africa Cereal Flakes Revenue (USD Million) By Product (2021-2032)
LIST OF FIGURES
Figure 1. Market Scope
Figure 2. Pricing Forecasts Per Unit, 2023- 2032
Figure 3. Porter’s Five Forces
Figure 4. Global Cereal Flakes Market Revenue (USD Million) By Regions (2021-2032)
Figure 5. Global Cereal Flakes Market Share (%) By Regions (2023)
Figure 6. North America Cereal Flakes Revenue (USD Million) By Country (2021-2032)
Figure 7. United States Cereal Flakes Revenue (USD Million) By Country (2021-2032)
Figure 8. Canada Cereal Flakes Revenue (USD Million) By Country (2021-2032)
Figure 9. Mexico Cereal Flakes Revenue (USD Million) By Country (2021-2032)
Figure 10. Europe Cereal Flakes Revenue (USD Million) By Country (2021-2032)
Figure 11. Germany Cereal Flakes Revenue (USD Million) By Country (2021-2032)
Figure 12. France Cereal Flakes Revenue (USD Million) By Country (2021-2032)
Figure 13. United Kingdom Cereal Flakes Revenue (USD Million) By Country (2021-2032)
Figure 14. Spain Cereal Flakes Revenue (USD Million) By Country (2021-2032)
Figure 15. Italy Cereal Flakes Revenue (USD Million) By Country (2021-2032)
Figure 16. Russia Cereal Flakes Revenue (USD Million) By Country (2021-2032)
Figure 17. Rest of Europe Cereal Flakes Revenue (USD Million) By Country (2021-2032)
Figure 11. Asia Pacific Cereal Flakes Revenue (USD Million) By Country (2021-2032)
Figure 12. China Cereal Flakes Revenue (USD Million) By Country (2021-2032)
Figure 13. Japan Cereal Flakes Revenue (USD Million) By Country (2021-2032)
Figure 14. India Cereal Flakes Revenue (USD Million) By Country (2021-2032)
Figure 15. South Korea Cereal Flakes Revenue (USD Million) By Country (2021-2032)
Figure 16. Australia Cereal Flakes Revenue (USD Million) By Country (2021-2032)
Figure 17. South East Asia Cereal Flakes Revenue (USD Million) By Country (2021-2032)
Figure 18. South America Cereal Flakes Revenue (USD Million) By Country (2021-2032)
Figure 19. Brazil Cereal Flakes Revenue (USD Million) By Country (2021-2032)
Figure 20. Argentina Cereal Flakes Revenue (USD Million) By Country (2021-2032)
Figure 21. Rest of Asia Pacific Cereal Flakes Revenue (USD Million) By Country (2021-2032)
Figure 22. Middle East and Africa Cereal Flakes Revenue (USD Million) By Region (2021-2032)
Figure 23. Saudi Arabia Cereal Flakes Revenue (USD Million) By Region (2021-2032)
Figure 24. The UAE Cereal Flakes Revenue (USD Million) By Region (2021-2032)
Figure 25. Rest of Middle East Cereal Flakes Revenue (USD Million) By Region (2021-2032)
Figure 26. South Africa Cereal Flakes Revenue (USD Million) By Region (2021-2032)
Figure 27. Africa Cereal Flakes Revenue (USD Million) By Region (2021-2032)
Figure 28. North America Cereal Flakes Revenue (USD Million) By Type (2021-2032)
Figure 29. North America Cereal Flakes Revenue (USD Million) By Application (2021-2032)
Figure 30. North America Cereal Flakes Revenue (USD Million) By Product (2021-2032)
Figure 31. Europe Cereal Flakes Revenue (USD Million) By Type (2021-2032)
Figure 32. Europe Cereal Flakes Revenue (USD Million) By Application (2021-2032)
Figure 33. Europe Cereal Flakes Revenue (USD Million) By Product (2021-2032)
Figure 34. Asia Pacific Cereal Flakes Revenue (USD Million) By Type (2021-2032)
Figure 35. Asia Pacific Cereal Flakes Revenue (USD Million) By Application (2021-2032)
Figure 36. Asia Pacific Cereal Flakes Revenue (USD Million) By Product (2021-2032)
Figure 37. South America Cereal Flakes Revenue (USD Million) By Type (2021-2032)
Figure 38. South America Cereal Flakes Revenue (USD Million) By Application (2021-2032)
Figure 39. South America Cereal Flakes Revenue (USD Million) By Product (2021-2032)
Figure 40. Middle East and Africa Cereal Flakes Revenue (USD Million) By Type (2021-2032)
Figure 41. Middle East and Africa Cereal Flakes Revenue (USD Million) By Application (2021-2032)
Figure 42. Middle East and Africa Cereal Flakes Revenue (USD Million) By Product (2021-2032)
By Type
Traditional
Ready to eat
By Product
Organic
Conventional
By Raw Material
Wheat
Barley
Rice
Maize
Oats
Popcorn
Rye
By Distribution Channel
Supermarkets/Hypermarkets
Convenience Stores
Online Retail
Others
Countries Analyzed
North America (US, Canada, Mexico)
Europe (Germany, UK, France, Spain, Italy, Russia, Rest of Europe)
Asia Pacific (China, India, Japan, South Korea, Australia, South East Asia, Rest of Asia)
South America (Brazil, Argentina, Rest of South America)
Middle East and Africa (Saudi Arabia, UAE, Rest of Middle East, South Africa, Egypt, Rest of Africa)
