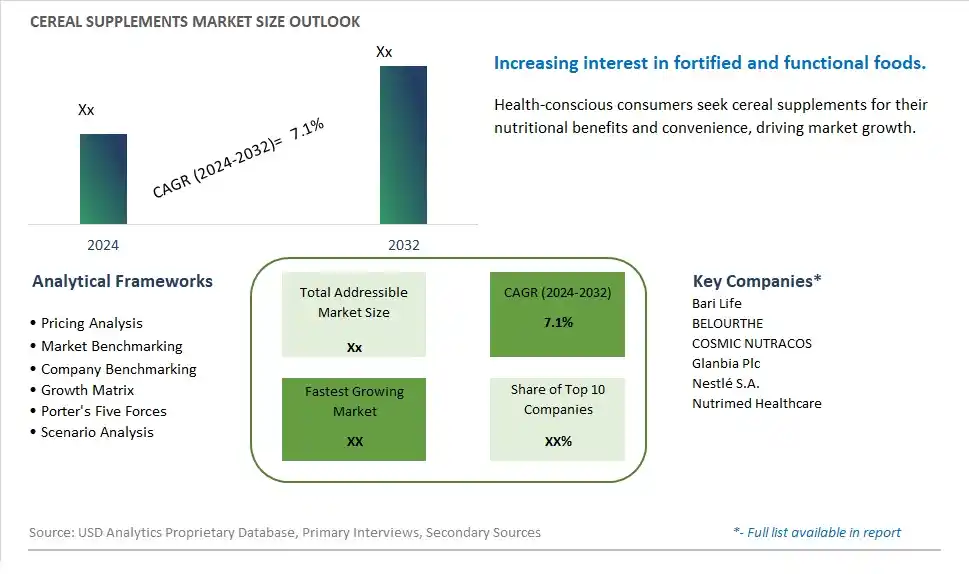
Global Cereal Supplements Market Size is valued at $XX Million in 2024 and is forecast to register a growth rate (CAGR) of 7.1% to reach $XX Million by 2032.
The global Cereal Supplements Market Comprehensive Study analyzes and forecasts the market size across 6 regions and 24 countries for diverse segments -By Type (Organic, Conventional), By Application (Supermarkets/Hypermarkets, Convenience Stores, Online Retail, Others)
An Introduction to Cereal Supplements Market
In 2024, the Cereal Supplements market is witnessing significant growth, driven by the increasing demand for functional foods that provide additional health benefits. Cereal supplements, which include fortified cereals and grain-based dietary supplements, are valued for their ability to deliver essential vitamins, minerals, and other nutrients. The market is supported by the growing trend towards health and wellness and the demand for convenient, nutrient-dense food options. Advances in fortification and formulation technologies are enhancing the nutritional profile and efficacy of cereal supplements. The market is also benefiting from the trend towards clean-label and natural ingredients, appealing to health-conscious consumers seeking effective and convenient dietary supplements.
Cereal Supplements Competitive Landscape
The market report analyses the leading companies in the industry including Bari Life, BELOURTHE, COSMIC NUTRACOS, Glanbia Plc, Nestlé S.A., Nutrimed Healthcare, and Others.
Cereal Supplements Market Dynamics
Cereal Supplements Market Trend: Focus on Nutritional Supplements for Health and Wellness
The most prominent market trend for cereal supplements is the increasing focus on nutritional supplements for overall health and wellness. Consumers are becoming more proactive about their well-being, seeking products that provide essential nutrients, vitamins, and minerals to complement their diets and support their health goals. Cereal supplements, enriched with nutrients from grains like wheat, oats, or rice, are gaining traction as convenient and effective ways to bridge nutritional gaps and enhance daily wellness routines.
Cereal Supplements Market Driver: Rising Awareness of Dietary Deficiencies and Functional Benefits
A key driver propelling the market for cereal supplements is the rising awareness of dietary deficiencies and the functional benefits of specific nutrients. As people become more educated about nutrition and its impact on health, they are looking for targeted solutions to address deficiencies or optimize their nutritional intake. Cereal supplements offer a concentrated source of nutrients like fiber, B vitamins, antioxidants, and minerals, catering to the demand for functional products that support digestion, immunity, energy levels, and overall well-being.
Cereal Supplements Market Opportunity: Customized Formulations and Targeted Marketing
An exciting opportunity in the cereal supplements market lies in developing customized formulations and implementing targeted marketing strategies. Manufacturers can create specialized cereal supplement blends tailored to different consumer needs, such as formulations for energy and vitality, digestive health, immune support, or weight management. By leveraging scientific research and data, companies can also communicate the specific benefits of their cereal supplements effectively, targeting key consumer demographics and addressing specific health concerns. Additionally, partnerships with healthcare professionals, nutritionists, and wellness influencers can help amplify the visibility and credibility of cereal supplements, driving adoption and market growth.
Cereal Supplements Market Share Analysis: Conventional segment generated the highest revenue share in the industry
The Conventional segment holds the largest share in the Cereal Supplements market by type. This dominance is primarily due to the broader availability and lower cost of conventional cereal supplements compared to organic alternatives. Conventional cereal supplements are produced using conventional farming methods that may involve the use of synthetic pesticides, fertilizers, and genetically modified organisms (GMOs). These methods help to maintain higher yields and lower production costs, making conventional cereal supplements more accessible to a wider consumer base. They are often priced competitively, appealing to cost-conscious consumers who may prioritize affordability over organic certification. Despite the growing interest in organic products, conventional cereal supplements continue to lead the market due to their established supply chains, extensive distribution networks, and consistent product availability. Additionally, the nutritional benefits and functional properties offered by conventional cereal supplements, such as vitamins, minerals, and dietary fiber, contribute to their popularity among health-conscious consumers seeking convenient and effective dietary supplements. As consumer awareness of health and wellness increases, the Conventional segment is expected to maintain its dominance in the Cereal Supplements market, supported by its affordability and nutritional value.
Cereal Supplements Market Share Analysis: Online Retail is the fastest growing segment over the forecast period to 2032
The Online Retail segment is poised to be the fastest growing in the Cereal Supplements market by application through 2032. This growth is driven by the increasing consumer preference for convenient shopping options, especially in the health and wellness sector. Online retail platforms offer a wide selection of cereal supplements, catering to consumers seeking specific nutritional benefits and dietary requirements. The convenience of browsing and purchasing supplements online, coupled with doorstep delivery options, appeals to busy individuals and health-conscious shoppers alike. The Past few yearsfurther accelerated the shift towards online shopping as consumers sought safer and contactless shopping experiences. Further, digital marketing strategies, personalized recommendations, and subscription models implemented by online retailers enhance customer engagement and retention in the cereal supplements market. As technological advancements in e-commerce continue to improve logistics and fulfillment capabilities, the Online Retail segment is expected to experience robust growth, capturing a larger share of the market compared to traditional brick-and-mortar retailers. This trend underscores the importance of digital channels in shaping the future landscape of the Cereal Supplements market, driving innovation and accessibility for consumers seeking dietary and nutritional solutions online.
Cereal Supplements Market Segmentation
By Type
Organic
Conventional
By Application
Supermarkets/Hypermarkets
Convenience Stores
Online Retail
Others
Countries Analyzed
North America (US, Canada, Mexico)
Europe (Germany, UK, France, Spain, Italy, Russia, Rest of Europe)
Asia Pacific (China, India, Japan, South Korea, Australia, South East Asia, Rest of Asia)
South America (Brazil, Argentina, Rest of South America)
Middle East and Africa (Saudi Arabia, UAE, Rest of Middle East, South Africa, Egypt, Rest of Africa)
Cereal Supplements Companies Profiled in the Study
Bari Life
BELOURTHE
COSMIC NUTRACOS
Glanbia Plc
Nestlé S.A.
Nutrimed Healthcare
*- List Not Exhaustive
Chapter 1. TABLE OF CONTENTS
Chapter 2. Introduction to Cereal Supplements Market
2.1. Market Overview
2.2. Key Statistics and Report Highlights
2.3. Scope of the Comprehensive Study
2.3.1. Market Definition
2.3.2 Countries and Regions Covered
2.3.3 Research Objective
2.3.4 Units, Currency, and Conversions
2.3.5 Industry Value Chain
2.4. Key Market Segments
2.5. Key Companies
2.6. Study Period
Chapter 3. Strategic Analysis Review
3.1. Cereal Supplements Pricing Analysis and Forecast
3.2. Porter’s Five Forces
3.3. Market Ecosystem
3.4. SWOT Analysis
3.5. Regulatory Scenario
3.3. Effects of Inflation, Russia-Ukraine War, moderating economic growth, and other macroeconomic factors
Chapter 4. Competitive Landscape
4.1. Market Share Analysis
4.1.1. Global Cereal Supplements Market Share by Company, 2023
4.1.2. Product Offerings of Leading Cereal Supplements Companies
4.2. Market Entropy
4.2.1. New Product Launches in the Industry
4.2.2. Mergers, Acquisitions, Joint ventures, and Partnerships
4.3. Key Strategies and Best Practices
Chapter 5. Global Market Projections: Best, Reference, and Low Case Scenarios
5.1. Growth Analysis- Case Scenario Definitions
5.2. Low Growth Case Scenario Forecasts
5.3. Reference Growth Case Scenario Forecasts
5.4. High Growth Case Scenario Forecasts
Chapter 6. Market Dynamics
6.1. Cereal Supplements Market Drivers
6.2. Cereal Supplements Market Challenges
6.6. Cereal Supplements Market Opportunities
6.4. Cereal Supplements Market Trends
Chapter 7. Global Cereal Supplements Market Outlook Trends
7.1. Global Cereal Supplements Revenue (USD Million) and CAGR (%) by Type (2021-2032)
7.2. Global Cereal Supplements Revenue (USD Million) and CAGR (%) by Application (2021-2032)
7.3. Global Cereal Supplements Revenue (USD Million) and CAGR (%) by Product (2021-2032)
By Type
Organic
Conventional
By Application
Supermarkets/Hypermarkets
Convenience Stores
Online Retail
Others
Chapter 8. Global Cereal Supplements Regional Analysis and Outlook
8.1. Global Cereal Supplements Revenue (USD Million) By Regions (2021- 2032)
8.2. North America Cereal Supplements Revenue (USD Million) by Country (2021-2032)
8.2.1. United States Cereal Supplements Regional Analysis and Outlook
8.2.2. Canada Cereal Supplements Regional Analysis and Outlook
8.2.3. Mexico Cereal Supplements Regional Analysis and Outlook
8.3. Europe Cereal Supplements Revenue (USD Million), by Country (2021-2032)
8.3.1. Germany Cereal Supplements Regional Analysis and Outlook
8.3.2. France Cereal Supplements Regional Analysis and Outlook
8.3.3. United Kingdom Cereal Supplements Regional Analysis and Outlook
8.3.4. Spain Cereal Supplements Regional Analysis and Outlook
8.3.5. Italy Cereal Supplements Regional Analysis and Outlook
8.3.6. Russia Cereal Supplements Regional Analysis and Outlook
8.3.7. Rest of Europe Cereal Supplements Regional Analysis and Outlook
8.4. Asia Pacific Cereal Supplements Revenue (USD Million) by Country (2021-2032)
8.4.1. China Cereal Supplements Regional Analysis and Outlook
8.4.2. Japan Cereal Supplements Regional Analysis and Outlook
8.4.3. India Cereal Supplements Regional Analysis and Outlook
8.4.4. South Korea Cereal Supplements Regional Analysis and Outlook
8.4.5. Australia Cereal Supplements Regional Analysis and Outlook
8.4.6. South East Asia Cereal Supplements Regional Analysis and Outlook
8.4.7. Rest of Asia Pacific Cereal Supplements Regional Analysis and Outlook
8.5. South America Cereal Supplements Revenue (USD Million), by Country (2021-2032)
8.5.1. Brazil Cereal Supplements Regional Analysis and Outlook
8.5.2. Argentina Cereal Supplements Regional Analysis and Outlook
8.5.3. Rest of South America Cereal Supplements Regional Analysis and Outlook
8.6. Middle East and Africa Cereal Supplements Revenue (USD Million) by Country (2021-2032)
8.6.1. Middle East Cereal Supplements Regional Analysis and Outlook
8.6.2. Africa Cereal Supplements Regional Analysis and Outlook
Chapter 9. North America Cereal Supplements Analysis and Outlook
9.1. North America Cereal Supplements Revenue (USD Million) by Segments (2021-2032)
9.1.1. North America Cereal Supplements Revenue (USD Million) by Type (2021-2032)
9.1.2. North America Cereal Supplements Revenue (USD Million) by Application (2021-2032)
9.1.3. North America Cereal Supplements Revenue (USD Million) by Product (2021-2032)
By Type
Organic
Conventional
By Application
Supermarkets/Hypermarkets
Convenience Stores
Online Retail
Others
Chapter 10. Europe Cereal Supplements Analysis and Outlook
10.1. Europe Cereal Supplements Revenue (USD Million), by Segments (USD Million) (2021-2032)
10.1.1. Europe Cereal Supplements Revenue (USD Million) by Type (2021-2032)
10.1.2. Europe Cereal Supplements Revenue (USD Million) by Application (2021-2032)
10.1.3. Europe Cereal Supplements Revenue (USD Million) by Product (2021-2032)
By Type
Organic
Conventional
By Application
Supermarkets/Hypermarkets
Convenience Stores
Online Retail
Others
Chapter 11. Asia Pacific Cereal Supplements Analysis and Outlook
11.1. Asia Pacific Cereal Supplements Revenue (USD Million), and Revenue (USD Million) by Segments (2021-2032)
11.1.1. Asia Pacific Cereal Supplements Revenue (USD Million) by Type (2021-2032)
11.1.2. Asia Pacific Cereal Supplements Revenue (USD Million) by Application (2021-2032)
11.1.3. Asia Pacific Cereal Supplements Revenue (USD Million) by Product (2021-2032)
By Type
Organic
Conventional
By Application
Supermarkets/Hypermarkets
Convenience Stores
Online Retail
Others
Chapter 12. South America Cereal Supplements Analysis and Outlook
12.1. South America Cereal Supplements Revenue (USD Million), by Segments (2021-2032)
12.1.1. South America Cereal Supplements Revenue (USD Million) by Type (2021-2032)
12.1.2. South America Cereal Supplements Revenue (USD Million) by Application (2021-2032)
12.1.3. South America Cereal Supplements Revenue (USD Million) by Product (2021-2032)
By Type
Organic
Conventional
By Application
Supermarkets/Hypermarkets
Convenience Stores
Online Retail
Others
Chapter 13. Middle East and Africa Cereal Supplements Analysis and Outlook
13.1. Middle East and Africa Cereal Supplements Revenue (USD Million), by Segments (2021-2032)
13.1.1. Middle East and Africa Cereal Supplements Revenue (USD Million) by Type (2021-2032)
13.1.2. Middle East and Africa Cereal Supplements Revenue (USD Million) by Application (2021-2032)
13.1.3. Middle East and Africa Cereal Supplements Revenue (USD Million) by Product (2021-2032)
By Type
Organic
Conventional
By Application
Supermarkets/Hypermarkets
Convenience Stores
Online Retail
Others
Chapter 14. Cereal Supplements Company Profiles
14.1 Business Overview
14.2 Product Profiles
14.3 SWOT Profiles
14.5 Recent Developments
14.6 Financial Profile
List of Companies
Bari Life
BELOURTHE
COSMIC NUTRACOS
Glanbia Plc
Nestlé S.A.
Nutrimed Healthcare
15. Methodology and Data Sources
15.1 Customization Offerings
15.2 Subscription Services
15.3 Related Reports
15.4 Publisher Expertise
LIST OF TABLES
Table 1 Market Segmentation Analysis
Table 2 Global Cereal Supplements Market Share of Leading Companies, 2023
Table 3 Product Offerings of Leading Companies
Table 4 Low Growth Scenario Forecasts
Table 5 Reference Case Growth Scenario
Table 6 High Growth Case Scenario
Table 7 Global Cereal Supplements Revenue (USD Million) And CAGR (%) By Type (2021-2032)
Table 8 Global Cereal Supplements Revenue (USD Million) And CAGR (%) By Application (2021-2032)
Table 9 Global Cereal Supplements Revenue (USD Million) And CAGR (%) By Product (2021-2032)
Table 10 Global Cereal Supplements Market Revenue (USD Million) By Regions (2021-2032)
Table 11 Global Cereal Supplements Market Share (%) By Regions (2021-2032)
Table 12 North America Cereal Supplements Revenue (USD Million) By Country (2021-2032)
Table 13 Europe Cereal Supplements Revenue (USD Million) By Country (2021-2032)
Table 14 Asia Pacific Cereal Supplements Revenue (USD Million) By Country (2021-2032)
Table 15 South America Cereal Supplements Revenue (USD Million) By Country (2021-2032)
Table 16 Middle East and Africa Cereal Supplements Revenue (USD Million) By Region (2021-2032)
Table 17 North America Cereal Supplements Revenue (USD Million) By Type (2021-2032)
Table 18 North America Cereal Supplements Revenue (USD Million) By Application (2021-2032)
Table 19 North America Cereal Supplements Revenue (USD Million) By Product (2021-2032)
Table 20 Europe Cereal Supplements Revenue (USD Million) By Type (2021-2032)
Table 21 Europe Cereal Supplements Revenue (USD Million) By Application (2021-2032)
Table 22 Europe Cereal Supplements Revenue (USD Million) By Product (2021-2032)
Table 23 Asia Pacific Cereal Supplements Revenue (USD Million) By Type (2021-2032)
Table 24 Asia Pacific Cereal Supplements Revenue (USD Million) By Application (2021-2032)
Table 25 Asia Pacific Cereal Supplements Revenue (USD Million) By Product (2021-2032)
Table 26 South America Cereal Supplements Revenue (USD Million) By Type (2021-2032)
Table 27 South America Cereal Supplements Revenue (USD Million) By Application (2021-2032)
Table 28 South America Cereal Supplements Revenue (USD Million) By Product (2021-2032)
Table 29 Middle East and Africa Cereal Supplements Revenue (USD Million) By Type (2021-2032)
Table 30 Middle East and Africa Cereal Supplements Revenue (USD Million) By Application (2021-2032)
Table 31 Middle East and Africa Cereal Supplements Revenue (USD Million) By Product (2021-2032)
LIST OF FIGURES
Figure 1. Market Scope
Figure 2. Pricing Forecasts Per Unit, 2023- 2032
Figure 3. Porter’s Five Forces
Figure 4. Global Cereal Supplements Market Revenue (USD Million) By Regions (2021-2032)
Figure 5. Global Cereal Supplements Market Share (%) By Regions (2023)
Figure 6. North America Cereal Supplements Revenue (USD Million) By Country (2021-2032)
Figure 7. United States Cereal Supplements Revenue (USD Million) By Country (2021-2032)
Figure 8. Canada Cereal Supplements Revenue (USD Million) By Country (2021-2032)
Figure 9. Mexico Cereal Supplements Revenue (USD Million) By Country (2021-2032)
Figure 10. Europe Cereal Supplements Revenue (USD Million) By Country (2021-2032)
Figure 11. Germany Cereal Supplements Revenue (USD Million) By Country (2021-2032)
Figure 12. France Cereal Supplements Revenue (USD Million) By Country (2021-2032)
Figure 13. United Kingdom Cereal Supplements Revenue (USD Million) By Country (2021-2032)
Figure 14. Spain Cereal Supplements Revenue (USD Million) By Country (2021-2032)
Figure 15. Italy Cereal Supplements Revenue (USD Million) By Country (2021-2032)
Figure 16. Russia Cereal Supplements Revenue (USD Million) By Country (2021-2032)
Figure 17. Rest of Europe Cereal Supplements Revenue (USD Million) By Country (2021-2032)
Figure 11. Asia Pacific Cereal Supplements Revenue (USD Million) By Country (2021-2032)
Figure 12. China Cereal Supplements Revenue (USD Million) By Country (2021-2032)
Figure 13. Japan Cereal Supplements Revenue (USD Million) By Country (2021-2032)
Figure 14. India Cereal Supplements Revenue (USD Million) By Country (2021-2032)
Figure 15. South Korea Cereal Supplements Revenue (USD Million) By Country (2021-2032)
Figure 16. Australia Cereal Supplements Revenue (USD Million) By Country (2021-2032)
Figure 17. South East Asia Cereal Supplements Revenue (USD Million) By Country (2021-2032)
Figure 18. South America Cereal Supplements Revenue (USD Million) By Country (2021-2032)
Figure 19. Brazil Cereal Supplements Revenue (USD Million) By Country (2021-2032)
Figure 20. Argentina Cereal Supplements Revenue (USD Million) By Country (2021-2032)
Figure 21. Rest of Asia Pacific Cereal Supplements Revenue (USD Million) By Country (2021-2032)
Figure 22. Middle East and Africa Cereal Supplements Revenue (USD Million) By Region (2021-2032)
Figure 23. Saudi Arabia Cereal Supplements Revenue (USD Million) By Region (2021-2032)
Figure 24. The UAE Cereal Supplements Revenue (USD Million) By Region (2021-2032)
Figure 25. Rest of Middle East Cereal Supplements Revenue (USD Million) By Region (2021-2032)
Figure 26. South Africa Cereal Supplements Revenue (USD Million) By Region (2021-2032)
Figure 27. Africa Cereal Supplements Revenue (USD Million) By Region (2021-2032)
Figure 28. North America Cereal Supplements Revenue (USD Million) By Type (2021-2032)
Figure 29. North America Cereal Supplements Revenue (USD Million) By Application (2021-2032)
Figure 30. North America Cereal Supplements Revenue (USD Million) By Product (2021-2032)
Figure 31. Europe Cereal Supplements Revenue (USD Million) By Type (2021-2032)
Figure 32. Europe Cereal Supplements Revenue (USD Million) By Application (2021-2032)
Figure 33. Europe Cereal Supplements Revenue (USD Million) By Product (2021-2032)
Figure 34. Asia Pacific Cereal Supplements Revenue (USD Million) By Type (2021-2032)
Figure 35. Asia Pacific Cereal Supplements Revenue (USD Million) By Application (2021-2032)
Figure 36. Asia Pacific Cereal Supplements Revenue (USD Million) By Product (2021-2032)
Figure 37. South America Cereal Supplements Revenue (USD Million) By Type (2021-2032)
Figure 38. South America Cereal Supplements Revenue (USD Million) By Application (2021-2032)
Figure 39. South America Cereal Supplements Revenue (USD Million) By Product (2021-2032)
Figure 40. Middle East and Africa Cereal Supplements Revenue (USD Million) By Type (2021-2032)
Figure 41. Middle East and Africa Cereal Supplements Revenue (USD Million) By Application (2021-2032)
Figure 42. Middle East and Africa Cereal Supplements Revenue (USD Million) By Product (2021-2032)
By Type
Organic
Conventional
By Application
Supermarkets/Hypermarkets
Convenience Stores
Online Retail
Others
Countries Analyzed
North America (US, Canada, Mexico)
Europe (Germany, UK, France, Spain, Italy, Russia, Rest of Europe)
Asia Pacific (China, India, Japan, South Korea, Australia, South East Asia, Rest of Asia)
South America (Brazil, Argentina, Rest of South America)
Middle East and Africa (Saudi Arabia, UAE, Rest of Middle East, South Africa, Egypt, Rest of Africa)
