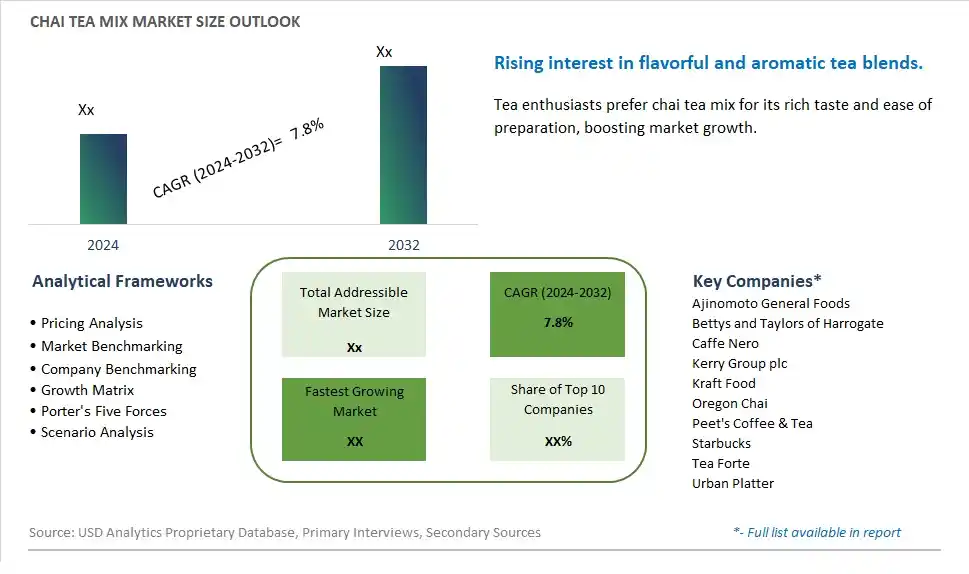
Global Chai Tea Mix Market Size is valued at $XX Million in 2024 and is forecast to register a growth rate (CAGR) of 7.8% to reach $XX Million by 2032.
The global Chai Tea Mix Market Comprehensive Study analyzes and forecasts the market size across 6 regions and 24 countries for diverse segments -By Type (Bottles, Boxes, Bags), By Application (Household, Industrial Food & Beverage, Restaurants & Hotels, Café Restaurants)
An Introduction to Chai Tea Mix Market
In 2024, the Chai Tea Mix market is witnessing significant growth, driven by the increasing popularity of chai tea as a flavorful and comforting beverage. Chai tea mixes, which combine black tea with a blend of spices such as cinnamon, cardamom, ginger, and cloves, are valued for their rich taste and potential health benefits. The market is supported by the growing trend towards specialty and gourmet teas. Advances in mix formulation and packaging are enhancing the flavor, convenience, and shelf life of chai tea mixes. The market is also benefiting from the trend towards clean-label and natural ingredients, appealing to tea enthusiasts and health-conscious consumers seeking authentic and high-quality chai tea experiences.
Chai Tea Mix Competitive Landscape
The market report analyses the leading companies in the industry including Ajinomoto General Foods, Bettys and Taylors of Harrogate, Caffe Nero, Kerry Group plc, Kraft Food, Oregon Chai, Peet's Coffee & Tea, Starbucks, Tea Forte, Urban Platter, and Others.
Chai Tea Mix Market Dynamics
Chai Tea Mix Market Trend: Growing Popularity of Specialty Tea Beverages
A prominent market trend for chai tea mix is the increasing popularity of specialty tea beverages among consumers. Chai tea, with its aromatic blend of spices like cinnamon, cardamom, cloves, and ginger, has captured the attention of tea enthusiasts and those seeking unique flavor experiences. The market trend reflects a broader shift towards premium and artisanal beverages, where consumers value authenticity, exotic flavors, and the ritualistic enjoyment of tea culture.
Chai Tea Mix Market Driver: Demand for Authentic and Flavorful Tea Experiences
A key driver fueling the market for chai tea mix is the demand for authentic and flavorful tea experiences. Consumers are seeking beverages that go beyond basic flavors and offer complex taste profiles that evoke sensory pleasure and cultural richness. Chai tea mix, with its traditional spice blend and versatility in preparation (hot, iced, or blended), satisfies this demand for unique and indulgent tea moments, driving its adoption and popularity across diverse demographics.
Chai Tea Mix Market Opportunity: Innovation in Ingredients and Packaging
An opportunity within the chai tea mix market lies in innovating ingredients and packaging to enhance consumer appeal and market penetration. Manufacturers can explore creating premium chai blends with high-quality tea leaves, organic spices, and natural sweeteners to elevate the taste and health benefits of the beverage. Additionally, introducing convenient and eco-friendly packaging solutions, such as single-serve sachets or recyclable containers, caters to modern consumers' preferences for sustainability and convenience. Embracing these opportunities enables chai tea mix brands to differentiate themselves, attract new consumers, and capitalize on the growing market for specialty tea beverages.
Chai Tea Mix Market Share Analysis: Bags segment generated the highest revenue share in the industry
The Bags segment emerges as the largest in the Chai Tea Mix market by type. This segment's dominance is driven by the widespread availability and consumer preference for chai tea mix packaged in tea bags. Bags offer convenience and ease of use, allowing consumers to brew a single serving or multiple servings depending on their preference. Chai tea bags contain a blend of black tea leaves and aromatic spices such as cardamom, cinnamon, ginger, and cloves, delivering a rich and flavorful beverage experience. The popularity of chai tea bags extends across various demographics and consumer preferences, from traditionalists who appreciate the authentic preparation method to modern consumers seeking convenient ways to enjoy chai tea at home or on the go. Further, the tea bag format ensures freshness, easy storage, and portion control, making it a convenient choice for both retail shelves and online platforms. As consumer interest in specialty teas and exotic flavors continues to grow, the Bags segment is expected to maintain its leadership in the Chai Tea Mix market, supported by ongoing product innovations, premium offerings, and the rising popularity of tea consumption worldwide.
Chai Tea Mix Market Share Analysis: Café Restaurants is the fastest growing segment over the forecast period to 2032
The Café Restaurants segment is anticipated to be the fastest growing in the Chai Tea Mix market by application through 2032. This growth is driven by the increasing popularity of chai tea beverages in cafés, bistros, and coffee shops worldwide. Café restaurants cater to a diverse customer base seeking specialty beverages and unique flavor experiences, making chai tea an appealing addition to their menus. Chai tea's exotic blend of spices combined with milk or dairy alternatives offers a comforting and flavorful drink option that appeals to both traditional tea enthusiasts and modern consumers looking for innovative beverages. The rise of café culture, particularly in urban centers and tourist destinations, further fuels the demand for chai tea mixes in café settings. Further, café restaurants often customize chai tea recipes to create signature drinks, enhancing their appeal and driving repeat business from loyal customers. As consumer preferences shift towards premium and artisanal beverages, café restaurants play a pivotal role in shaping trends and driving market growth for chai tea mixes. The segment's expansion is supported by the growing number of cafés globally, coupled with increasing consumer spending on dining out experiences. Thus, the Café Restaurants segment is poised to lead the growth trajectory in the Chai Tea Mix market, reflecting broader trends in beverage consumption and culinary innovation.
Chai Tea Mix Market Segmentation
By Type
Bottles
Boxes
Bags
By Application
Household
Industrial Food & Beverage
Restaurants & Hotels
Café Restaurants
Countries Analyzed
North America (US, Canada, Mexico)
Europe (Germany, UK, France, Spain, Italy, Russia, Rest of Europe)
Asia Pacific (China, India, Japan, South Korea, Australia, South East Asia, Rest of Asia)
South America (Brazil, Argentina, Rest of South America)
Middle East and Africa (Saudi Arabia, UAE, Rest of Middle East, South Africa, Egypt, Rest of Africa)
Chai Tea Mix Companies Profiled in the Study
Ajinomoto General Foods
Bettys and Taylors of Harrogate
Caffe Nero
Kerry Group plc
Kraft Food
Oregon Chai
Peet's Coffee & Tea
Starbucks
Tea Forte
Urban Platter
*- List Not Exhaustive
Chapter 1. TABLE OF CONTENTS
Chapter 2. Introduction to Chai Tea Mix Market
2.1. Market Overview
2.2. Key Statistics and Report Highlights
2.3. Scope of the Comprehensive Study
2.3.1. Market Definition
2.3.2 Countries and Regions Covered
2.3.3 Research Objective
2.3.4 Units, Currency, and Conversions
2.3.5 Industry Value Chain
2.4. Key Market Segments
2.5. Key Companies
2.6. Study Period
Chapter 3. Strategic Analysis Review
3.1. Chai Tea Mix Pricing Analysis and Forecast
3.2. Porter’s Five Forces
3.3. Market Ecosystem
3.4. SWOT Analysis
3.5. Regulatory Scenario
3.3. Effects of Inflation, Russia-Ukraine War, moderating economic growth, and other macroeconomic factors
Chapter 4. Competitive Landscape
4.1. Market Share Analysis
4.1.1. Global Chai Tea Mix Market Share by Company, 2023
4.1.2. Product Offerings of Leading Chai Tea Mix Companies
4.2. Market Entropy
4.2.1. New Product Launches in the Industry
4.2.2. Mergers, Acquisitions, Joint ventures, and Partnerships
4.3. Key Strategies and Best Practices
Chapter 5. Global Market Projections: Best, Reference, and Low Case Scenarios
5.1. Growth Analysis- Case Scenario Definitions
5.2. Low Growth Case Scenario Forecasts
5.3. Reference Growth Case Scenario Forecasts
5.4. High Growth Case Scenario Forecasts
Chapter 6. Market Dynamics
6.1. Chai Tea Mix Market Drivers
6.2. Chai Tea Mix Market Challenges
6.6. Chai Tea Mix Market Opportunities
6.4. Chai Tea Mix Market Trends
Chapter 7. Global Chai Tea Mix Market Outlook Trends
7.1. Global Chai Tea Mix Revenue (USD Million) and CAGR (%) by Type (2021-2032)
7.2. Global Chai Tea Mix Revenue (USD Million) and CAGR (%) by Application (2021-2032)
7.3. Global Chai Tea Mix Revenue (USD Million) and CAGR (%) by Product (2021-2032)
By Type
Bottles
Boxes
Bags
By Application
Household
Industrial Food & Beverage
Restaurants & Hotels
Café Restaurants
Chapter 8. Global Chai Tea Mix Regional Analysis and Outlook
8.1. Global Chai Tea Mix Revenue (USD Million) By Regions (2021- 2032)
8.2. North America Chai Tea Mix Revenue (USD Million) by Country (2021-2032)
8.2.1. United States Chai Tea Mix Regional Analysis and Outlook
8.2.2. Canada Chai Tea Mix Regional Analysis and Outlook
8.2.3. Mexico Chai Tea Mix Regional Analysis and Outlook
8.3. Europe Chai Tea Mix Revenue (USD Million), by Country (2021-2032)
8.3.1. Germany Chai Tea Mix Regional Analysis and Outlook
8.3.2. France Chai Tea Mix Regional Analysis and Outlook
8.3.3. United Kingdom Chai Tea Mix Regional Analysis and Outlook
8.3.4. Spain Chai Tea Mix Regional Analysis and Outlook
8.3.5. Italy Chai Tea Mix Regional Analysis and Outlook
8.3.6. Russia Chai Tea Mix Regional Analysis and Outlook
8.3.7. Rest of Europe Chai Tea Mix Regional Analysis and Outlook
8.4. Asia Pacific Chai Tea Mix Revenue (USD Million) by Country (2021-2032)
8.4.1. China Chai Tea Mix Regional Analysis and Outlook
8.4.2. Japan Chai Tea Mix Regional Analysis and Outlook
8.4.3. India Chai Tea Mix Regional Analysis and Outlook
8.4.4. South Korea Chai Tea Mix Regional Analysis and Outlook
8.4.5. Australia Chai Tea Mix Regional Analysis and Outlook
8.4.6. South East Asia Chai Tea Mix Regional Analysis and Outlook
8.4.7. Rest of Asia Pacific Chai Tea Mix Regional Analysis and Outlook
8.5. South America Chai Tea Mix Revenue (USD Million), by Country (2021-2032)
8.5.1. Brazil Chai Tea Mix Regional Analysis and Outlook
8.5.2. Argentina Chai Tea Mix Regional Analysis and Outlook
8.5.3. Rest of South America Chai Tea Mix Regional Analysis and Outlook
8.6. Middle East and Africa Chai Tea Mix Revenue (USD Million) by Country (2021-2032)
8.6.1. Middle East Chai Tea Mix Regional Analysis and Outlook
8.6.2. Africa Chai Tea Mix Regional Analysis and Outlook
Chapter 9. North America Chai Tea Mix Analysis and Outlook
9.1. North America Chai Tea Mix Revenue (USD Million) by Segments (2021-2032)
9.1.1. North America Chai Tea Mix Revenue (USD Million) by Type (2021-2032)
9.1.2. North America Chai Tea Mix Revenue (USD Million) by Application (2021-2032)
9.1.3. North America Chai Tea Mix Revenue (USD Million) by Product (2021-2032)
By Type
Bottles
Boxes
Bags
By Application
Household
Industrial Food & Beverage
Restaurants & Hotels
Café Restaurants
Chapter 10. Europe Chai Tea Mix Analysis and Outlook
10.1. Europe Chai Tea Mix Revenue (USD Million), by Segments (USD Million) (2021-2032)
10.1.1. Europe Chai Tea Mix Revenue (USD Million) by Type (2021-2032)
10.1.2. Europe Chai Tea Mix Revenue (USD Million) by Application (2021-2032)
10.1.3. Europe Chai Tea Mix Revenue (USD Million) by Product (2021-2032)
By Type
Bottles
Boxes
Bags
By Application
Household
Industrial Food & Beverage
Restaurants & Hotels
Café Restaurants
Chapter 11. Asia Pacific Chai Tea Mix Analysis and Outlook
11.1. Asia Pacific Chai Tea Mix Revenue (USD Million), and Revenue (USD Million) by Segments (2021-2032)
11.1.1. Asia Pacific Chai Tea Mix Revenue (USD Million) by Type (2021-2032)
11.1.2. Asia Pacific Chai Tea Mix Revenue (USD Million) by Application (2021-2032)
11.1.3. Asia Pacific Chai Tea Mix Revenue (USD Million) by Product (2021-2032)
By Type
Bottles
Boxes
Bags
By Application
Household
Industrial Food & Beverage
Restaurants & Hotels
Café Restaurants
Chapter 12. South America Chai Tea Mix Analysis and Outlook
12.1. South America Chai Tea Mix Revenue (USD Million), by Segments (2021-2032)
12.1.1. South America Chai Tea Mix Revenue (USD Million) by Type (2021-2032)
12.1.2. South America Chai Tea Mix Revenue (USD Million) by Application (2021-2032)
12.1.3. South America Chai Tea Mix Revenue (USD Million) by Product (2021-2032)
By Type
Bottles
Boxes
Bags
By Application
Household
Industrial Food & Beverage
Restaurants & Hotels
Café Restaurants
Chapter 13. Middle East and Africa Chai Tea Mix Analysis and Outlook
13.1. Middle East and Africa Chai Tea Mix Revenue (USD Million), by Segments (2021-2032)
13.1.1. Middle East and Africa Chai Tea Mix Revenue (USD Million) by Type (2021-2032)
13.1.2. Middle East and Africa Chai Tea Mix Revenue (USD Million) by Application (2021-2032)
13.1.3. Middle East and Africa Chai Tea Mix Revenue (USD Million) by Product (2021-2032)
By Type
Bottles
Boxes
Bags
By Application
Household
Industrial Food & Beverage
Restaurants & Hotels
Café Restaurants
Chapter 14. Chai Tea Mix Company Profiles
14.1 Business Overview
14.2 Product Profiles
14.3 SWOT Profiles
14.5 Recent Developments
14.6 Financial Profile
List of Companies
Ajinomoto General Foods
Bettys and Taylors of Harrogate
Caffe Nero
Kerry Group plc
Kraft Food
Oregon Chai
Peet's Coffee & Tea
Starbucks
Tea Forte
Urban Platter
15. Methodology and Data Sources
15.1 Customization Offerings
15.2 Subscription Services
15.3 Related Reports
15.4 Publisher Expertise
LIST OF TABLES
Table 1 Market Segmentation Analysis
Table 2 Global Chai Tea Mix Market Share of Leading Companies, 2023
Table 3 Product Offerings of Leading Companies
Table 4 Low Growth Scenario Forecasts
Table 5 Reference Case Growth Scenario
Table 6 High Growth Case Scenario
Table 7 Global Chai Tea Mix Revenue (USD Million) And CAGR (%) By Type (2021-2032)
Table 8 Global Chai Tea Mix Revenue (USD Million) And CAGR (%) By Application (2021-2032)
Table 9 Global Chai Tea Mix Revenue (USD Million) And CAGR (%) By Product (2021-2032)
Table 10 Global Chai Tea Mix Market Revenue (USD Million) By Regions (2021-2032)
Table 11 Global Chai Tea Mix Market Share (%) By Regions (2021-2032)
Table 12 North America Chai Tea Mix Revenue (USD Million) By Country (2021-2032)
Table 13 Europe Chai Tea Mix Revenue (USD Million) By Country (2021-2032)
Table 14 Asia Pacific Chai Tea Mix Revenue (USD Million) By Country (2021-2032)
Table 15 South America Chai Tea Mix Revenue (USD Million) By Country (2021-2032)
Table 16 Middle East and Africa Chai Tea Mix Revenue (USD Million) By Region (2021-2032)
Table 17 North America Chai Tea Mix Revenue (USD Million) By Type (2021-2032)
Table 18 North America Chai Tea Mix Revenue (USD Million) By Application (2021-2032)
Table 19 North America Chai Tea Mix Revenue (USD Million) By Product (2021-2032)
Table 20 Europe Chai Tea Mix Revenue (USD Million) By Type (2021-2032)
Table 21 Europe Chai Tea Mix Revenue (USD Million) By Application (2021-2032)
Table 22 Europe Chai Tea Mix Revenue (USD Million) By Product (2021-2032)
Table 23 Asia Pacific Chai Tea Mix Revenue (USD Million) By Type (2021-2032)
Table 24 Asia Pacific Chai Tea Mix Revenue (USD Million) By Application (2021-2032)
Table 25 Asia Pacific Chai Tea Mix Revenue (USD Million) By Product (2021-2032)
Table 26 South America Chai Tea Mix Revenue (USD Million) By Type (2021-2032)
Table 27 South America Chai Tea Mix Revenue (USD Million) By Application (2021-2032)
Table 28 South America Chai Tea Mix Revenue (USD Million) By Product (2021-2032)
Table 29 Middle East and Africa Chai Tea Mix Revenue (USD Million) By Type (2021-2032)
Table 30 Middle East and Africa Chai Tea Mix Revenue (USD Million) By Application (2021-2032)
Table 31 Middle East and Africa Chai Tea Mix Revenue (USD Million) By Product (2021-2032)
LIST OF FIGURES
Figure 1. Market Scope
Figure 2. Pricing Forecasts Per Unit, 2023- 2032
Figure 3. Porter’s Five Forces
Figure 4. Global Chai Tea Mix Market Revenue (USD Million) By Regions (2021-2032)
Figure 5. Global Chai Tea Mix Market Share (%) By Regions (2023)
Figure 6. North America Chai Tea Mix Revenue (USD Million) By Country (2021-2032)
Figure 7. United States Chai Tea Mix Revenue (USD Million) By Country (2021-2032)
Figure 8. Canada Chai Tea Mix Revenue (USD Million) By Country (2021-2032)
Figure 9. Mexico Chai Tea Mix Revenue (USD Million) By Country (2021-2032)
Figure 10. Europe Chai Tea Mix Revenue (USD Million) By Country (2021-2032)
Figure 11. Germany Chai Tea Mix Revenue (USD Million) By Country (2021-2032)
Figure 12. France Chai Tea Mix Revenue (USD Million) By Country (2021-2032)
Figure 13. United Kingdom Chai Tea Mix Revenue (USD Million) By Country (2021-2032)
Figure 14. Spain Chai Tea Mix Revenue (USD Million) By Country (2021-2032)
Figure 15. Italy Chai Tea Mix Revenue (USD Million) By Country (2021-2032)
Figure 16. Russia Chai Tea Mix Revenue (USD Million) By Country (2021-2032)
Figure 17. Rest of Europe Chai Tea Mix Revenue (USD Million) By Country (2021-2032)
Figure 11. Asia Pacific Chai Tea Mix Revenue (USD Million) By Country (2021-2032)
Figure 12. China Chai Tea Mix Revenue (USD Million) By Country (2021-2032)
Figure 13. Japan Chai Tea Mix Revenue (USD Million) By Country (2021-2032)
Figure 14. India Chai Tea Mix Revenue (USD Million) By Country (2021-2032)
Figure 15. South Korea Chai Tea Mix Revenue (USD Million) By Country (2021-2032)
Figure 16. Australia Chai Tea Mix Revenue (USD Million) By Country (2021-2032)
Figure 17. South East Asia Chai Tea Mix Revenue (USD Million) By Country (2021-2032)
Figure 18. South America Chai Tea Mix Revenue (USD Million) By Country (2021-2032)
Figure 19. Brazil Chai Tea Mix Revenue (USD Million) By Country (2021-2032)
Figure 20. Argentina Chai Tea Mix Revenue (USD Million) By Country (2021-2032)
Figure 21. Rest of Asia Pacific Chai Tea Mix Revenue (USD Million) By Country (2021-2032)
Figure 22. Middle East and Africa Chai Tea Mix Revenue (USD Million) By Region (2021-2032)
Figure 23. Saudi Arabia Chai Tea Mix Revenue (USD Million) By Region (2021-2032)
Figure 24. The UAE Chai Tea Mix Revenue (USD Million) By Region (2021-2032)
Figure 25. Rest of Middle East Chai Tea Mix Revenue (USD Million) By Region (2021-2032)
Figure 26. South Africa Chai Tea Mix Revenue (USD Million) By Region (2021-2032)
Figure 27. Africa Chai Tea Mix Revenue (USD Million) By Region (2021-2032)
Figure 28. North America Chai Tea Mix Revenue (USD Million) By Type (2021-2032)
Figure 29. North America Chai Tea Mix Revenue (USD Million) By Application (2021-2032)
Figure 30. North America Chai Tea Mix Revenue (USD Million) By Product (2021-2032)
Figure 31. Europe Chai Tea Mix Revenue (USD Million) By Type (2021-2032)
Figure 32. Europe Chai Tea Mix Revenue (USD Million) By Application (2021-2032)
Figure 33. Europe Chai Tea Mix Revenue (USD Million) By Product (2021-2032)
Figure 34. Asia Pacific Chai Tea Mix Revenue (USD Million) By Type (2021-2032)
Figure 35. Asia Pacific Chai Tea Mix Revenue (USD Million) By Application (2021-2032)
Figure 36. Asia Pacific Chai Tea Mix Revenue (USD Million) By Product (2021-2032)
Figure 37. South America Chai Tea Mix Revenue (USD Million) By Type (2021-2032)
Figure 38. South America Chai Tea Mix Revenue (USD Million) By Application (2021-2032)
Figure 39. South America Chai Tea Mix Revenue (USD Million) By Product (2021-2032)
Figure 40. Middle East and Africa Chai Tea Mix Revenue (USD Million) By Type (2021-2032)
Figure 41. Middle East and Africa Chai Tea Mix Revenue (USD Million) By Application (2021-2032)
Figure 42. Middle East and Africa Chai Tea Mix Revenue (USD Million) By Product (2021-2032)
By Type
Bottles
Boxes
Bags
By Application
Household
Industrial Food & Beverage
Restaurants & Hotels
Café Restaurants
Countries Analyzed
North America (US, Canada, Mexico)
Europe (Germany, UK, France, Spain, Italy, Russia, Rest of Europe)
Asia Pacific (China, India, Japan, South Korea, Australia, South East Asia, Rest of Asia)
South America (Brazil, Argentina, Rest of South America)
Middle East and Africa (Saudi Arabia, UAE, Rest of Middle East, South Africa, Egypt, Rest of Africa)
