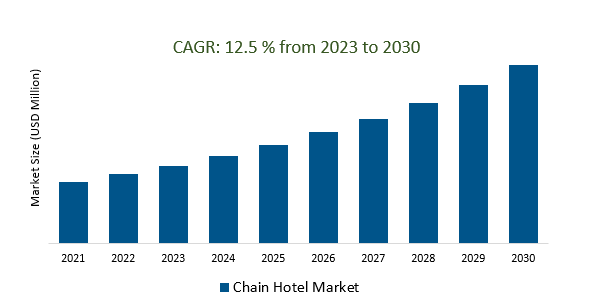
The Chain Hotel Market Size is estimated to register 12.5% growth over the forecast period from 2023 to 2030.
Chain Hotel Market Overview
Economic growth increased disposable incomes, and a rise in global travel demand are primary drivers stimulating the growth of the Chain Hotel Market. The leveraging technology to understand guest preferences, offering tailored services, and creating unique and memorable stays is fueling the demand. Chain hotels across the globe are prioritizing sustainability by implementing eco-friendly practices and initiatives. Globalization, coupled with the ease of travel and accessibility to various destinations, fosters a continuous influx of tourists. Real estate development and investment drive the expansion of chain hotels into new markets. The trend towards remote work is leading to an increase in "workcations" or remote working while staying at hotels. Further, Chain hotels are focusing on expanding their presence in emerging markets where there's growing demand for hospitality services.
Chain Hotel Market Dynamics
Market Trends- Prioritizing Sustainability and Wellness in the Chain Hotel Market.
The rising interest in wellness-focused travel experiences is becoming a significant trend shaping the hospitality industry. Guests are increasingly prioritizing health and wellness during their travels, seeking hotels that offer amenities like fitness centers, spa facilities, healthy dining options, and wellness programs.
Initiatives undertaken by chain hotels, including reducing carbon footprints, implementing energy-efficient technologies, and adopting eco-friendly practices throughout their operations are increasing the market growth.
Hotels are emphasizing sustainability not only to contribute positively to the environment but also appeal to a growing segment of travelers seeking eco-friendly accommodations.
Market Driver- Growing Tourism Industry in Chain Hotel Market drives the market demand.
The global rise in disposable incomes and a growing middle class are substantially contributing to the increasing number of travelers. Individuals having more spending power are inclined to explore leisure travel opportunities, both domestically and internationally.
The advent of online travel agencies (OTAs), user-friendly booking platforms, and mobile applications, contributing to more convenient and accessible travel planning are fueling the demand.
Globalization is leading to increased business interactions and collaborations across borders, resulting in a steady flow of corporate travelers seeking accommodations.
Market Opportunity- Surging Demand for Personalized Experiences in the Chain Hotel Market.
The primary factor steering this shift is the evolving preferences of modern travelers who seek unique and tailored experiences during their stays.
The rise of the millennial and Gen Z traveler demographics are significantly influencing the demand for personalized experiences who value experiences over material possessions and seek authenticity and uniqueness in their travels.
Furthermore, the emergence of social media and digital platforms is amplifying the demand for personalized experiences in the hospitality sector by sharing their experiences and seeking recommendations online, influencing others' travel decisions.
Market Share Analysis Business Hotels will register the fastest growth.
The Chain Hotel Market is analyzed across Resorts, Suite Hotels, Airport Hotels, and others. Business Hotels are poised to register the fastest growth. These hotels are strategically located in key business districts, city centers, or near major corporate hubs, aiming to accommodate the specific needs of business-oriented guests. These typically include well-equipped meeting rooms, conference halls, business centers, high-speed internet access, and other business-friendly amenities designed to facilitate work-related activities such as meetings, conferences, presentations, and networking events. Further, they focus on delivering seamless services that streamline business activities while providing a comfortable and conducive environment for work and relaxation. They incorporate innovative technologies such as smart room features, digital check-ins, and enhanced connectivity to meet the increasing demand for efficiency and convenience among business guests.
Market Share Analysis- Travel agents held a significant market share in 2023.
The Chain Hotel Market is analyzed across various booking modes including Travel Agents, Online Travel Portals, Direct Booking, and Others. Of these, Travel agents held a significant market share in 2023. Traditionally, travel agents serve as a primary avenue for travelers to plan and book their accommodations, leveraging their expertise to provide personalized recommendations and tailored packages. They offer a level of expertise, guidance, and personalized service that some travelers prefer, especially for intricate or multi-destination trips, group bookings, or specialized accommodations. Further, Travel Agents frequently collaborate with chain hotels to offer exclusive deals, packages, or promotions to their clients, fostering partnerships that benefit both parties. Travel Agents now offer online portals or websites where clients can explore and book accommodations, blending the convenience of online booking with the personalized assistance and expertise of travel professionals.
Chain Hotel Market Segmentation
By Type
- Business Hotels
- Resorts
- Suite Hotels
- Airport Hotels
- Others
By Application
- Travelers
- Business Customers
- Trainers and Trainees
- Government and Army Staff
- Others
By Booking Mode
- Travel Agents
- Online travel Portal
- Direct Booking
- Others
By Region
- North America (United States, Canada, Mexico)
- Europe (Germany, France, United Kingdom, Spain, Italy, Others)
- Asia Pacific (China, India, Japan, South Korea, Australia, Others)
- Latin America (Brazil, Argentina, Others)
- Middle East and Africa (Saudi Arabia, UAE, Kuwait, Other Middle East, South Africa, Nigeria, Other Africa)
Chain Hotel Market Companies
- InterContinental Hotels Group (United Kingdom)
- Marriott International (United States)
- Hilton Worldwide (United States)
- Jin Jiang International (China)
- Wyndham Hotels and Resorts (United States)
- AccorHotels (France)
- Choice Hotels (United States)
- Hyatt Hotels Corporation (United States)
- Magnuson Hotels (United States)
- OYO (India)
- Radisson Hotel Group (United States)
- Greentree Inns Hotel Management Group (China)
- Best Western Hotels (United States)
- Home Inns Group (China)
- China Lodging Group (China)
*List not exhaustive
Chain Hotel Market Outlook 2023
1 Market Overview
1.1 Introduction to the Chain Hotel Market
1.2 Scope of the Study
1.3 Research Objective
1.3.1 Key Market Scope and Segments
1.3.2 Players Covered
1.3.3 Years Considered
2 Executive Summary
2.1 2023 Chain Hotel Industry- Market Statistics
3 Market Dynamics
3.1 Market Drivers
3.2 Market Challenges
3.3 Market Opportunities
3.4 Market Trends
4 Market Factor Analysis
4.1 Porter’s Five Forces
4.2 Market Entropy
4.2.1 Global Chain Hotel Market Companies with Area Served
4.2.2 Products Offerings Global Chain Hotel Market
5 COVID-19 Impact Analysis and Outlook Scenarios
5.1.1 Covid-19 Impact Analysis
5.1.2 post-COVID-19 Scenario- Low Growth Case
5.1.3 post-COVID-19 Scenario- Reference Growth Case
5.1.4 post-COVID-19 Scenario- Low Growth Case
6 Global Chain Hotel Market Trends
6.1 Global Chain Hotel Revenue (USD Million) and CAGR (%) by Type (2018-2030)
6.2 Global Chain Hotel Revenue (USD Million) and CAGR (%) by Applications (2018-2030)
6.3 Global Chain Hotel Revenue (USD Million) and CAGR (%) by regions (2018-2030)
7 Global Chain Hotel Market Revenue (USD Million) by Type, and Applications (2018-2022)
7.1 Global Chain Hotel Revenue (USD Million) by Type (2018-2022)
7.1.1 Global Chain Hotel Revenue (USD Million), Market Share (%) by Type (2018-2022)
7.2 Global Chain Hotel Revenue (USD Million) by Applications (2018-2022)
7.2.1 Global Chain Hotel Revenue (USD Million), Market Share (%) by Applications (2018-2022)
8 Global Chain Hotel Development Regional Status and Outlook
8.1 Global Chain Hotel Revenue (USD Million) By Regions (2018-2022)
8.2 North America Chain Hotel Revenue (USD Million) by Type, and Application (2018-2022)
8.2.1 North America Chain Hotel Revenue (USD Million) by Country (2018-2022)
8.2.2 North America Chain Hotel Revenue (USD Million) by Type (2018-2022)
8.2.3 North America Chain Hotel Revenue (USD Million) by Applications (2018-2022)
8.3 Europe Chain Hotel Revenue (USD Million), by Type, and Applications (USD Million) (2018-2022)
8.3.1 Europe Chain Hotel Revenue (USD Million), by Country (2018-2022)
8.3.2 Europe Chain Hotel Revenue (USD Million) by Type (2018-2022)
8.3.3 Europe Chain Hotel Revenue (USD Million) by Applications (2018-2022)
8.4 Asia Pacific Chain Hotel Revenue (USD Million), and Revenue (USD Million) by Type, and Applications (2018-2022)
8.4.1 Asia Pacific Chain Hotel Revenue (USD Million) by Country (2018-2022)
8.4.2 Asia Pacific Chain Hotel Revenue (USD Million) by Type (2018-2022)
8.4.3 Asia Pacific Chain Hotel Revenue (USD Million) by Applications (2018-2022)
8.5 South America Chain Hotel Revenue (USD Million), by Type, and Applications (2018-2022)
8.5.1 South America Chain Hotel Revenue (USD Million), by Country (2018-2022)
8.5.2 South America Chain Hotel Revenue (USD Million) by Type (2018-2022)
8.5.3 South America Chain Hotel Revenue (USD Million) by Applications (2018-2022)
8.6 Middle East and Africa Chain Hotel Revenue (USD Million), by Type, Technology, Application, Thickness (2018-2022)
8.6.1 Middle East and Africa Chain Hotel Revenue (USD Million) by Country (2018-2022)
8.6.2 Middle East and Africa Chain Hotel Revenue (USD Million) by Type (2018-2022)
8.6.3 Middle East and Africa Chain Hotel Revenue (USD Million) by Applications (2018-2022)
9 Company Profiles
10 Global Chain Hotel Market Revenue (USD Million), by Type, and Applications (2023-2030)
10.1 Global Chain Hotel Revenue (USD Million) and Market Share (%) by Type (2023-2030)
10.1.1 Global Chain Hotel Revenue (USD Million), and Market Share (%) by Type (2023-2030)
10.2 Global Chain Hotel Revenue (USD Million) and Market Share (%) by Applications (2023-2030)
10.2.1 Global Chain Hotel Revenue (USD Million), and Market Share (%) by Applications (2023-2030)
11 Global Chain Hotel Development Regional Status and Outlook Forecast
11.1 Global Chain Hotel Revenue (USD Million) By Regions (2023-2030)
11.2 North America Chain Hotel Revenue (USD Million) by Type, and Applications (2023-2030)
11.2.1 North America Chain Hotel Revenue (USD) Million by Country (2023-2030)
11.2.2 North America Chain Hotel Revenue (USD Million), by Type (2023-2030)
11.2.3 North America Chain Hotel Revenue (USD Million), Market Share (%) by Applications (2023-2030)
11.3 Europe Chain Hotel Revenue (USD Million), by Type, and Applications (2023-2030)
11.3.1 Europe Chain Hotel Revenue (USD Million), by Country (2023-2030)
11.3.2 Europe Chain Hotel Revenue (USD Million), by Type (2023-2030)
11.3.3 Europe Chain Hotel Revenue (USD Million), by Applications (2023-2030)
11.4 Asia Pacific Chain Hotel Revenue (USD Million) by Type, and Applications (2023-2030)
11.4.1 Asia Pacific Chain Hotel Revenue (USD Million), by Country (2023-2030)
11.4.2 Asia Pacific Chain Hotel Revenue (USD Million), by Type (2023-2030)
11.4.3 Asia Pacific Chain Hotel Revenue (USD Million), by Applications (2023-2030)
11.5 South America Chain Hotel Revenue (USD Million), by Type, and Applications (2023-2030)
11.5.1 South America Chain Hotel Revenue (USD Million), by Country (2023-2030)
11.5.2 South America Chain Hotel Revenue (USD Million), by Type (2023-2030)
11.5.3 South America Chain Hotel Revenue (USD Million), by Applications (2023-2030)
11.6 Middle East and Africa Chain Hotel Revenue (USD Million), by Type, and Applications (2023-2030)
11.6.1 Middle East and Africa Chain Hotel Revenue (USD Million), by region (2023-2030)
11.6.2 Middle East and Africa Chain Hotel Revenue (USD Million), by Type (2023-2030)
11.6.3 Middle East and Africa Chain Hotel Revenue (USD Million), by Applications (2023-2030)
12 Methodology and Data Sources
12.1 Methodology/Research Approach
12.1.1 Research Programs/Design
12.1.2 Market Size Estimation
12.1.3 Market Breakdown and Data Triangulation
12.2 Data Sources
12.2.1 Secondary Sources
12.2.2 Primary Sources
12.3 Disclaimer
List of Tables
Table 1 Market Segmentation Analysis
Table 2 Global Chain Hotel Market Companies with Areas Served
Table 3 Products Offerings Global Chain Hotel Market
Table 4 Low Growth Scenario Forecasts
Table 5 Reference Case Growth Scenario
Table 6 High Growth Case Scenario
Table 7 Global Chain Hotel Revenue (USD Million) And CAGR (%) By Type (2018-2030)
Table 8 Global Chain Hotel Revenue (USD Million) And CAGR (%) By Applications (2018-2030)
Table 9 Global Chain Hotel Revenue (USD Million) And CAGR (%) By Regions (2018-2030)
Table 10 Global Chain Hotel Revenue (USD Million) By Type (2018-2022)
Table 11 Global Chain Hotel Revenue Market Share (%) By Type (2018-2022)
Table 12 Global Chain Hotel Revenue (USD Million) By Applications (2018-2022)
Table 13 Global Chain Hotel Revenue Market Share (%) By Applications (2018-2022)
Table 14 Global Chain Hotel Market Revenue (USD Million) By Regions (2018-2022)
Table 15 Global Chain Hotel Market Share (%) By Regions (2018-2022)
Table 16 North America Chain Hotel Revenue (USD Million) By Country (2018-2022)
Table 17 North America Chain Hotel Revenue (USD Million) By Type (2018-2022)
Table 18 North America Chain Hotel Revenue (USD Million) By Applications (2018-2022)
Table 19 Europe Chain Hotel Revenue (USD Million) By Country (2018-2022)
Table 20 Europe Chain Hotel Revenue (USD Million) By Type (2018-2022)
Table 21 Europe Chain Hotel Revenue (USD Million) By Applications (2018-2022)
Table 22 Asia Pacific Chain Hotel Revenue (USD Million) By Country (2018-2022)
Table 23 Asia Pacific Chain Hotel Revenue (USD Million) By Type (2018-2022)
Table 24 Asia Pacific Chain Hotel Revenue (USD Million) By Applications (2018-2022)
Table 25 South America Chain Hotel Revenue (USD Million) By Country (2018-2022)
Table 26 South America Chain Hotel Revenue (USD Million) By Type (2018-2022)
Table 27 South America Chain Hotel Revenue (USD Million) By Applications (2018-2022)
Table 28 Middle East and Africa Chain Hotel Revenue (USD Million) By Region (2018-2022)
Table 29 Middle East and Africa Chain Hotel Revenue (USD Million) By Type (2018-2022)
Table 30 Middle East and Africa Chain Hotel Revenue (USD Million) By Applications (2018-2022)
Table 31 Financial Analysis
Table 32 Global Chain Hotel Revenue (USD Million) By Type (2023-2030)
Table 33 Global Chain Hotel Revenue Market Share (%) By Type (2023-2030)
Table 34 Global Chain Hotel Revenue (USD Million) By Applications (2023-2030)
Table 35 Global Chain Hotel Revenue Market Share (%) By Applications (2023-2030)
Table 36 Global Chain Hotel Market Revenue (USD Million), And Revenue (USD Million) By Regions (2023-2030)
Table 37 North America Chain Hotel Revenue (USD)By Country (2023-2030)
Table 38 North America Chain Hotel Revenue (USD Million) By Type (2023-2030)
Table 39 North America Chain Hotel Revenue (USD Million) By Applications (2023-2030)
Table 40 Europe Chain Hotel Revenue (USD Million) By Country (2023-2030)
Table 41 Europe Chain Hotel Revenue (USD Million) By Type (2023-2030)
Table 42 Europe Chain Hotel Revenue (USD Million) By Applications (2023-2030)
Table 43 Asia Pacific Chain Hotel Revenue (USD Million) By Country (2023-2030)
Table 44 Asia Pacific Chain Hotel Revenue (USD Million) By Type (2023-2030)
Table 45 Asia Pacific Chain Hotel Revenue (USD Million) By Applications (2023-2030)
Table 46 South America Chain Hotel Revenue (USD Million) By Country (2023-2030)
Table 47 South America Chain Hotel Revenue (USD Million) By Type (2023-2030)
Table 48 South America Chain Hotel Revenue (USD Million) By Applications (2023-2030)
Table 49 Middle East and Africa Chain Hotel Revenue (USD Million) By Region (2023-2030)
Table 50 Middle East and Africa Chain Hotel Revenue (USD Million) By Region (2023-2030)
Table 51 Middle East and Africa Chain Hotel Revenue (USD Million) By Type (2023-2030)
Table 52 Middle East and Africa Chain Hotel Revenue (USD Million) By Applications (2023-2030)
Table 53 Research Programs/Design for This Report
Table 54 Key Data Information from Secondary Sources
Table 55 Key Data Information from Primary Sources
List of Figures
Figure 1 Market Scope
Figure 2 Porter’s Five Forces
Figure 3 Global Chain Hotel Revenue (USD Million) By Type (2018-2022)
Figure 4 Global Chain Hotel Revenue Market Share (%) By Type (2022)
Figure 5 Global Chain Hotel Revenue (USD Million) By Applications (2018-2022)
Figure 6 Global Chain Hotel Revenue Market Share (%) By Applications (2022)
Figure 7 Global Chain Hotel Market Revenue (USD Million) By Regions (2018-2022)
Figure 8 Global Chain Hotel Market Share (%) By Regions (2022)
Figure 9 North America Chain Hotel Revenue (USD Million) By Country (2018-2022)
Figure 10 North America Chain Hotel Revenue (USD Million) By Type (2018-2022)
Figure 11 North America Chain Hotel Revenue (USD Million) By Applications (2018-2022)
Figure 12 Europe Chain Hotel Revenue (USD Million) By Country (2018-2022)
Figure 13 Europe Chain Hotel Revenue (USD Million) By Type (2018-2022)
Figure 14 Europe Chain Hotel Revenue (USD Million) By Applications (2018-2022)
Figure 15 Asia Pacific Chain Hotel Revenue (USD Million) By Country (2018-2022)
Figure 16 Asia Pacific Chain Hotel Revenue (USD Million) By Type (2018-2022)
Figure 17 Asia Pacific Chain Hotel Revenue (USD Million) By Applications (2018-2022)
Figure 18 South America Chain Hotel Revenue (USD Million) By Country (2018-2022)
Figure 19 South America Chain Hotel Revenue (USD Million) By Type (2018-2022)
Figure 20 South America Chain Hotel Revenue (USD Million) By Applications (2018-2022)
Figure 21 Middle East and Africa Chain Hotel Revenue (USD Million) By Region (2018-2022)
Figure 22 Middle East and Africa Chain Hotel Revenue (USD Million) By Type (2018-2022)
Figure 23 Middle East and Africa Chain Hotel Revenue (USD Million) By Applications (2018-2022)
Figure 24 Global Chain Hotel Revenue (USD Million) By Type (2023-2030)
Figure 25 Global Chain Hotel Revenue Market Share (%) By Type (2030)
Figure 26 Global Chain Hotel Revenue (USD Million) By Applications (2023-2030)
Figure 27 Global Chain Hotel Revenue Market Share (%) By Applications (2030)
Figure 28 Global Chain Hotel Market Revenue (USD Million) By Regions (2023-2030)
Figure 29 North America Chain Hotel Revenue (USD Million) By Country (2023-2030)
Figure 30 North America Chain Hotel Revenue (USD Million) By Type (2023-2030)
Figure 31 North America Chain Hotel Revenue (USD Million) By Applications (2023-2030)
Figure 32 Europe Chain Hotel Revenue (USD Million) By Country (2023-2030)
Figure 33 Europe Chain Hotel Revenue (USD Million) By Type (2023-2030)
Figure 34 Europe Chain Hotel Revenue (USD Million) By Applications (2023-2030)
Figure 35 Asia Pacific Chain Hotel Revenue (USD Million) By Country (2023-2030)
Figure 36 Asia Pacific Chain Hotel Revenue (USD Million) By Type (2023-2030)
Figure 37 Asia Pacific Chain Hotel Revenue (USD Million) By Applications (2023-2030)
Figure 38 South America Chain Hotel Revenue (USD Million) By Country (2023-2030)
Figure 39 South America Chain Hotel Revenue (USD Million) By Type (2023-2030)
Figure 40 South America Chain Hotel Revenue (USD Million) By Applications (2023-2030)
Figure 41 Middle East and Africa Chain Hotel Revenue (USD Million) By Region (2023-2030)
Figure 42 Middle East and Africa Chain Hotel Revenue (USD Million) By Region (2023-2030)
Figure 43 Middle East and Africa Chain Hotel Revenue (USD Million) By Type (2023-2030)
Figure 44 Middle East and Africa Chain Hotel Revenue (USD Million) By Applications (2023-2030)
Figure 45 Bottom-Up and Top-Down Approaches for This Report
Figure 46 Data Triangulation
