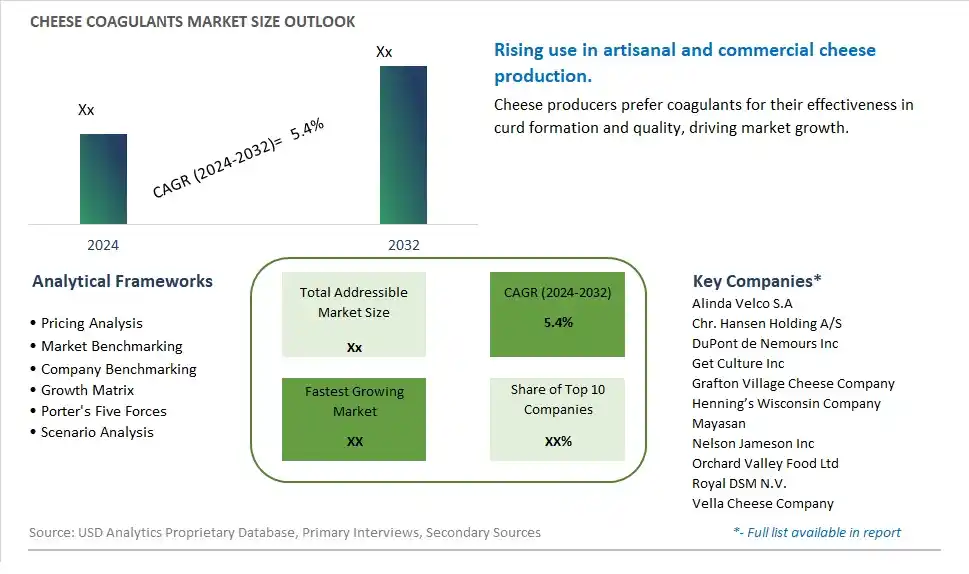
Global Cheese Coagulants Market Size is valued at $XX Million in 2024 and is forecast to register a growth rate (CAGR) of 5.4% to reach $XX Million by 2032.
The global Cheese Coagulants Market Comprehensive Study analyzes and forecasts the market size across 6 regions and 24 countries for diverse segments -By Form (Liquid, Powder, Tablet), By Type (Animal, Vegetable, Others), By Application (Commercial, Household, Others)
An Introduction to Cheese Coagulants Market
In 2024, the Cheese Coagulants market is witnessing robust growth, driven by the increasing demand for diverse and high-quality cheese products. Cheese coagulants, including rennet and microbial coagulants, are essential for the cheese-making process, helping to coagulate milk and form curds. The market is supported by the growing trend towards artisanal and specialty cheeses. Advances in biotechnology and enzyme production are enhancing the efficiency, specificity, and safety of cheese coagulants. The market is also benefiting from the trend towards clean-label and vegetarian coagulants, appealing to cheese producers and consumers seeking natural and ethically sourced ingredients.
Cheese Coagulants Competitive Landscape
The market report analyses the leading companies in the industry including Alinda Velco S.A, Chr. Hansen Holding A/S, DuPont de Nemours Inc, Get Culture Inc, Grafton Village Cheese Company, Henning’s Wisconsin Company, Mayasan, Nelson Jameson Inc, Orchard Valley Food Ltd, Royal DSM N.V., Vella Cheese Company, and Others.
Cheese Coagulants Market Dynamics
Cheese Coagulants Market Trend: Growing Demand for Natural and Clean Label Ingredients
A prominent market trend for cheese coagulants is the increasing demand for natural and clean label ingredients among consumers and manufacturers. With a focus on transparency, health-consciousness, and sustainability, there's a preference for coagulants derived from natural sources such as microbial enzymes, vegetable rennet, and traditional methods like fermentation. This trend aligns with the broader movement towards clean eating and the desire for food products with simple, recognizable ingredients.
Cheese Coagulants Market Driver: Shift Towards Plant-Based and Alternative Cheeses
A key driver fueling the market for cheese coagulants is the shift towards plant-based and alternative cheeses. As more consumers explore dairy-free and vegan options due to health, ethical, or dietary reasons, there's a demand for coagulants that can facilitate the production of plant-based cheeses with similar texture and flavor characteristics to traditional cheeses. Cheese coagulants play a crucial role in achieving the desired consistency and structure in plant-based cheese formulations, driving innovation and adoption in the alternative cheese market.
Cheese Coagulants Market Opportunity: Innovation in Coagulant Technologies and Formulations
An opportunity within the cheese coagulants market lies in innovation, particularly in coagulant technologies and formulations. Manufacturers can invest in research and development to create advanced coagulants that offer improved performance, cost-effectiveness, and versatility in cheese production. Additionally, developing coagulants tailored to specific cheese types, such as soft cheeses, hard cheeses, or artisanal varieties, caters to the diverse needs of cheesemakers and supports the creation of high-quality, differentiated cheese products. By focusing on innovation and customization, companies can capitalize on the growing demand for cheese coagulants and drive market growth in both traditional and alternative cheese segments.
Cheese Coagulants Market Share Analysis: Powder segment generated the highest revenue share in the industry
The Powder segment emerges as the largest in the Cheese Coagulants market by form. Powdered cheese coagulants are preferred by manufacturers and cheese artisans alike due to their ease of use, versatility, and reliable performance in cheese production processes. Powdered coagulants include enzymes such as rennet or microbial coagulants, which are essential for curd formation and the development of cheese texture and flavor. Powdered forms of coagulants offer precise dosing capabilities, ensuring consistency in cheese-making practices and facilitating controlled fermentation processes. This segment's dominance is also influenced by factors such as ease of storage, longer shelf life, and compatibility with various cheese types and production scales—from artisanal cheese-making to large-scale industrial operations. Further, powdered coagulants contribute to the efficiency and cost-effectiveness of cheese production, enabling manufacturers to meet stringent quality standards while optimizing production processes. As the global cheese industry continues to expand and diversify, with increasing demand for specialty cheeses and innovative cheese products, the Powder segment is expected to maintain its leadership in the Cheese Coagulants market, supported by ongoing advancements in enzyme technology and sustainable cheese production practices.
Cheese Coagulants Market Share Analysis: Vegetable is the fastest growing segment over the forecast period to 2032
The Vegetable segment is projected to be the fastest growing in the Cheese Coagulants market by type through 2032. This growth is driven by increasing consumer preferences for vegetarian and plant-based products, including cheese made with vegetable-derived coagulants. Vegetable coagulants, such as microbial enzymes or plant-derived rennets, are gaining popularity among cheese manufacturers and artisanal producers seeking alternatives to traditional animal-based rennets. These vegetable-based options offer a natural and sustainable approach to cheese production, aligning with growing trends towards vegetarianism, veganism, and sustainable food practices. Further, vegetable coagulants cater to dietary restrictions and cultural preferences, making them suitable for a broader consumer base globally. The segment's growth is also supported by technological advancements in enzyme engineering and fermentation processes, enhancing the efficiency and performance of vegetable-derived coagulants in cheese-making applications. As awareness of environmental sustainability and animal welfare continues to influence consumer choices, the Vegetable segment is expected to expand significantly in the Cheese Coagulants market, driving innovation and market diversification in the global cheese industry.
Cheese Coagulants Market Share Analysis: Commercial segment generated the highest revenue share in the industry
The Commercial segment emerges as the largest in the Cheese Coagulants market by application. This segment encompasses cheese manufacturers, dairy processors, and foodservice providers that require cheese coagulants in bulk quantities for industrial-scale production and culinary applications. Commercial cheese production relies heavily on efficient and reliable coagulants to ensure consistent quality, texture, and flavor profiles across various types of cheese. Cheese coagulants play a critical role in the curdling and fermentation processes essential for cheese formation, influencing factors such as curd yield, cheese maturation, and final product characteristics. The Commercial segment benefits from the global demand for cheese and dairy products, driven by changing dietary preferences, increasing urbanization, and growing foodservice industry. Further, technological advancements in enzyme technology and fermentation processes continue to enhance the efficiency and performance of coagulants in large-scale cheese manufacturing operations. As the cheese market expands and diversifies with evolving consumer tastes and preferences, the Commercial segment is expected to maintain its leadership in the Cheese Coagulants market, supported by ongoing innovations in dairy processing and food technology.
Cheese Coagulants Market Segmentation
By Form
Liquid
Powder
Tablet
By Type
Animal
Vegetable
Others
By Application
Commercial
Household
Others
Countries Analyzed
North America (US, Canada, Mexico)
Europe (Germany, UK, France, Spain, Italy, Russia, Rest of Europe)
Asia Pacific (China, India, Japan, South Korea, Australia, South East Asia, Rest of Asia)
South America (Brazil, Argentina, Rest of South America)
Middle East and Africa (Saudi Arabia, UAE, Rest of Middle East, South Africa, Egypt, Rest of Africa)
Cheese Coagulants Companies Profiled in the Study
Alinda Velco S.A
Chr. Hansen Holding A/S
DuPont de Nemours Inc
Get Culture Inc
Grafton Village Cheese Company
Henning’s Wisconsin Company
Mayasan
Nelson Jameson Inc
Orchard Valley Food Ltd
Royal DSM N.V.
Vella Cheese Company
*- List Not Exhaustive
Chapter 1. TABLE OF CONTENTS
Chapter 2. Introduction to Cheese Coagulants Market
2.1. Market Overview
2.2. Key Statistics and Report Highlights
2.3. Scope of the Comprehensive Study
2.3.1. Market Definition
2.3.2 Countries and Regions Covered
2.3.3 Research Objective
2.3.4 Units, Currency, and Conversions
2.3.5 Industry Value Chain
2.4. Key Market Segments
2.5. Key Companies
2.6. Study Period
Chapter 3. Strategic Analysis Review
3.1. Cheese Coagulants Pricing Analysis and Forecast
3.2. Porter’s Five Forces
3.3. Market Ecosystem
3.4. SWOT Analysis
3.5. Regulatory Scenario
3.3. Effects of Inflation, Russia-Ukraine War, moderating economic growth, and other macroeconomic factors
Chapter 4. Competitive Landscape
4.1. Market Share Analysis
4.1.1. Global Cheese Coagulants Market Share by Company, 2023
4.1.2. Product Offerings of Leading Cheese Coagulants Companies
4.2. Market Entropy
4.2.1. New Product Launches in the Industry
4.2.2. Mergers, Acquisitions, Joint ventures, and Partnerships
4.3. Key Strategies and Best Practices
Chapter 5. Global Market Projections: Best, Reference, and Low Case Scenarios
5.1. Growth Analysis- Case Scenario Definitions
5.2. Low Growth Case Scenario Forecasts
5.3. Reference Growth Case Scenario Forecasts
5.4. High Growth Case Scenario Forecasts
Chapter 6. Market Dynamics
6.1. Cheese Coagulants Market Drivers
6.2. Cheese Coagulants Market Challenges
6.6. Cheese Coagulants Market Opportunities
6.4. Cheese Coagulants Market Trends
Chapter 7. Global Cheese Coagulants Market Outlook Trends
7.1. Global Cheese Coagulants Revenue (USD Million) and CAGR (%) by Type (2021-2032)
7.2. Global Cheese Coagulants Revenue (USD Million) and CAGR (%) by Application (2021-2032)
7.3. Global Cheese Coagulants Revenue (USD Million) and CAGR (%) by Product (2021-2032)
By Form
Liquid
Powder
Tablet
By Type
Animal
Vegetable
Others
By Application
Commercial
Household
Others
Chapter 8. Global Cheese Coagulants Regional Analysis and Outlook
8.1. Global Cheese Coagulants Revenue (USD Million) By Regions (2021- 2032)
8.2. North America Cheese Coagulants Revenue (USD Million) by Country (2021-2032)
8.2.1. United States Cheese Coagulants Regional Analysis and Outlook
8.2.2. Canada Cheese Coagulants Regional Analysis and Outlook
8.2.3. Mexico Cheese Coagulants Regional Analysis and Outlook
8.3. Europe Cheese Coagulants Revenue (USD Million), by Country (2021-2032)
8.3.1. Germany Cheese Coagulants Regional Analysis and Outlook
8.3.2. France Cheese Coagulants Regional Analysis and Outlook
8.3.3. United Kingdom Cheese Coagulants Regional Analysis and Outlook
8.3.4. Spain Cheese Coagulants Regional Analysis and Outlook
8.3.5. Italy Cheese Coagulants Regional Analysis and Outlook
8.3.6. Russia Cheese Coagulants Regional Analysis and Outlook
8.3.7. Rest of Europe Cheese Coagulants Regional Analysis and Outlook
8.4. Asia Pacific Cheese Coagulants Revenue (USD Million) by Country (2021-2032)
8.4.1. China Cheese Coagulants Regional Analysis and Outlook
8.4.2. Japan Cheese Coagulants Regional Analysis and Outlook
8.4.3. India Cheese Coagulants Regional Analysis and Outlook
8.4.4. South Korea Cheese Coagulants Regional Analysis and Outlook
8.4.5. Australia Cheese Coagulants Regional Analysis and Outlook
8.4.6. South East Asia Cheese Coagulants Regional Analysis and Outlook
8.4.7. Rest of Asia Pacific Cheese Coagulants Regional Analysis and Outlook
8.5. South America Cheese Coagulants Revenue (USD Million), by Country (2021-2032)
8.5.1. Brazil Cheese Coagulants Regional Analysis and Outlook
8.5.2. Argentina Cheese Coagulants Regional Analysis and Outlook
8.5.3. Rest of South America Cheese Coagulants Regional Analysis and Outlook
8.6. Middle East and Africa Cheese Coagulants Revenue (USD Million) by Country (2021-2032)
8.6.1. Middle East Cheese Coagulants Regional Analysis and Outlook
8.6.2. Africa Cheese Coagulants Regional Analysis and Outlook
Chapter 9. North America Cheese Coagulants Analysis and Outlook
9.1. North America Cheese Coagulants Revenue (USD Million) by Segments (2021-2032)
9.1.1. North America Cheese Coagulants Revenue (USD Million) by Type (2021-2032)
9.1.2. North America Cheese Coagulants Revenue (USD Million) by Application (2021-2032)
9.1.3. North America Cheese Coagulants Revenue (USD Million) by Product (2021-2032)
By Form
Liquid
Powder
Tablet
By Type
Animal
Vegetable
Others
By Application
Commercial
Household
Others
Chapter 10. Europe Cheese Coagulants Analysis and Outlook
10.1. Europe Cheese Coagulants Revenue (USD Million), by Segments (USD Million) (2021-2032)
10.1.1. Europe Cheese Coagulants Revenue (USD Million) by Type (2021-2032)
10.1.2. Europe Cheese Coagulants Revenue (USD Million) by Application (2021-2032)
10.1.3. Europe Cheese Coagulants Revenue (USD Million) by Product (2021-2032)
By Form
Liquid
Powder
Tablet
By Type
Animal
Vegetable
Others
By Application
Commercial
Household
Others
Chapter 11. Asia Pacific Cheese Coagulants Analysis and Outlook
11.1. Asia Pacific Cheese Coagulants Revenue (USD Million), and Revenue (USD Million) by Segments (2021-2032)
11.1.1. Asia Pacific Cheese Coagulants Revenue (USD Million) by Type (2021-2032)
11.1.2. Asia Pacific Cheese Coagulants Revenue (USD Million) by Application (2021-2032)
11.1.3. Asia Pacific Cheese Coagulants Revenue (USD Million) by Product (2021-2032)
By Form
Liquid
Powder
Tablet
By Type
Animal
Vegetable
Others
By Application
Commercial
Household
Others
Chapter 12. South America Cheese Coagulants Analysis and Outlook
12.1. South America Cheese Coagulants Revenue (USD Million), by Segments (2021-2032)
12.1.1. South America Cheese Coagulants Revenue (USD Million) by Type (2021-2032)
12.1.2. South America Cheese Coagulants Revenue (USD Million) by Application (2021-2032)
12.1.3. South America Cheese Coagulants Revenue (USD Million) by Product (2021-2032)
By Form
Liquid
Powder
Tablet
By Type
Animal
Vegetable
Others
By Application
Commercial
Household
Others
Chapter 13. Middle East and Africa Cheese Coagulants Analysis and Outlook
13.1. Middle East and Africa Cheese Coagulants Revenue (USD Million), by Segments (2021-2032)
13.1.1. Middle East and Africa Cheese Coagulants Revenue (USD Million) by Type (2021-2032)
13.1.2. Middle East and Africa Cheese Coagulants Revenue (USD Million) by Application (2021-2032)
13.1.3. Middle East and Africa Cheese Coagulants Revenue (USD Million) by Product (2021-2032)
By Form
Liquid
Powder
Tablet
By Type
Animal
Vegetable
Others
By Application
Commercial
Household
Others
Chapter 14. Cheese Coagulants Company Profiles
14.1 Business Overview
14.2 Product Profiles
14.3 SWOT Profiles
14.5 Recent Developments
14.6 Financial Profile
List of Companies
Alinda Velco S.A
Chr. Hansen Holding A/S
DuPont de Nemours Inc
Get Culture Inc
Grafton Village Cheese Company
Henning’s Wisconsin Company
Mayasan
Nelson Jameson Inc
Orchard Valley Food Ltd
Royal DSM N.V.
Vella Cheese Company
15. Methodology and Data Sources
15.1 Customization Offerings
15.2 Subscription Services
15.3 Related Reports
15.4 Publisher Expertise
LIST OF TABLES
Table 1 Market Segmentation Analysis
Table 2 Global Cheese Coagulants Market Share of Leading Companies, 2023
Table 3 Product Offerings of Leading Companies
Table 4 Low Growth Scenario Forecasts
Table 5 Reference Case Growth Scenario
Table 6 High Growth Case Scenario
Table 7 Global Cheese Coagulants Revenue (USD Million) And CAGR (%) By Type (2021-2032)
Table 8 Global Cheese Coagulants Revenue (USD Million) And CAGR (%) By Application (2021-2032)
Table 9 Global Cheese Coagulants Revenue (USD Million) And CAGR (%) By Product (2021-2032)
Table 10 Global Cheese Coagulants Market Revenue (USD Million) By Regions (2021-2032)
Table 11 Global Cheese Coagulants Market Share (%) By Regions (2021-2032)
Table 12 North America Cheese Coagulants Revenue (USD Million) By Country (2021-2032)
Table 13 Europe Cheese Coagulants Revenue (USD Million) By Country (2021-2032)
Table 14 Asia Pacific Cheese Coagulants Revenue (USD Million) By Country (2021-2032)
Table 15 South America Cheese Coagulants Revenue (USD Million) By Country (2021-2032)
Table 16 Middle East and Africa Cheese Coagulants Revenue (USD Million) By Region (2021-2032)
Table 17 North America Cheese Coagulants Revenue (USD Million) By Type (2021-2032)
Table 18 North America Cheese Coagulants Revenue (USD Million) By Application (2021-2032)
Table 19 North America Cheese Coagulants Revenue (USD Million) By Product (2021-2032)
Table 20 Europe Cheese Coagulants Revenue (USD Million) By Type (2021-2032)
Table 21 Europe Cheese Coagulants Revenue (USD Million) By Application (2021-2032)
Table 22 Europe Cheese Coagulants Revenue (USD Million) By Product (2021-2032)
Table 23 Asia Pacific Cheese Coagulants Revenue (USD Million) By Type (2021-2032)
Table 24 Asia Pacific Cheese Coagulants Revenue (USD Million) By Application (2021-2032)
Table 25 Asia Pacific Cheese Coagulants Revenue (USD Million) By Product (2021-2032)
Table 26 South America Cheese Coagulants Revenue (USD Million) By Type (2021-2032)
Table 27 South America Cheese Coagulants Revenue (USD Million) By Application (2021-2032)
Table 28 South America Cheese Coagulants Revenue (USD Million) By Product (2021-2032)
Table 29 Middle East and Africa Cheese Coagulants Revenue (USD Million) By Type (2021-2032)
Table 30 Middle East and Africa Cheese Coagulants Revenue (USD Million) By Application (2021-2032)
Table 31 Middle East and Africa Cheese Coagulants Revenue (USD Million) By Product (2021-2032)
LIST OF FIGURES
Figure 1. Market Scope
Figure 2. Pricing Forecasts Per Unit, 2023- 2032
Figure 3. Porter’s Five Forces
Figure 4. Global Cheese Coagulants Market Revenue (USD Million) By Regions (2021-2032)
Figure 5. Global Cheese Coagulants Market Share (%) By Regions (2023)
Figure 6. North America Cheese Coagulants Revenue (USD Million) By Country (2021-2032)
Figure 7. United States Cheese Coagulants Revenue (USD Million) By Country (2021-2032)
Figure 8. Canada Cheese Coagulants Revenue (USD Million) By Country (2021-2032)
Figure 9. Mexico Cheese Coagulants Revenue (USD Million) By Country (2021-2032)
Figure 10. Europe Cheese Coagulants Revenue (USD Million) By Country (2021-2032)
Figure 11. Germany Cheese Coagulants Revenue (USD Million) By Country (2021-2032)
Figure 12. France Cheese Coagulants Revenue (USD Million) By Country (2021-2032)
Figure 13. United Kingdom Cheese Coagulants Revenue (USD Million) By Country (2021-2032)
Figure 14. Spain Cheese Coagulants Revenue (USD Million) By Country (2021-2032)
Figure 15. Italy Cheese Coagulants Revenue (USD Million) By Country (2021-2032)
Figure 16. Russia Cheese Coagulants Revenue (USD Million) By Country (2021-2032)
Figure 17. Rest of Europe Cheese Coagulants Revenue (USD Million) By Country (2021-2032)
Figure 11. Asia Pacific Cheese Coagulants Revenue (USD Million) By Country (2021-2032)
Figure 12. China Cheese Coagulants Revenue (USD Million) By Country (2021-2032)
Figure 13. Japan Cheese Coagulants Revenue (USD Million) By Country (2021-2032)
Figure 14. India Cheese Coagulants Revenue (USD Million) By Country (2021-2032)
Figure 15. South Korea Cheese Coagulants Revenue (USD Million) By Country (2021-2032)
Figure 16. Australia Cheese Coagulants Revenue (USD Million) By Country (2021-2032)
Figure 17. South East Asia Cheese Coagulants Revenue (USD Million) By Country (2021-2032)
Figure 18. South America Cheese Coagulants Revenue (USD Million) By Country (2021-2032)
Figure 19. Brazil Cheese Coagulants Revenue (USD Million) By Country (2021-2032)
Figure 20. Argentina Cheese Coagulants Revenue (USD Million) By Country (2021-2032)
Figure 21. Rest of Asia Pacific Cheese Coagulants Revenue (USD Million) By Country (2021-2032)
Figure 22. Middle East and Africa Cheese Coagulants Revenue (USD Million) By Region (2021-2032)
Figure 23. Saudi Arabia Cheese Coagulants Revenue (USD Million) By Region (2021-2032)
Figure 24. The UAE Cheese Coagulants Revenue (USD Million) By Region (2021-2032)
Figure 25. Rest of Middle East Cheese Coagulants Revenue (USD Million) By Region (2021-2032)
Figure 26. South Africa Cheese Coagulants Revenue (USD Million) By Region (2021-2032)
Figure 27. Africa Cheese Coagulants Revenue (USD Million) By Region (2021-2032)
Figure 28. North America Cheese Coagulants Revenue (USD Million) By Type (2021-2032)
Figure 29. North America Cheese Coagulants Revenue (USD Million) By Application (2021-2032)
Figure 30. North America Cheese Coagulants Revenue (USD Million) By Product (2021-2032)
Figure 31. Europe Cheese Coagulants Revenue (USD Million) By Type (2021-2032)
Figure 32. Europe Cheese Coagulants Revenue (USD Million) By Application (2021-2032)
Figure 33. Europe Cheese Coagulants Revenue (USD Million) By Product (2021-2032)
Figure 34. Asia Pacific Cheese Coagulants Revenue (USD Million) By Type (2021-2032)
Figure 35. Asia Pacific Cheese Coagulants Revenue (USD Million) By Application (2021-2032)
Figure 36. Asia Pacific Cheese Coagulants Revenue (USD Million) By Product (2021-2032)
Figure 37. South America Cheese Coagulants Revenue (USD Million) By Type (2021-2032)
Figure 38. South America Cheese Coagulants Revenue (USD Million) By Application (2021-2032)
Figure 39. South America Cheese Coagulants Revenue (USD Million) By Product (2021-2032)
Figure 40. Middle East and Africa Cheese Coagulants Revenue (USD Million) By Type (2021-2032)
Figure 41. Middle East and Africa Cheese Coagulants Revenue (USD Million) By Application (2021-2032)
Figure 42. Middle East and Africa Cheese Coagulants Revenue (USD Million) By Product (2021-2032)
By Form
Liquid
Powder
Tablet
By Type
Animal
Vegetable
Others
By Application
Commercial
Household
Others
Countries Analyzed
North America (US, Canada, Mexico)
Europe (Germany, UK, France, Spain, Italy, Russia, Rest of Europe)
Asia Pacific (China, India, Japan, South Korea, Australia, South East Asia, Rest of Asia)
South America (Brazil, Argentina, Rest of South America)
Middle East and Africa (Saudi Arabia, UAE, Rest of Middle East, South Africa, Egypt, Rest of Africa)
