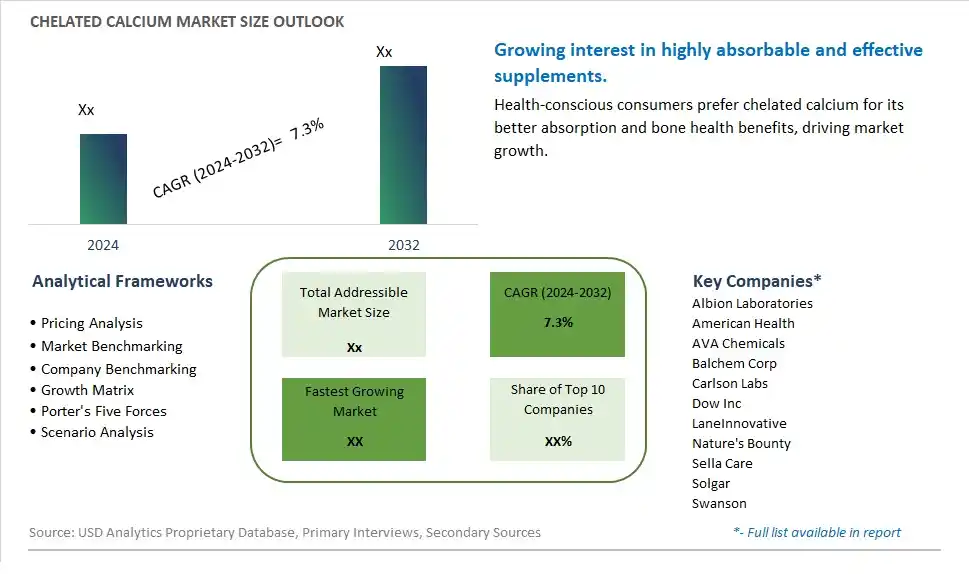
Global Chelated Calcium Market Size is valued at $XX Million in 2024 and is forecast to register a growth rate (CAGR) of 7.3% to reach $XX Million by 2032.
The global Chelated Calcium Market Comprehensive Study analyzes and forecasts the market size across 6 regions and 24 countries for diverse segments -By Type (Calcium Orotate, Calcium Aspartate, Calcium Lactate, Calcium Citrate, Calcium Malate, Calcium Gluconate), By Application (Seafood Products, Sauces, Dressings, Pickled Vegetables, Others)
An Introduction to Chelated Calcium Market
In 2024, the Chelated Calcium market is witnessing significant growth, driven by the increasing demand for effective and bioavailable calcium supplements. Chelated calcium, which involves calcium bound to amino acids, is valued for its enhanced absorption and utilization in the body. The market is supported by the growing awareness of the importance of calcium for bone health and the prevention of osteoporosis. Advances in chelation technology and supplement formulation are improving the efficacy, safety, and palatability of chelated calcium products. The market is also benefiting from the trend towards clean-label and scientifically backed supplements, appealing to health-conscious consumers seeking reliable and effective calcium sources.
Chelated Calcium Competitive Landscape
The market report analyses the leading companies in the industry including Albion Laboratories, American Health, AVA Chemicals, Balchem Corp, Carlson Labs, Dow Inc, LaneInnovative, Nature's Bounty, Sella Care, Solgar, Swanson, and Others.
Chelated Calcium Market Dynamics
Chelated Calcium Market Trend: Increasing Emphasis on Bone Health and Calcium Supplementation
A prominent market trend for chelated calcium is the increasing emphasis on bone health and calcium supplementation among consumers. With aging populations and rising awareness of osteoporosis and bone-related health issues, there's a growing demand for calcium-rich supplements that are easily absorbed and utilized by the body. Chelated calcium, known for its enhanced bioavailability and effectiveness compared to traditional calcium supplements, is gaining traction as a preferred choice for supporting bone strength and overall skeletal health.
Chelated Calcium Market Driver: Aging Population and Nutritional Wellness Concerns
A key driver fueling the market for chelated calcium is the aging population and the corresponding focus on nutritional wellness concerns. As individuals age, maintaining bone density and preventing bone-related conditions becomes a priority for many. Chelated calcium supplements address this driver by offering a form of calcium that is more readily absorbed by the body, ensuring optimal calcium intake for bone health support. Additionally, the growing interest in preventive healthcare and holistic approaches to wellness contributes to the demand for chelated calcium as a dietary supplement.
Chelated Calcium Market Opportunity: Innovation in Formulations and Targeted Health Benefits
An opportunity within the chelated calcium market lies in innovation, particularly in formulations and targeted health benefits. Manufacturers can develop chelated calcium supplements with added nutrients such as vitamin D, magnesium, and vitamin K2, which play synergistic roles in bone health and calcium metabolism. Furthermore, exploring targeted formulations for specific consumer demographics, such as seniors, athletes, or individuals with specific health conditions, presents opportunities for market segmentation and tailored health solutions. By focusing on innovation and addressing evolving consumer needs, companies can capitalize on the growing demand for chelated calcium supplements and establish a competitive edge in the nutritional supplements market.
Chelated Calcium Market Share Analysis: Calcium Citrate segment generated the highest revenue share in the industry
The Calcium Citrate segment emerges as the largest in the Chelated Calcium market by type. This segment's prominence is driven by several factors including its high bioavailability and effectiveness in dietary supplements. Calcium citrate is widely recognized for its superior absorption compared to other calcium forms, making it a preferred choice for individuals seeking to maintain bone health and manage calcium deficiencies. It is commonly used in dietary supplements due to its ability to dissolve easily in the stomach and be absorbed efficiently by the body, even when taken on an empty stomach. Further, calcium citrate is suitable for individuals with digestive issues or those who are sensitive to other forms of calcium. The segment's leadership is also supported by its versatility in food fortification applications, where it is added to various food and beverage products to enhance calcium content without affecting taste or texture significantly. As consumer awareness of bone health and nutritional supplements grows, coupled with an aging global population, the Calcium Citrate segment is expected to continue its dominance in the Chelated Calcium market, driven by ongoing research and product innovations aimed at improving calcium absorption and efficacy.
Chelated Calcium Market Share Analysis: Sauces and Dressings is the fastest growing segment over the forecast period to 2032
The Sauces and Dressings segment is anticipated to be the fastest growing in the Chelated Calcium market by application through 2032. This growth is driven by increasing consumer awareness of calcium fortification in everyday food products and the rising demand for healthier food options. Sauces and dressings enriched with chelated calcium offer manufacturers a way to enhance the nutritional profile of their products without compromising on taste or texture. Calcium-fortified sauces and dressings cater to health-conscious consumers looking to incorporate essential nutrients like calcium into their diets conveniently. Additionally, the segment benefits from the growing trend towards functional foods that support bone health and overall well-being. Manufacturers are leveraging chelated calcium's stability and bioavailability to develop innovative sauce and dressing formulations that appeal to a broader consumer base seeking nutritious and flavorful meal options. As dietary habits continue to evolve globally, driven by lifestyle changes and increasing health awareness, the Sauces and Dressings segment is poised for significant expansion in the Chelated Calcium market, contributing to the overall growth and diversification of calcium-fortified food products.
Chelated Calcium Market Segmentation
By Type
Calcium Orotate
Calcium Aspartate
Calcium Lactate
Calcium Citrate
Calcium Malate
Calcium Gluconate
By Application
Seafood Products
Sauces
Dressings
Pickled Vegetables
Others
Countries Analyzed
North America (US, Canada, Mexico)
Europe (Germany, UK, France, Spain, Italy, Russia, Rest of Europe)
Asia Pacific (China, India, Japan, South Korea, Australia, South East Asia, Rest of Asia)
South America (Brazil, Argentina, Rest of South America)
Middle East and Africa (Saudi Arabia, UAE, Rest of Middle East, South Africa, Egypt, Rest of Africa)
Chelated Calcium Companies Profiled in the Study
Albion Laboratories
American Health
AVA Chemicals
Balchem Corp
Carlson Labs
Dow Inc
LaneInnovative
Nature's Bounty
Sella Care
Solgar
Swanson
*- List Not Exhaustive
Chapter 1. TABLE OF CONTENTS
Chapter 2. Introduction to Chelated Calcium Market
2.1. Market Overview
2.2. Key Statistics and Report Highlights
2.3. Scope of the Comprehensive Study
2.3.1. Market Definition
2.3.2 Countries and Regions Covered
2.3.3 Research Objective
2.3.4 Units, Currency, and Conversions
2.3.5 Industry Value Chain
2.4. Key Market Segments
2.5. Key Companies
2.6. Study Period
Chapter 3. Strategic Analysis Review
3.1. Chelated Calcium Pricing Analysis and Forecast
3.2. Porter’s Five Forces
3.3. Market Ecosystem
3.4. SWOT Analysis
3.5. Regulatory Scenario
3.3. Effects of Inflation, Russia-Ukraine War, moderating economic growth, and other macroeconomic factors
Chapter 4. Competitive Landscape
4.1. Market Share Analysis
4.1.1. Global Chelated Calcium Market Share by Company, 2023
4.1.2. Product Offerings of Leading Chelated Calcium Companies
4.2. Market Entropy
4.2.1. New Product Launches in the Industry
4.2.2. Mergers, Acquisitions, Joint ventures, and Partnerships
4.3. Key Strategies and Best Practices
Chapter 5. Global Market Projections: Best, Reference, and Low Case Scenarios
5.1. Growth Analysis- Case Scenario Definitions
5.2. Low Growth Case Scenario Forecasts
5.3. Reference Growth Case Scenario Forecasts
5.4. High Growth Case Scenario Forecasts
Chapter 6. Market Dynamics
6.1. Chelated Calcium Market Drivers
6.2. Chelated Calcium Market Challenges
6.6. Chelated Calcium Market Opportunities
6.4. Chelated Calcium Market Trends
Chapter 7. Global Chelated Calcium Market Outlook Trends
7.1. Global Chelated Calcium Revenue (USD Million) and CAGR (%) by Type (2021-2032)
7.2. Global Chelated Calcium Revenue (USD Million) and CAGR (%) by Application (2021-2032)
7.3. Global Chelated Calcium Revenue (USD Million) and CAGR (%) by Product (2021-2032)
By Type
Calcium Orotate
Calcium Aspartate
Calcium Lactate
Calcium Citrate
Calcium Malate
Calcium Gluconate
By Application
Seafood Products
Sauces
Dressings
Pickled Vegetables
Others
Chapter 8. Global Chelated Calcium Regional Analysis and Outlook
8.1. Global Chelated Calcium Revenue (USD Million) By Regions (2021- 2032)
8.2. North America Chelated Calcium Revenue (USD Million) by Country (2021-2032)
8.2.1. United States Chelated Calcium Regional Analysis and Outlook
8.2.2. Canada Chelated Calcium Regional Analysis and Outlook
8.2.3. Mexico Chelated Calcium Regional Analysis and Outlook
8.3. Europe Chelated Calcium Revenue (USD Million), by Country (2021-2032)
8.3.1. Germany Chelated Calcium Regional Analysis and Outlook
8.3.2. France Chelated Calcium Regional Analysis and Outlook
8.3.3. United Kingdom Chelated Calcium Regional Analysis and Outlook
8.3.4. Spain Chelated Calcium Regional Analysis and Outlook
8.3.5. Italy Chelated Calcium Regional Analysis and Outlook
8.3.6. Russia Chelated Calcium Regional Analysis and Outlook
8.3.7. Rest of Europe Chelated Calcium Regional Analysis and Outlook
8.4. Asia Pacific Chelated Calcium Revenue (USD Million) by Country (2021-2032)
8.4.1. China Chelated Calcium Regional Analysis and Outlook
8.4.2. Japan Chelated Calcium Regional Analysis and Outlook
8.4.3. India Chelated Calcium Regional Analysis and Outlook
8.4.4. South Korea Chelated Calcium Regional Analysis and Outlook
8.4.5. Australia Chelated Calcium Regional Analysis and Outlook
8.4.6. South East Asia Chelated Calcium Regional Analysis and Outlook
8.4.7. Rest of Asia Pacific Chelated Calcium Regional Analysis and Outlook
8.5. South America Chelated Calcium Revenue (USD Million), by Country (2021-2032)
8.5.1. Brazil Chelated Calcium Regional Analysis and Outlook
8.5.2. Argentina Chelated Calcium Regional Analysis and Outlook
8.5.3. Rest of South America Chelated Calcium Regional Analysis and Outlook
8.6. Middle East and Africa Chelated Calcium Revenue (USD Million) by Country (2021-2032)
8.6.1. Middle East Chelated Calcium Regional Analysis and Outlook
8.6.2. Africa Chelated Calcium Regional Analysis and Outlook
Chapter 9. North America Chelated Calcium Analysis and Outlook
9.1. North America Chelated Calcium Revenue (USD Million) by Segments (2021-2032)
9.1.1. North America Chelated Calcium Revenue (USD Million) by Type (2021-2032)
9.1.2. North America Chelated Calcium Revenue (USD Million) by Application (2021-2032)
9.1.3. North America Chelated Calcium Revenue (USD Million) by Product (2021-2032)
By Type
Calcium Orotate
Calcium Aspartate
Calcium Lactate
Calcium Citrate
Calcium Malate
Calcium Gluconate
By Application
Seafood Products
Sauces
Dressings
Pickled Vegetables
Others
Chapter 10. Europe Chelated Calcium Analysis and Outlook
10.1. Europe Chelated Calcium Revenue (USD Million), by Segments (USD Million) (2021-2032)
10.1.1. Europe Chelated Calcium Revenue (USD Million) by Type (2021-2032)
10.1.2. Europe Chelated Calcium Revenue (USD Million) by Application (2021-2032)
10.1.3. Europe Chelated Calcium Revenue (USD Million) by Product (2021-2032)
By Type
Calcium Orotate
Calcium Aspartate
Calcium Lactate
Calcium Citrate
Calcium Malate
Calcium Gluconate
By Application
Seafood Products
Sauces
Dressings
Pickled Vegetables
Others
Chapter 11. Asia Pacific Chelated Calcium Analysis and Outlook
11.1. Asia Pacific Chelated Calcium Revenue (USD Million), and Revenue (USD Million) by Segments (2021-2032)
11.1.1. Asia Pacific Chelated Calcium Revenue (USD Million) by Type (2021-2032)
11.1.2. Asia Pacific Chelated Calcium Revenue (USD Million) by Application (2021-2032)
11.1.3. Asia Pacific Chelated Calcium Revenue (USD Million) by Product (2021-2032)
By Type
Calcium Orotate
Calcium Aspartate
Calcium Lactate
Calcium Citrate
Calcium Malate
Calcium Gluconate
By Application
Seafood Products
Sauces
Dressings
Pickled Vegetables
Others
Chapter 12. South America Chelated Calcium Analysis and Outlook
12.1. South America Chelated Calcium Revenue (USD Million), by Segments (2021-2032)
12.1.1. South America Chelated Calcium Revenue (USD Million) by Type (2021-2032)
12.1.2. South America Chelated Calcium Revenue (USD Million) by Application (2021-2032)
12.1.3. South America Chelated Calcium Revenue (USD Million) by Product (2021-2032)
By Type
Calcium Orotate
Calcium Aspartate
Calcium Lactate
Calcium Citrate
Calcium Malate
Calcium Gluconate
By Application
Seafood Products
Sauces
Dressings
Pickled Vegetables
Others
Chapter 13. Middle East and Africa Chelated Calcium Analysis and Outlook
13.1. Middle East and Africa Chelated Calcium Revenue (USD Million), by Segments (2021-2032)
13.1.1. Middle East and Africa Chelated Calcium Revenue (USD Million) by Type (2021-2032)
13.1.2. Middle East and Africa Chelated Calcium Revenue (USD Million) by Application (2021-2032)
13.1.3. Middle East and Africa Chelated Calcium Revenue (USD Million) by Product (2021-2032)
By Type
Calcium Orotate
Calcium Aspartate
Calcium Lactate
Calcium Citrate
Calcium Malate
Calcium Gluconate
By Application
Seafood Products
Sauces
Dressings
Pickled Vegetables
Others
Chapter 14. Chelated Calcium Company Profiles
14.1 Business Overview
14.2 Product Profiles
14.3 SWOT Profiles
14.5 Recent Developments
14.6 Financial Profile
List of Companies
Albion Laboratories
American Health
AVA Chemicals
Balchem Corp
Carlson Labs
Dow Inc
LaneInnovative
Nature's Bounty
Sella Care
Solgar
Swanson
15. Methodology and Data Sources
15.1 Customization Offerings
15.2 Subscription Services
15.3 Related Reports
15.4 Publisher Expertise
LIST OF TABLES
Table 1 Market Segmentation Analysis
Table 2 Global Chelated Calcium Market Share of Leading Companies, 2023
Table 3 Product Offerings of Leading Companies
Table 4 Low Growth Scenario Forecasts
Table 5 Reference Case Growth Scenario
Table 6 High Growth Case Scenario
Table 7 Global Chelated Calcium Revenue (USD Million) And CAGR (%) By Type (2021-2032)
Table 8 Global Chelated Calcium Revenue (USD Million) And CAGR (%) By Application (2021-2032)
Table 9 Global Chelated Calcium Revenue (USD Million) And CAGR (%) By Product (2021-2032)
Table 10 Global Chelated Calcium Market Revenue (USD Million) By Regions (2021-2032)
Table 11 Global Chelated Calcium Market Share (%) By Regions (2021-2032)
Table 12 North America Chelated Calcium Revenue (USD Million) By Country (2021-2032)
Table 13 Europe Chelated Calcium Revenue (USD Million) By Country (2021-2032)
Table 14 Asia Pacific Chelated Calcium Revenue (USD Million) By Country (2021-2032)
Table 15 South America Chelated Calcium Revenue (USD Million) By Country (2021-2032)
Table 16 Middle East and Africa Chelated Calcium Revenue (USD Million) By Region (2021-2032)
Table 17 North America Chelated Calcium Revenue (USD Million) By Type (2021-2032)
Table 18 North America Chelated Calcium Revenue (USD Million) By Application (2021-2032)
Table 19 North America Chelated Calcium Revenue (USD Million) By Product (2021-2032)
Table 20 Europe Chelated Calcium Revenue (USD Million) By Type (2021-2032)
Table 21 Europe Chelated Calcium Revenue (USD Million) By Application (2021-2032)
Table 22 Europe Chelated Calcium Revenue (USD Million) By Product (2021-2032)
Table 23 Asia Pacific Chelated Calcium Revenue (USD Million) By Type (2021-2032)
Table 24 Asia Pacific Chelated Calcium Revenue (USD Million) By Application (2021-2032)
Table 25 Asia Pacific Chelated Calcium Revenue (USD Million) By Product (2021-2032)
Table 26 South America Chelated Calcium Revenue (USD Million) By Type (2021-2032)
Table 27 South America Chelated Calcium Revenue (USD Million) By Application (2021-2032)
Table 28 South America Chelated Calcium Revenue (USD Million) By Product (2021-2032)
Table 29 Middle East and Africa Chelated Calcium Revenue (USD Million) By Type (2021-2032)
Table 30 Middle East and Africa Chelated Calcium Revenue (USD Million) By Application (2021-2032)
Table 31 Middle East and Africa Chelated Calcium Revenue (USD Million) By Product (2021-2032)
LIST OF FIGURES
Figure 1. Market Scope
Figure 2. Pricing Forecasts Per Unit, 2023- 2032
Figure 3. Porter’s Five Forces
Figure 4. Global Chelated Calcium Market Revenue (USD Million) By Regions (2021-2032)
Figure 5. Global Chelated Calcium Market Share (%) By Regions (2023)
Figure 6. North America Chelated Calcium Revenue (USD Million) By Country (2021-2032)
Figure 7. United States Chelated Calcium Revenue (USD Million) By Country (2021-2032)
Figure 8. Canada Chelated Calcium Revenue (USD Million) By Country (2021-2032)
Figure 9. Mexico Chelated Calcium Revenue (USD Million) By Country (2021-2032)
Figure 10. Europe Chelated Calcium Revenue (USD Million) By Country (2021-2032)
Figure 11. Germany Chelated Calcium Revenue (USD Million) By Country (2021-2032)
Figure 12. France Chelated Calcium Revenue (USD Million) By Country (2021-2032)
Figure 13. United Kingdom Chelated Calcium Revenue (USD Million) By Country (2021-2032)
Figure 14. Spain Chelated Calcium Revenue (USD Million) By Country (2021-2032)
Figure 15. Italy Chelated Calcium Revenue (USD Million) By Country (2021-2032)
Figure 16. Russia Chelated Calcium Revenue (USD Million) By Country (2021-2032)
Figure 17. Rest of Europe Chelated Calcium Revenue (USD Million) By Country (2021-2032)
Figure 11. Asia Pacific Chelated Calcium Revenue (USD Million) By Country (2021-2032)
Figure 12. China Chelated Calcium Revenue (USD Million) By Country (2021-2032)
Figure 13. Japan Chelated Calcium Revenue (USD Million) By Country (2021-2032)
Figure 14. India Chelated Calcium Revenue (USD Million) By Country (2021-2032)
Figure 15. South Korea Chelated Calcium Revenue (USD Million) By Country (2021-2032)
Figure 16. Australia Chelated Calcium Revenue (USD Million) By Country (2021-2032)
Figure 17. South East Asia Chelated Calcium Revenue (USD Million) By Country (2021-2032)
Figure 18. South America Chelated Calcium Revenue (USD Million) By Country (2021-2032)
Figure 19. Brazil Chelated Calcium Revenue (USD Million) By Country (2021-2032)
Figure 20. Argentina Chelated Calcium Revenue (USD Million) By Country (2021-2032)
Figure 21. Rest of Asia Pacific Chelated Calcium Revenue (USD Million) By Country (2021-2032)
Figure 22. Middle East and Africa Chelated Calcium Revenue (USD Million) By Region (2021-2032)
Figure 23. Saudi Arabia Chelated Calcium Revenue (USD Million) By Region (2021-2032)
Figure 24. The UAE Chelated Calcium Revenue (USD Million) By Region (2021-2032)
Figure 25. Rest of Middle East Chelated Calcium Revenue (USD Million) By Region (2021-2032)
Figure 26. South Africa Chelated Calcium Revenue (USD Million) By Region (2021-2032)
Figure 27. Africa Chelated Calcium Revenue (USD Million) By Region (2021-2032)
Figure 28. North America Chelated Calcium Revenue (USD Million) By Type (2021-2032)
Figure 29. North America Chelated Calcium Revenue (USD Million) By Application (2021-2032)
Figure 30. North America Chelated Calcium Revenue (USD Million) By Product (2021-2032)
Figure 31. Europe Chelated Calcium Revenue (USD Million) By Type (2021-2032)
Figure 32. Europe Chelated Calcium Revenue (USD Million) By Application (2021-2032)
Figure 33. Europe Chelated Calcium Revenue (USD Million) By Product (2021-2032)
Figure 34. Asia Pacific Chelated Calcium Revenue (USD Million) By Type (2021-2032)
Figure 35. Asia Pacific Chelated Calcium Revenue (USD Million) By Application (2021-2032)
Figure 36. Asia Pacific Chelated Calcium Revenue (USD Million) By Product (2021-2032)
Figure 37. South America Chelated Calcium Revenue (USD Million) By Type (2021-2032)
Figure 38. South America Chelated Calcium Revenue (USD Million) By Application (2021-2032)
Figure 39. South America Chelated Calcium Revenue (USD Million) By Product (2021-2032)
Figure 40. Middle East and Africa Chelated Calcium Revenue (USD Million) By Type (2021-2032)
Figure 41. Middle East and Africa Chelated Calcium Revenue (USD Million) By Application (2021-2032)
Figure 42. Middle East and Africa Chelated Calcium Revenue (USD Million) By Product (2021-2032)
By Type
Calcium Orotate
Calcium Aspartate
Calcium Lactate
Calcium Citrate
Calcium Malate
Calcium Gluconate
By Application
Seafood Products
Sauces
Dressings
Pickled Vegetables
Others
Countries Analyzed
North America (US, Canada, Mexico)
Europe (Germany, UK, France, Spain, Italy, Russia, Rest of Europe)
Asia Pacific (China, India, Japan, South Korea, Australia, South East Asia, Rest of Asia)
South America (Brazil, Argentina, Rest of South America)
Middle East and Africa (Saudi Arabia, UAE, Rest of Middle East, South Africa, Egypt, Rest of Africa)
