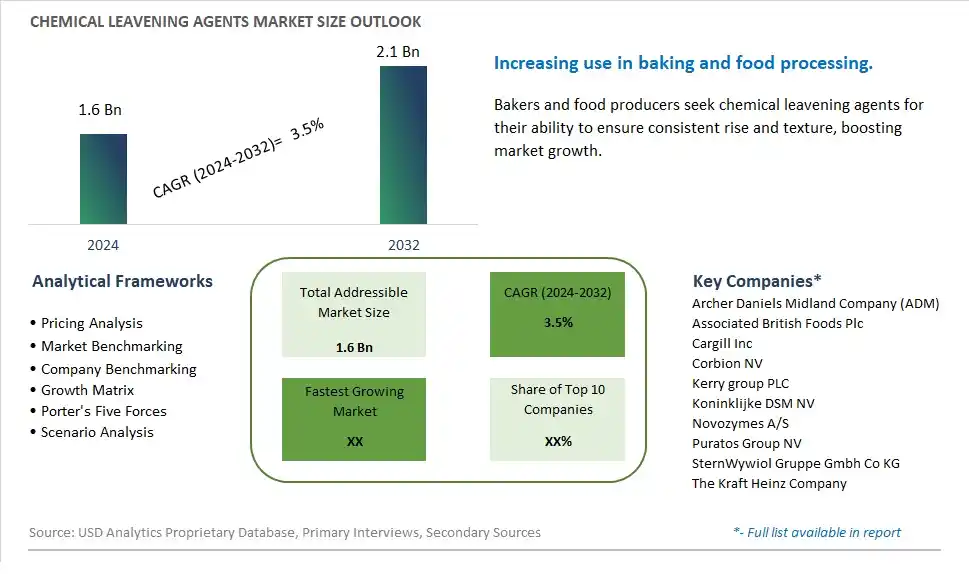
Global Chemical Leavening Agents Market Size is valued at $1.6 Billion in 2024 and is forecast to register a growth rate (CAGR) of 3.5% to reach $2.1 Billion by 2032.
The global Chemical Leavening Agents Market Comprehensive Study analyzes and forecasts the market size across 6 regions and 24 countries for diverse segments -By Type (Organic, Regular), By Application (Bakery, Confectionery, Savory Biscuits & Crackers, Food Products, Others)
An Introduction to Chemical Leavening Agents Market
The Chemical Leavening Agents market in 2024 is expanding steadily, driven by the increasing demand for reliable and efficient leavening solutions in the baking industry. Chemical leavening agents, including baking powder and baking soda, are essential for achieving the desired rise and texture in baked goods. The market is supported by the growing trend towards home baking and the demand for consistent and high-quality baking ingredients. Advances in formulation and production technologies are enhancing the effectiveness, stability, and safety of chemical leavening agents. The market is also benefiting from the trend towards clean-label and natural baking ingredients, appealing to consumers seeking high-quality and reliable leavening solutions.
Chemical Leavening Agents Competitive Landscape
The market report analyses the leading companies in the industry including Archer Daniels Midland Company (ADM), Associated British Foods Plc, Cargill Inc, Corbion NV, Kerry group PLC, Koninklijke DSM NV, Novozymes A/S, Puratos Group NV, SternWywiol Gruppe Gmbh Co KG, The Kraft Heinz Company, and Others.
Chemical Leavening Agents Market Dynamics
Chemical Leavening Agents Market Trend: Demand for Clean Label and Natural Food Ingredients
A prominent market trend for chemical leavening agents is the increasing demand for clean label and natural food ingredients among consumers. With growing awareness of food additives and their potential health implications, there's a preference for leavening agents derived from natural sources or those with clean label credentials. Chemical leavening agents that are perceived as natural, organic, or free from artificial additives are gaining popularity as consumers seek transparency and healthier options in their food choices.
Chemical Leavening Agents Market Driver: Rise in Bakery and Convenience Food Consumption
A key driver fueling the market for chemical leavening agents is the rise in bakery and convenience food consumption worldwide. As busy lifestyles and on-the-go eating habits become prevalent, there's a demand for ready-to-eat baked goods, snacks, and convenience foods that maintain quality, taste, and texture. Chemical leavening agents play a crucial role in achieving desirable volume, texture, and crumb structure in baked products, driving their usage and adoption by food manufacturers across the bakery and snack industry.
Chemical Leavening Agents Market Opportunity: Innovation in Clean Label Formulations and Functional Properties
An opportunity within the chemical leavening agents market lies in innovation, particularly in clean label formulations and functional properties. Manufacturers can develop chemical leavening agents that meet clean label criteria while delivering excellent leavening performance, shelf stability, and product consistency. Additionally, exploring novel ingredients or combinations that offer unique functional benefits, such as extended shelf life, reduced sodium content, or improved texture enhancement, presents opportunities for differentiation and value creation. By focusing on innovation and addressing consumer preferences for clean label products with enhanced functionality, companies can capitalize on the growing market for chemical leavening agents and strengthen their position in the baking and convenience food sectors.
Chemical Leavening Agents Market Share Analysis: Regular segment generated the highest revenue share in the industry
The Regular segment stands out as the largest in the Chemical Leavening Agents market by type. This segment's dominance is driven by its widespread use in various food applications, ranging from baked goods to snacks and confectionery items. Regular chemical leavening agents include baking soda (sodium bicarbonate) combined with acidic compounds such as cream of tartar or monocalcium phosphate. These agents react with moisture and heat during baking, releasing carbon dioxide gas that causes doughs and batters to rise, resulting in light and airy textures in finished products. The Regular segment benefits from its long-established presence in the food industry, providing consistent leavening performance and enhancing product volume and texture. Manufacturers and bakers prefer regular chemical leavening agents for their reliability, affordability, and versatility across a wide range of recipes and production scales. Further, the segment's leadership is reinforced by ongoing innovations in ingredient formulations and processing technologies that optimize leavening efficiency while meeting consumer demand for high-quality, shelf-stable baked goods and snacks. As consumer preferences for convenience and indulgence drive the demand for bakery products globally, the Regular segment is expected to maintain its leading position in the Chemical Leavening Agents market, contributing to the overall growth and innovation in the baking industry.
Chemical Leavening Agents Market Share Analysis: Confectionery is the fastest growing segment over the forecast period to 2032
The Confectionery segment is projected to be the fastest growing in the Chemical Leavening Agents market by application through 2032. This growth is driven by the increasing consumption of baked confectionery products globally, including cakes, cookies, pastries, and other sweet treats. Chemical leavening agents play a crucial role in confectionery production by providing the necessary rise and texture to baked goods, ensuring light and fluffy results that appeal to consumer preferences for indulgent and flavorful treats. The Confectionery segment benefits from the rising demand for convenient and ready-to-eat bakery products, fueled by urbanization, changing lifestyles, and growing disposable incomes. Manufacturers in the confectionery industry are innovating with new product formulations and flavors while leveraging advanced leavening technologies to meet consumer expectations for freshness, taste, and texture. Additionally, the segment's growth is supported by expanding distribution channels and marketing strategies that promote premium and artisanal confectionery items globally. As consumer interest in gourmet and specialty confections continues to grow, driven by evolving taste preferences and gifting trends, the Confectionery segment is poised for significant expansion in the Chemical Leavening Agents market, contributing to the overall dynamism and innovation in the bakery and confectionery sectors.
Chemical Leavening Agents Market Segmentation
By Type
Organic
Regular
By Application
Bakery
Confectionery
Savory Biscuits & Crackers
Food Products
Others
Countries Analyzed
North America (US, Canada, Mexico)
Europe (Germany, UK, France, Spain, Italy, Russia, Rest of Europe)
Asia Pacific (China, India, Japan, South Korea, Australia, South East Asia, Rest of Asia)
South America (Brazil, Argentina, Rest of South America)
Middle East and Africa (Saudi Arabia, UAE, Rest of Middle East, South Africa, Egypt, Rest of Africa)
Chemical Leavening Agents Companies Profiled in the Study
Archer Daniels Midland Company (ADM)
Associated British Foods Plc
Cargill Inc
Corbion NV
Kerry group PLC
Koninklijke DSM NV
Novozymes A/S
Puratos Group NV
SternWywiol Gruppe Gmbh Co KG
The Kraft Heinz Company
*- List Not Exhaustive
Chapter 1. TABLE OF CONTENTS
Chapter 2. Introduction to Chemical Leavening Agents Market
2.1. Market Overview
2.2. Key Statistics and Report Highlights
2.3. Scope of the Comprehensive Study
2.3.1. Market Definition
2.3.2 Countries and Regions Covered
2.3.3 Research Objective
2.3.4 Units, Currency, and Conversions
2.3.5 Industry Value Chain
2.4. Key Market Segments
2.5. Key Companies
2.6. Study Period
Chapter 3. Strategic Analysis Review
3.1. Chemical Leavening Agents Pricing Analysis and Forecast
3.2. Porter’s Five Forces
3.3. Market Ecosystem
3.4. SWOT Analysis
3.5. Regulatory Scenario
3.3. Effects of Inflation, Russia-Ukraine War, moderating economic growth, and other macroeconomic factors
Chapter 4. Competitive Landscape
4.1. Market Share Analysis
4.1.1. Global Chemical Leavening Agents Market Share by Company, 2023
4.1.2. Product Offerings of Leading Chemical Leavening Agents Companies
4.2. Market Entropy
4.2.1. New Product Launches in the Industry
4.2.2. Mergers, Acquisitions, Joint ventures, and Partnerships
4.3. Key Strategies and Best Practices
Chapter 5. Global Market Projections: Best, Reference, and Low Case Scenarios
5.1. Growth Analysis- Case Scenario Definitions
5.2. Low Growth Case Scenario Forecasts
5.3. Reference Growth Case Scenario Forecasts
5.4. High Growth Case Scenario Forecasts
Chapter 6. Market Dynamics
6.1. Chemical Leavening Agents Market Drivers
6.2. Chemical Leavening Agents Market Challenges
6.6. Chemical Leavening Agents Market Opportunities
6.4. Chemical Leavening Agents Market Trends
Chapter 7. Global Chemical Leavening Agents Market Outlook Trends
7.1. Global Chemical Leavening Agents Revenue (USD Million) and CAGR (%) by Type (2021-2032)
7.2. Global Chemical Leavening Agents Revenue (USD Million) and CAGR (%) by Application (2021-2032)
7.3. Global Chemical Leavening Agents Revenue (USD Million) and CAGR (%) by Product (2021-2032)
By Type
Organic
Regular
By Application
Bakery
Confectionery
Savory Biscuits & Crackers
Food Products
Others
Chapter 8. Global Chemical Leavening Agents Regional Analysis and Outlook
8.1. Global Chemical Leavening Agents Revenue (USD Million) By Regions (2021- 2032)
8.2. North America Chemical Leavening Agents Revenue (USD Million) by Country (2021-2032)
8.2.1. United States Chemical Leavening Agents Regional Analysis and Outlook
8.2.2. Canada Chemical Leavening Agents Regional Analysis and Outlook
8.2.3. Mexico Chemical Leavening Agents Regional Analysis and Outlook
8.3. Europe Chemical Leavening Agents Revenue (USD Million), by Country (2021-2032)
8.3.1. Germany Chemical Leavening Agents Regional Analysis and Outlook
8.3.2. France Chemical Leavening Agents Regional Analysis and Outlook
8.3.3. United Kingdom Chemical Leavening Agents Regional Analysis and Outlook
8.3.4. Spain Chemical Leavening Agents Regional Analysis and Outlook
8.3.5. Italy Chemical Leavening Agents Regional Analysis and Outlook
8.3.6. Russia Chemical Leavening Agents Regional Analysis and Outlook
8.3.7. Rest of Europe Chemical Leavening Agents Regional Analysis and Outlook
8.4. Asia Pacific Chemical Leavening Agents Revenue (USD Million) by Country (2021-2032)
8.4.1. China Chemical Leavening Agents Regional Analysis and Outlook
8.4.2. Japan Chemical Leavening Agents Regional Analysis and Outlook
8.4.3. India Chemical Leavening Agents Regional Analysis and Outlook
8.4.4. South Korea Chemical Leavening Agents Regional Analysis and Outlook
8.4.5. Australia Chemical Leavening Agents Regional Analysis and Outlook
8.4.6. South East Asia Chemical Leavening Agents Regional Analysis and Outlook
8.4.7. Rest of Asia Pacific Chemical Leavening Agents Regional Analysis and Outlook
8.5. South America Chemical Leavening Agents Revenue (USD Million), by Country (2021-2032)
8.5.1. Brazil Chemical Leavening Agents Regional Analysis and Outlook
8.5.2. Argentina Chemical Leavening Agents Regional Analysis and Outlook
8.5.3. Rest of South America Chemical Leavening Agents Regional Analysis and Outlook
8.6. Middle East and Africa Chemical Leavening Agents Revenue (USD Million) by Country (2021-2032)
8.6.1. Middle East Chemical Leavening Agents Regional Analysis and Outlook
8.6.2. Africa Chemical Leavening Agents Regional Analysis and Outlook
Chapter 9. North America Chemical Leavening Agents Analysis and Outlook
9.1. North America Chemical Leavening Agents Revenue (USD Million) by Segments (2021-2032)
9.1.1. North America Chemical Leavening Agents Revenue (USD Million) by Type (2021-2032)
9.1.2. North America Chemical Leavening Agents Revenue (USD Million) by Application (2021-2032)
9.1.3. North America Chemical Leavening Agents Revenue (USD Million) by Product (2021-2032)
By Type
Organic
Regular
By Application
Bakery
Confectionery
Savory Biscuits & Crackers
Food Products
Others
Chapter 10. Europe Chemical Leavening Agents Analysis and Outlook
10.1. Europe Chemical Leavening Agents Revenue (USD Million), by Segments (USD Million) (2021-2032)
10.1.1. Europe Chemical Leavening Agents Revenue (USD Million) by Type (2021-2032)
10.1.2. Europe Chemical Leavening Agents Revenue (USD Million) by Application (2021-2032)
10.1.3. Europe Chemical Leavening Agents Revenue (USD Million) by Product (2021-2032)
By Type
Organic
Regular
By Application
Bakery
Confectionery
Savory Biscuits & Crackers
Food Products
Others
Chapter 11. Asia Pacific Chemical Leavening Agents Analysis and Outlook
11.1. Asia Pacific Chemical Leavening Agents Revenue (USD Million), and Revenue (USD Million) by Segments (2021-2032)
11.1.1. Asia Pacific Chemical Leavening Agents Revenue (USD Million) by Type (2021-2032)
11.1.2. Asia Pacific Chemical Leavening Agents Revenue (USD Million) by Application (2021-2032)
11.1.3. Asia Pacific Chemical Leavening Agents Revenue (USD Million) by Product (2021-2032)
By Type
Organic
Regular
By Application
Bakery
Confectionery
Savory Biscuits & Crackers
Food Products
Others
Chapter 12. South America Chemical Leavening Agents Analysis and Outlook
12.1. South America Chemical Leavening Agents Revenue (USD Million), by Segments (2021-2032)
12.1.1. South America Chemical Leavening Agents Revenue (USD Million) by Type (2021-2032)
12.1.2. South America Chemical Leavening Agents Revenue (USD Million) by Application (2021-2032)
12.1.3. South America Chemical Leavening Agents Revenue (USD Million) by Product (2021-2032)
By Type
Organic
Regular
By Application
Bakery
Confectionery
Savory Biscuits & Crackers
Food Products
Others
Chapter 13. Middle East and Africa Chemical Leavening Agents Analysis and Outlook
13.1. Middle East and Africa Chemical Leavening Agents Revenue (USD Million), by Segments (2021-2032)
13.1.1. Middle East and Africa Chemical Leavening Agents Revenue (USD Million) by Type (2021-2032)
13.1.2. Middle East and Africa Chemical Leavening Agents Revenue (USD Million) by Application (2021-2032)
13.1.3. Middle East and Africa Chemical Leavening Agents Revenue (USD Million) by Product (2021-2032)
By Type
Organic
Regular
By Application
Bakery
Confectionery
Savory Biscuits & Crackers
Food Products
Others
Chapter 14. Chemical Leavening Agents Company Profiles
14.1 Business Overview
14.2 Product Profiles
14.3 SWOT Profiles
14.5 Recent Developments
14.6 Financial Profile
List of Companies
Archer Daniels Midland Company (ADM)
Associated British Foods Plc
Cargill Inc
Corbion NV
Kerry group PLC
Koninklijke DSM NV
Novozymes A/S
Puratos Group NV
SternWywiol Gruppe Gmbh Co KG
The Kraft Heinz Company
15. Methodology and Data Sources
15.1 Customization Offerings
15.2 Subscription Services
15.3 Related Reports
15.4 Publisher Expertise
LIST OF TABLES
Table 1 Market Segmentation Analysis
Table 2 Global Chemical Leavening Agents Market Share of Leading Companies, 2023
Table 3 Product Offerings of Leading Companies
Table 4 Low Growth Scenario Forecasts
Table 5 Reference Case Growth Scenario
Table 6 High Growth Case Scenario
Table 7 Global Chemical Leavening Agents Revenue (USD Million) And CAGR (%) By Type (2021-2032)
Table 8 Global Chemical Leavening Agents Revenue (USD Million) And CAGR (%) By Application (2021-2032)
Table 9 Global Chemical Leavening Agents Revenue (USD Million) And CAGR (%) By Product (2021-2032)
Table 10 Global Chemical Leavening Agents Market Revenue (USD Million) By Regions (2021-2032)
Table 11 Global Chemical Leavening Agents Market Share (%) By Regions (2021-2032)
Table 12 North America Chemical Leavening Agents Revenue (USD Million) By Country (2021-2032)
Table 13 Europe Chemical Leavening Agents Revenue (USD Million) By Country (2021-2032)
Table 14 Asia Pacific Chemical Leavening Agents Revenue (USD Million) By Country (2021-2032)
Table 15 South America Chemical Leavening Agents Revenue (USD Million) By Country (2021-2032)
Table 16 Middle East and Africa Chemical Leavening Agents Revenue (USD Million) By Region (2021-2032)
Table 17 North America Chemical Leavening Agents Revenue (USD Million) By Type (2021-2032)
Table 18 North America Chemical Leavening Agents Revenue (USD Million) By Application (2021-2032)
Table 19 North America Chemical Leavening Agents Revenue (USD Million) By Product (2021-2032)
Table 20 Europe Chemical Leavening Agents Revenue (USD Million) By Type (2021-2032)
Table 21 Europe Chemical Leavening Agents Revenue (USD Million) By Application (2021-2032)
Table 22 Europe Chemical Leavening Agents Revenue (USD Million) By Product (2021-2032)
Table 23 Asia Pacific Chemical Leavening Agents Revenue (USD Million) By Type (2021-2032)
Table 24 Asia Pacific Chemical Leavening Agents Revenue (USD Million) By Application (2021-2032)
Table 25 Asia Pacific Chemical Leavening Agents Revenue (USD Million) By Product (2021-2032)
Table 26 South America Chemical Leavening Agents Revenue (USD Million) By Type (2021-2032)
Table 27 South America Chemical Leavening Agents Revenue (USD Million) By Application (2021-2032)
Table 28 South America Chemical Leavening Agents Revenue (USD Million) By Product (2021-2032)
Table 29 Middle East and Africa Chemical Leavening Agents Revenue (USD Million) By Type (2021-2032)
Table 30 Middle East and Africa Chemical Leavening Agents Revenue (USD Million) By Application (2021-2032)
Table 31 Middle East and Africa Chemical Leavening Agents Revenue (USD Million) By Product (2021-2032)
LIST OF FIGURES
Figure 1. Market Scope
Figure 2. Pricing Forecasts Per Unit, 2023- 2032
Figure 3. Porter’s Five Forces
Figure 4. Global Chemical Leavening Agents Market Revenue (USD Million) By Regions (2021-2032)
Figure 5. Global Chemical Leavening Agents Market Share (%) By Regions (2023)
Figure 6. North America Chemical Leavening Agents Revenue (USD Million) By Country (2021-2032)
Figure 7. United States Chemical Leavening Agents Revenue (USD Million) By Country (2021-2032)
Figure 8. Canada Chemical Leavening Agents Revenue (USD Million) By Country (2021-2032)
Figure 9. Mexico Chemical Leavening Agents Revenue (USD Million) By Country (2021-2032)
Figure 10. Europe Chemical Leavening Agents Revenue (USD Million) By Country (2021-2032)
Figure 11. Germany Chemical Leavening Agents Revenue (USD Million) By Country (2021-2032)
Figure 12. France Chemical Leavening Agents Revenue (USD Million) By Country (2021-2032)
Figure 13. United Kingdom Chemical Leavening Agents Revenue (USD Million) By Country (2021-2032)
Figure 14. Spain Chemical Leavening Agents Revenue (USD Million) By Country (2021-2032)
Figure 15. Italy Chemical Leavening Agents Revenue (USD Million) By Country (2021-2032)
Figure 16. Russia Chemical Leavening Agents Revenue (USD Million) By Country (2021-2032)
Figure 17. Rest of Europe Chemical Leavening Agents Revenue (USD Million) By Country (2021-2032)
Figure 11. Asia Pacific Chemical Leavening Agents Revenue (USD Million) By Country (2021-2032)
Figure 12. China Chemical Leavening Agents Revenue (USD Million) By Country (2021-2032)
Figure 13. Japan Chemical Leavening Agents Revenue (USD Million) By Country (2021-2032)
Figure 14. India Chemical Leavening Agents Revenue (USD Million) By Country (2021-2032)
Figure 15. South Korea Chemical Leavening Agents Revenue (USD Million) By Country (2021-2032)
Figure 16. Australia Chemical Leavening Agents Revenue (USD Million) By Country (2021-2032)
Figure 17. South East Asia Chemical Leavening Agents Revenue (USD Million) By Country (2021-2032)
Figure 18. South America Chemical Leavening Agents Revenue (USD Million) By Country (2021-2032)
Figure 19. Brazil Chemical Leavening Agents Revenue (USD Million) By Country (2021-2032)
Figure 20. Argentina Chemical Leavening Agents Revenue (USD Million) By Country (2021-2032)
Figure 21. Rest of Asia Pacific Chemical Leavening Agents Revenue (USD Million) By Country (2021-2032)
Figure 22. Middle East and Africa Chemical Leavening Agents Revenue (USD Million) By Region (2021-2032)
Figure 23. Saudi Arabia Chemical Leavening Agents Revenue (USD Million) By Region (2021-2032)
Figure 24. The UAE Chemical Leavening Agents Revenue (USD Million) By Region (2021-2032)
Figure 25. Rest of Middle East Chemical Leavening Agents Revenue (USD Million) By Region (2021-2032)
Figure 26. South Africa Chemical Leavening Agents Revenue (USD Million) By Region (2021-2032)
Figure 27. Africa Chemical Leavening Agents Revenue (USD Million) By Region (2021-2032)
Figure 28. North America Chemical Leavening Agents Revenue (USD Million) By Type (2021-2032)
Figure 29. North America Chemical Leavening Agents Revenue (USD Million) By Application (2021-2032)
Figure 30. North America Chemical Leavening Agents Revenue (USD Million) By Product (2021-2032)
Figure 31. Europe Chemical Leavening Agents Revenue (USD Million) By Type (2021-2032)
Figure 32. Europe Chemical Leavening Agents Revenue (USD Million) By Application (2021-2032)
Figure 33. Europe Chemical Leavening Agents Revenue (USD Million) By Product (2021-2032)
Figure 34. Asia Pacific Chemical Leavening Agents Revenue (USD Million) By Type (2021-2032)
Figure 35. Asia Pacific Chemical Leavening Agents Revenue (USD Million) By Application (2021-2032)
Figure 36. Asia Pacific Chemical Leavening Agents Revenue (USD Million) By Product (2021-2032)
Figure 37. South America Chemical Leavening Agents Revenue (USD Million) By Type (2021-2032)
Figure 38. South America Chemical Leavening Agents Revenue (USD Million) By Application (2021-2032)
Figure 39. South America Chemical Leavening Agents Revenue (USD Million) By Product (2021-2032)
Figure 40. Middle East and Africa Chemical Leavening Agents Revenue (USD Million) By Type (2021-2032)
Figure 41. Middle East and Africa Chemical Leavening Agents Revenue (USD Million) By Application (2021-2032)
Figure 42. Middle East and Africa Chemical Leavening Agents Revenue (USD Million) By Product (2021-2032)
By Type
Organic
Regular
By Application
Bakery
Confectionery
Savory Biscuits & Crackers
Food Products
Others
Countries Analyzed
North America (US, Canada, Mexico)
Europe (Germany, UK, France, Spain, Italy, Russia, Rest of Europe)
Asia Pacific (China, India, Japan, South Korea, Australia, South East Asia, Rest of Asia)
South America (Brazil, Argentina, Rest of South America)
Middle East and Africa (Saudi Arabia, UAE, Rest of Middle East, South Africa, Egypt, Rest of Africa)
