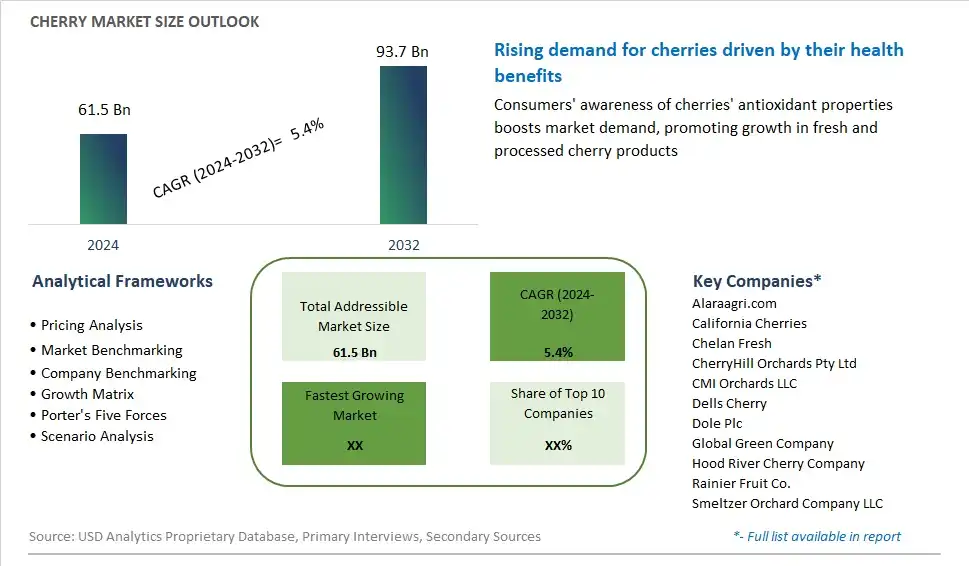
Global Cherry Market Size is valued at $61.5 Billion in 2024 and is forecast to register a growth rate (CAGR) of 5.4% to reach $93.7 Billion by 2032.
The global Cherry Market Comprehensive Study analyzes and forecasts the market size across 6 regions and 24 countries for diverse segments -By Type (Bing, Rainier, Lambert, Lapkins), By Application (Jams, Jellies, Ice-cream, Alcoholic beverages, Others), By Distribution Channel (Supermarkets/Hypermarkets, Convenience Stores, Online)
An Introduction to Cherry Market
In 2024, the cherry market is flourishing, driven by the fruit's popularity as a nutritious and versatile ingredient in various culinary applications. Cherries are rich in antioxidants, vitamins, and minerals, making them a sought-after choice for health-conscious consumers. The market benefits from the increasing demand for fresh, frozen, and processed cherries, used in products ranging from juices and jams to desserts and savory dishes. Innovations in agricultural practices and post-harvest technologies are improving the yield and quality of cherries, extending their availability throughout the year. Additionally, the rising interest in superfoods and functional foods is boosting the market, as cherries are recognized for their potential health benefits, including anti-inflammatory and heart-protective properties.
Cherry Competitive Landscape
The market report analyses the leading companies in the industry including Alaraagri.com, California Cherries, Chelan Fresh, CherryHill Orchards Pty Ltd, CMI Orchards LLC, Dells Cherry, Dole Plc, Global Green Company, Hood River Cherry Company, Rainier Fruit Co., Smeltzer Orchard Company LLC, and Others.
Cherry Market Dynamics
Cherry Market Trend: Increasing Popularity of Functional and Health-Promoting Cherry Products
One of the most prominent trends in the cherry market is the increasing popularity of functional and health-promoting cherry products. Cherries are known for their rich antioxidant content, including anthocyanins and flavonoids, which contribute to their vibrant color and potential health benefits. As consumers become more health-conscious and seek natural remedies for various health conditions, there is growing interest in cherry-based products such as cherry juice, cherry supplements, and cherry-infused foods. This trend is driven by research highlighting the potential health benefits of cherries, including anti-inflammatory properties, pain relief, improved sleep quality, and enhanced exercise recovery. Manufacturers are responding by developing innovative cherry products that cater to these health-focused consumer preferences, creating opportunities for growth and differentiation in the market.
Market Driver: Demand for Natural and Clean Label Ingredients
The primary driver of the cherry market is the demand for natural and clean label ingredients. With increasing consumer awareness of food additives, preservatives, and artificial ingredients, there is a growing preference for products made with simple, recognizable ingredients. Cherries, with their naturally sweet flavor and vibrant color, are perceived as clean label ingredients and are sought after by consumers looking for wholesome and minimally processed foods. This driver is fueled by the desire for transparency, authenticity, and health-consciousness in food choices, making cherries an attractive ingredient for manufacturers across various food and beverage categories. Moreover, the versatility of cherries in both sweet and savory applications presents opportunities for product innovation and differentiation, further driving demand for cherry-based ingredients in the market.
Market Opportunity: Expansion into Value-Added Cherry Products and Global Markets
A significant opportunity for the cherry market lies in expansion into value-added cherry products and global markets. While fresh cherries are popular during the harvest season, there is potential to extend the market reach and value by processing cherries into various value-added products such as dried cherries, cherry preserves, cherry salsa, cherry vinegar, and cherry sauces. These value-added products offer convenience, longer shelf life, and versatility in culinary applications, appealing to consumers looking for unique flavors and ingredients. Moreover, expanding into global markets presents opportunities to introduce cherry products to new audiences and capitalize on the growing demand for exotic and health-promoting ingredients. By leveraging the nutritional benefits, flavor profile, and versatility of cherries, manufacturers can diversify their product portfolios, increase market penetration, and drive revenue growth in the competitive food and beverage landscape.
Cherry Market Share Analysis: Bing held the dominant market share in 2024
The Bing segment stands out as the largest in the cherry market due to its widespread popularity, rich flavor profile, and versatility in culinary applications. Bing cherries, characterized by their deep red color and sweet-tart taste, are highly sought after by consumers worldwide for their exceptional taste and juiciness. These cherries are favored for fresh consumption, as well as for use in various culinary creations such as pies, tarts, jams, and preserves. Further, Bing cherries are commonly used in the production of cherry-flavored beverages, confectionery items, and desserts, further driving their demand in the market. Their availability during the peak cherry season and extensive distribution through supermarkets, farmers' markets, and online platforms contribute to the dominance of the Bing segment in the cherry market. As consumer preferences continue to favor the superior taste and quality of Bing cherries, this segment is expected to maintain its leading position in the market.
Cherry Market Share Analysis: Alcoholic Beverages market is poised to register the fastest growth rae over the forecast period to 2032
The Alcoholic Beverages segment is the fastest-growing in the cherry market, driven by the rising demand for innovative and flavorful alcoholic drinks. Cherries are prized for their unique flavor profile, which blends sweetness with a hint of tartness, making them a popular choice for infusing alcoholic beverages. Cherry-flavored cocktails, liqueurs, and spirits have gained popularity among consumers seeking indulgent and refreshing drinks. Additionally, the versatility of cherries allows for their incorporation into various alcoholic concoctions, ranging from classic cocktails like the Manhattan and Old Fashioned to modern creations such as cherry-infused vodkas and craft beers. The growing trend of mixology and craft distilling further amplifies the demand for cherry-infused alcoholic beverages, presenting opportunities for beverage manufacturers and bartenders to innovate and create new offerings that cater to evolving consumer tastes. As consumers continue to seek unique and flavorful drinking experiences, the Alcoholic Beverages segment is expected to experience rapid growth in the cherry market.
Cherry Market Share Analysis: Supermarkets/Hypermarkets held the dominant market share in 2024
The Supermarkets/Hypermarkets segment stands as the largest in the cherry market due to its extensive reach and accessibility to consumers. Supermarkets and hypermarkets offer a wide variety of cherry varieties and products under one roof, making them a convenient shopping destination for consumers looking to purchase cherries. These retail outlets typically stock fresh cherries during the peak season and may also offer preserved cherry products such as jams, jellies, and canned cherries year-round. Further, supermarkets and hypermarkets often implement promotional activities and discounts to attract customers, further boosting cherry sales. Additionally, the ability to inspect and select cherries visually contributes to consumer confidence and satisfaction. With the convenience, variety, and promotional strategies offered by supermarkets and hypermarkets, the Supermarkets/Hypermarkets segment continues to dominate the distribution channel for cherries in the market.
Cherry Market Segmentation
By Type
Bing
Rainier
Lambert
Lapkins
By Application
Jams
Jellies
Ice-cream
Alcoholic beverages
Others
By Distribution Channel
Supermarkets/Hypermarkets
Convenience Stores
Online
Countries Analyzed
North America (US, Canada, Mexico)
Europe (Germany, UK, France, Spain, Italy, Russia, Rest of Europe)
Asia Pacific (China, India, Japan, South Korea, Australia, South East Asia, Rest of Asia)
South America (Brazil, Argentina, Rest of South America)
Middle East and Africa (Saudi Arabia, UAE, Rest of Middle East, South Africa, Egypt, Rest of Africa)
Cherry Companies Profiled in the Study
Alaraagri.com
California Cherries
Chelan Fresh
CherryHill Orchards Pty Ltd
CMI Orchards LLC
Dells Cherry
Dole Plc
Global Green Company
Hood River Cherry Company
Rainier Fruit Co.
Smeltzer Orchard Company LLC
*- List Not Exhaustive
Chapter 1. TABLE OF CONTENTS
Chapter 2. Introduction to Cherry Market
2.1. Market Overview
2.2. Key Statistics and Report Highlights
2.3. Scope of the Comprehensive Study
2.3.1. Market Definition
2.3.2 Countries and Regions Covered
2.3.3 Research Objective
2.3.4 Units, Currency, and Conversions
2.3.5 Industry Value Chain
2.4. Key Market Segments
2.5. Key Companies
2.6. Study Period
Chapter 3. Strategic Analysis Review
3.1. Cherry Pricing Analysis and Forecast
3.2. Porter’s Five Forces
3.3. Market Ecosystem
3.4. SWOT Analysis
3.5. Regulatory Scenario
3.3. Effects of Inflation, Russia-Ukraine War, moderating economic growth, and other macroeconomic factors
Chapter 4. Competitive Landscape
4.1. Market Share Analysis
4.1.1. Global Cherry Market Share by Company, 2023
4.1.2. Product Offerings of Leading Cherry Companies
4.2. Market Entropy
4.2.1. New Product Launches in the Industry
4.2.2. Mergers, Acquisitions, Joint ventures, and Partnerships
4.3. Key Strategies and Best Practices
Chapter 5. Global Market Projections: Best, Reference, and Low Case Scenarios
5.1. Growth Analysis- Case Scenario Definitions
5.2. Low Growth Case Scenario Forecasts
5.3. Reference Growth Case Scenario Forecasts
5.4. High Growth Case Scenario Forecasts
Chapter 6. Market Dynamics
6.1. Cherry Market Drivers
6.2. Cherry Market Challenges
6.6. Cherry Market Opportunities
6.4. Cherry Market Trends
Chapter 7. Global Cherry Market Outlook Trends
7.1. Global Cherry Revenue (USD Million) and CAGR (%) by Type (2021-2032)
7.2. Global Cherry Revenue (USD Million) and CAGR (%) by Application (2021-2032)
7.3. Global Cherry Revenue (USD Million) and CAGR (%) by Product (2021-2032)
By Type
Bing
Rainier
Lambert
Lapkins
By Application
Jams
Jellies
Ice-cream
Alcoholic beverages
Others
By Distribution Channel
Supermarkets/Hypermarkets
Convenience Stores
Online
Chapter 8. Global Cherry Regional Analysis and Outlook
8.1. Global Cherry Revenue (USD Million) By Regions (2021- 2032)
8.2. North America Cherry Revenue (USD Million) by Country (2021-2032)
8.2.1. United States Cherry Regional Analysis and Outlook
8.2.2. Canada Cherry Regional Analysis and Outlook
8.2.3. Mexico Cherry Regional Analysis and Outlook
8.3. Europe Cherry Revenue (USD Million), by Country (2021-2032)
8.3.1. Germany Cherry Regional Analysis and Outlook
8.3.2. France Cherry Regional Analysis and Outlook
8.3.3. United Kingdom Cherry Regional Analysis and Outlook
8.3.4. Spain Cherry Regional Analysis and Outlook
8.3.5. Italy Cherry Regional Analysis and Outlook
8.3.6. Russia Cherry Regional Analysis and Outlook
8.3.7. Rest of Europe Cherry Regional Analysis and Outlook
8.4. Asia Pacific Cherry Revenue (USD Million) by Country (2021-2032)
8.4.1. China Cherry Regional Analysis and Outlook
8.4.2. Japan Cherry Regional Analysis and Outlook
8.4.3. India Cherry Regional Analysis and Outlook
8.4.4. South Korea Cherry Regional Analysis and Outlook
8.4.5. Australia Cherry Regional Analysis and Outlook
8.4.6. South East Asia Cherry Regional Analysis and Outlook
8.4.7. Rest of Asia Pacific Cherry Regional Analysis and Outlook
8.5. South America Cherry Revenue (USD Million), by Country (2021-2032)
8.5.1. Brazil Cherry Regional Analysis and Outlook
8.5.2. Argentina Cherry Regional Analysis and Outlook
8.5.3. Rest of South America Cherry Regional Analysis and Outlook
8.6. Middle East and Africa Cherry Revenue (USD Million) by Country (2021-2032)
8.6.1. Middle East Cherry Regional Analysis and Outlook
8.6.2. Africa Cherry Regional Analysis and Outlook
Chapter 9. North America Cherry Analysis and Outlook
9.1. North America Cherry Revenue (USD Million) by Segments (2021-2032)
9.1.1. North America Cherry Revenue (USD Million) by Type (2021-2032)
9.1.2. North America Cherry Revenue (USD Million) by Application (2021-2032)
9.1.3. North America Cherry Revenue (USD Million) by Product (2021-2032)
By Type
Bing
Rainier
Lambert
Lapkins
By Application
Jams
Jellies
Ice-cream
Alcoholic beverages
Others
By Distribution Channel
Supermarkets/Hypermarkets
Convenience Stores
Online
Chapter 10. Europe Cherry Analysis and Outlook
10.1. Europe Cherry Revenue (USD Million), by Segments (USD Million) (2021-2032)
10.1.1. Europe Cherry Revenue (USD Million) by Type (2021-2032)
10.1.2. Europe Cherry Revenue (USD Million) by Application (2021-2032)
10.1.3. Europe Cherry Revenue (USD Million) by Product (2021-2032)
By Type
Bing
Rainier
Lambert
Lapkins
By Application
Jams
Jellies
Ice-cream
Alcoholic beverages
Others
By Distribution Channel
Supermarkets/Hypermarkets
Convenience Stores
Online
Chapter 11. Asia Pacific Cherry Analysis and Outlook
11.1. Asia Pacific Cherry Revenue (USD Million), and Revenue (USD Million) by Segments (2021-2032)
11.1.1. Asia Pacific Cherry Revenue (USD Million) by Type (2021-2032)
11.1.2. Asia Pacific Cherry Revenue (USD Million) by Application (2021-2032)
11.1.3. Asia Pacific Cherry Revenue (USD Million) by Product (2021-2032)
By Type
Bing
Rainier
Lambert
Lapkins
By Application
Jams
Jellies
Ice-cream
Alcoholic beverages
Others
By Distribution Channel
Supermarkets/Hypermarkets
Convenience Stores
Online
Chapter 12. South America Cherry Analysis and Outlook
12.1. South America Cherry Revenue (USD Million), by Segments (2021-2032)
12.1.1. South America Cherry Revenue (USD Million) by Type (2021-2032)
12.1.2. South America Cherry Revenue (USD Million) by Application (2021-2032)
12.1.3. South America Cherry Revenue (USD Million) by Product (2021-2032)
By Type
Bing
Rainier
Lambert
Lapkins
By Application
Jams
Jellies
Ice-cream
Alcoholic beverages
Others
By Distribution Channel
Supermarkets/Hypermarkets
Convenience Stores
Online
Chapter 13. Middle East and Africa Cherry Analysis and Outlook
13.1. Middle East and Africa Cherry Revenue (USD Million), by Segments (2021-2032)
13.1.1. Middle East and Africa Cherry Revenue (USD Million) by Type (2021-2032)
13.1.2. Middle East and Africa Cherry Revenue (USD Million) by Application (2021-2032)
13.1.3. Middle East and Africa Cherry Revenue (USD Million) by Product (2021-2032)
By Type
Bing
Rainier
Lambert
Lapkins
By Application
Jams
Jellies
Ice-cream
Alcoholic beverages
Others
By Distribution Channel
Supermarkets/Hypermarkets
Convenience Stores
Online
Chapter 14. Cherry Company Profiles
14.1 Business Overview
14.2 Product Profiles
14.3 SWOT Profiles
14.5 Recent Developments
14.6 Financial Profile
List of Companies
Alaraagri.com
California Cherries
Chelan Fresh
CherryHill Orchards Pty Ltd
CMI Orchards LLC
Dells Cherry
Dole Plc
Global Green Company
Hood River Cherry Company
Rainier Fruit Co.
Smeltzer Orchard Company LLC
15. Methodology and Data Sources
15.1 Customization Offerings
15.2 Subscription Services
15.3 Related Reports
15.4 Publisher Expertise
LIST OF TABLES
Table 1 Market Segmentation Analysis
Table 2 Global Cherry Market Share of Leading Companies, 2023
Table 3 Product Offerings of Leading Companies
Table 4 Low Growth Scenario Forecasts
Table 5 Reference Case Growth Scenario
Table 6 High Growth Case Scenario
Table 7 Global Cherry Revenue (USD Million) And CAGR (%) By Type (2021-2032)
Table 8 Global Cherry Revenue (USD Million) And CAGR (%) By Application (2021-2032)
Table 9 Global Cherry Revenue (USD Million) And CAGR (%) By Product (2021-2032)
Table 10 Global Cherry Market Revenue (USD Million) By Regions (2021-2032)
Table 11 Global Cherry Market Share (%) By Regions (2021-2032)
Table 12 North America Cherry Revenue (USD Million) By Country (2021-2032)
Table 13 Europe Cherry Revenue (USD Million) By Country (2021-2032)
Table 14 Asia Pacific Cherry Revenue (USD Million) By Country (2021-2032)
Table 15 South America Cherry Revenue (USD Million) By Country (2021-2032)
Table 16 Middle East and Africa Cherry Revenue (USD Million) By Region (2021-2032)
Table 17 North America Cherry Revenue (USD Million) By Type (2021-2032)
Table 18 North America Cherry Revenue (USD Million) By Application (2021-2032)
Table 19 North America Cherry Revenue (USD Million) By Product (2021-2032)
Table 20 Europe Cherry Revenue (USD Million) By Type (2021-2032)
Table 21 Europe Cherry Revenue (USD Million) By Application (2021-2032)
Table 22 Europe Cherry Revenue (USD Million) By Product (2021-2032)
Table 23 Asia Pacific Cherry Revenue (USD Million) By Type (2021-2032)
Table 24 Asia Pacific Cherry Revenue (USD Million) By Application (2021-2032)
Table 25 Asia Pacific Cherry Revenue (USD Million) By Product (2021-2032)
Table 26 South America Cherry Revenue (USD Million) By Type (2021-2032)
Table 27 South America Cherry Revenue (USD Million) By Application (2021-2032)
Table 28 South America Cherry Revenue (USD Million) By Product (2021-2032)
Table 29 Middle East and Africa Cherry Revenue (USD Million) By Type (2021-2032)
Table 30 Middle East and Africa Cherry Revenue (USD Million) By Application (2021-2032)
Table 31 Middle East and Africa Cherry Revenue (USD Million) By Product (2021-2032)
LIST OF FIGURES
Figure 1. Market Scope
Figure 2. Pricing Forecasts Per Unit, 2023- 2032
Figure 3. Porter’s Five Forces
Figure 4. Global Cherry Market Revenue (USD Million) By Regions (2021-2032)
Figure 5. Global Cherry Market Share (%) By Regions (2023)
Figure 6. North America Cherry Revenue (USD Million) By Country (2021-2032)
Figure 7. United States Cherry Revenue (USD Million) By Country (2021-2032)
Figure 8. Canada Cherry Revenue (USD Million) By Country (2021-2032)
Figure 9. Mexico Cherry Revenue (USD Million) By Country (2021-2032)
Figure 10. Europe Cherry Revenue (USD Million) By Country (2021-2032)
Figure 11. Germany Cherry Revenue (USD Million) By Country (2021-2032)
Figure 12. France Cherry Revenue (USD Million) By Country (2021-2032)
Figure 13. United Kingdom Cherry Revenue (USD Million) By Country (2021-2032)
Figure 14. Spain Cherry Revenue (USD Million) By Country (2021-2032)
Figure 15. Italy Cherry Revenue (USD Million) By Country (2021-2032)
Figure 16. Russia Cherry Revenue (USD Million) By Country (2021-2032)
Figure 17. Rest of Europe Cherry Revenue (USD Million) By Country (2021-2032)
Figure 11. Asia Pacific Cherry Revenue (USD Million) By Country (2021-2032)
Figure 12. China Cherry Revenue (USD Million) By Country (2021-2032)
Figure 13. Japan Cherry Revenue (USD Million) By Country (2021-2032)
Figure 14. India Cherry Revenue (USD Million) By Country (2021-2032)
Figure 15. South Korea Cherry Revenue (USD Million) By Country (2021-2032)
Figure 16. Australia Cherry Revenue (USD Million) By Country (2021-2032)
Figure 17. South East Asia Cherry Revenue (USD Million) By Country (2021-2032)
Figure 18. South America Cherry Revenue (USD Million) By Country (2021-2032)
Figure 19. Brazil Cherry Revenue (USD Million) By Country (2021-2032)
Figure 20. Argentina Cherry Revenue (USD Million) By Country (2021-2032)
Figure 21. Rest of Asia Pacific Cherry Revenue (USD Million) By Country (2021-2032)
Figure 22. Middle East and Africa Cherry Revenue (USD Million) By Region (2021-2032)
Figure 23. Saudi Arabia Cherry Revenue (USD Million) By Region (2021-2032)
Figure 24. The UAE Cherry Revenue (USD Million) By Region (2021-2032)
Figure 25. Rest of Middle East Cherry Revenue (USD Million) By Region (2021-2032)
Figure 26. South Africa Cherry Revenue (USD Million) By Region (2021-2032)
Figure 27. Africa Cherry Revenue (USD Million) By Region (2021-2032)
Figure 28. North America Cherry Revenue (USD Million) By Type (2021-2032)
Figure 29. North America Cherry Revenue (USD Million) By Application (2021-2032)
Figure 30. North America Cherry Revenue (USD Million) By Product (2021-2032)
Figure 31. Europe Cherry Revenue (USD Million) By Type (2021-2032)
Figure 32. Europe Cherry Revenue (USD Million) By Application (2021-2032)
Figure 33. Europe Cherry Revenue (USD Million) By Product (2021-2032)
Figure 34. Asia Pacific Cherry Revenue (USD Million) By Type (2021-2032)
Figure 35. Asia Pacific Cherry Revenue (USD Million) By Application (2021-2032)
Figure 36. Asia Pacific Cherry Revenue (USD Million) By Product (2021-2032)
Figure 37. South America Cherry Revenue (USD Million) By Type (2021-2032)
Figure 38. South America Cherry Revenue (USD Million) By Application (2021-2032)
Figure 39. South America Cherry Revenue (USD Million) By Product (2021-2032)
Figure 40. Middle East and Africa Cherry Revenue (USD Million) By Type (2021-2032)
Figure 41. Middle East and Africa Cherry Revenue (USD Million) By Application (2021-2032)
Figure 42. Middle East and Africa Cherry Revenue (USD Million) By Product (2021-2032)
By Type
Bing
Rainier
Lambert
Lapkins
By Application
Jams
Jellies
Ice-cream
Alcoholic beverages
Others
By Distribution Channel
Supermarkets/Hypermarkets
Convenience Stores
Online
Countries Analyzed
North America (US, Canada, Mexico)
Europe (Germany, UK, France, Spain, Italy, Russia, Rest of Europe)
Asia Pacific (China, India, Japan, South Korea, Australia, South East Asia, Rest of Asia)
South America (Brazil, Argentina, Rest of South America)
Middle East and Africa (Saudi Arabia, UAE, Rest of Middle East, South Africa, Egypt, Rest of Africa)
