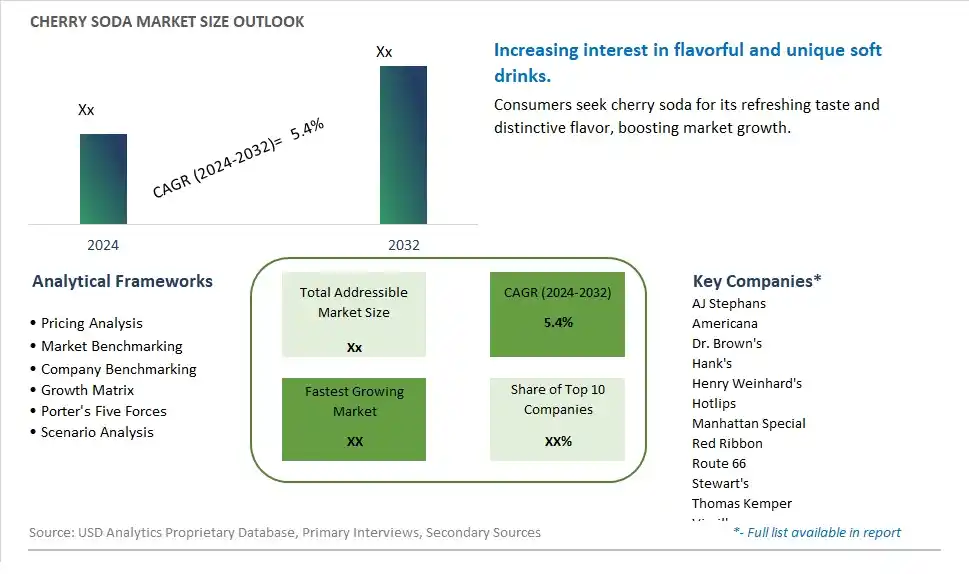
Global Cherry Soda Market Size is valued at $XX Million in 2024 and is forecast to register a growth rate (CAGR) of 5.4% to reach $XX Million by 2032.
The global Cherry Soda Market Comprehensive Study analyzes and forecasts the market size across 6 regions and 24 countries for diverse segments -By Type (Regular, Diet ), By Application (Supermarkets/Hypermarkets, Convenience Stores, Independent Retailers, Online Sales, Others)
An Introduction to Cherry Soda Market
The Cherry Soda market in 2024 is expanding rapidly, driven by the increasing demand for unique and flavorful carbonated beverages. Cherry soda, known for its refreshing taste and distinctive cherry flavor, is popular among consumers seeking a nostalgic and indulgent drink option. The market is supported by the growing trend towards specialty and craft sodas. Advances in flavor formulation and carbonation technology are enhancing the taste, quality, and consistency of cherry soda. The market is also benefiting from the trend towards clean-label and natural ingredients, appealing to consumers seeking high-quality and flavorful beverage options.
Cherry Soda Competitive Landscape
The market report analyses the leading companies in the industry including AJ Stephans, Americana, Dr. Brown's, Hank's, Henry Weinhard's, Hotlips, Manhattan Special, Red Ribbon, Route 66, Stewart's, Thomas Kemper, Virgil's, and Others.
Cherry Soda Market Dynamics
Cherry Soda Market Trend: Shift Towards Natural and Artisanal Beverages
A prominent market trend for cherry soda is the shift towards natural and artisanal beverages among consumers. With a growing awareness of health and wellness, there's a preference for soda options made with real fruit extracts, natural flavors, and fewer artificial additives. Cherry soda, known for its refreshing taste and potential health benefits from cherry antioxidants, is gaining traction as a premium and indulgent soda choice that appeals to discerning consumers seeking authentic and flavorful beverage experiences.
Cherry Soda Market Driver: Demand for Unique Flavors and Novelty Beverages
A key driver fueling the market for cherry soda is the demand for unique flavors and novelty beverages in the soft drinks segment. Consumers are seeking variety and excitement in their beverage choices, looking beyond traditional soda flavors to explore new taste sensations. Cherry soda offers a distinct and enjoyable flavor profile that stands out among standard cola or citrus sodas, attracting consumers looking for something different and memorable in their beverage selections.
Cherry Soda Market Opportunity: Innovation in Low-Sugar and Health-Conscious Varieties
An opportunity within the cherry soda market lies in innovation, particularly in low-sugar and health-conscious varieties. Manufacturers can develop cherry soda formulations with reduced sugar content, natural sweeteners, or functional ingredients that appeal to health-conscious consumers seeking lower-calorie options without compromising on flavor. Additionally, promoting cherry soda as a guilt-free indulgence with antioxidant benefits from cherries can resonate with wellness-focused demographics, positioning cherry soda as a refreshing and better-for-you beverage choice. By tapping into the demand for healthier soda alternatives and innovative flavor profiles, companies can seize opportunities for growth and differentiation in the competitive soda market.
Cherry Soda Market Share Analysis: Regular segment generated the highest revenue share in the industry
The Regular segment stands as the largest in the Cherry Soda market by type. This segment's dominance is rooted in its widespread consumer appeal and longstanding popularity among soda enthusiasts. Regular cherry soda features a full-flavored profile with a balanced blend of sweetness and tartness, appealing to a broad demographic seeking a refreshing and indulgent beverage option. The Regular segment benefits from its established market presence and consumer familiarity, offering consistent taste experiences that resonate across various age groups and consumption occasions. Further, regular cherry soda formulations often use natural or artificial flavors to achieve the characteristic cherry taste, enhancing product consistency and brand recognition. As consumer preferences evolve towards moderation and health consciousness, the Regular segment continues to thrive by adapting to market trends through innovative packaging, flavor extensions, and promotional strategies that maintain its leadership in the competitive soda market. Despite the growing popularity of diet and low-sugar alternatives, the enduring appeal of Regular cherry soda underscores its resilience and market prominence, driving ongoing innovation and growth in the Cherry Soda market.
Cherry Soda Market Share Analysis: Online Sales is the fastest growing segment over the forecast period to 2032
The Online Sales segment is anticipated to be the fastest growing in the Cherry Soda market by application through 2032. This growth is driven by the increasing consumer preference for convenient shopping experiences and the rising trend of e-commerce platforms offering a wide selection of beverages, including cherry soda. Online sales of cherry soda benefit from the convenience of doorstep delivery, particularly appealing to busy urban consumers and those seeking specialty or niche soda flavors not readily available in local stores. Further, the proliferation of online grocery platforms and direct-to-consumer models enables beverage manufacturers to reach a broader audience, including health-conscious individuals looking for low-sugar or diet options. The Online Sales segment also capitalizes on digital marketing strategies and social media influence, which play pivotal roles in promoting cherry soda products and engaging with tech-savvy consumers. As digitalization transforms retail landscapes worldwide, the Online Sales segment in the Cherry Soda market is poised for exponential growth, supported by investments in logistics, customer service enhancements, and personalized shopping experiences that cater to evolving consumer preferences and lifestyle choices.
Cherry Soda Market Segmentation
By Type
Regular
Diet
By Application
Supermarkets/Hypermarkets
Convenience Stores
Independent Retailers
Online Sales
Others
Countries Analyzed
North America (US, Canada, Mexico)
Europe (Germany, UK, France, Spain, Italy, Russia, Rest of Europe)
Asia Pacific (China, India, Japan, South Korea, Australia, South East Asia, Rest of Asia)
South America (Brazil, Argentina, Rest of South America)
Middle East and Africa (Saudi Arabia, UAE, Rest of Middle East, South Africa, Egypt, Rest of Africa)
Cherry Soda Companies Profiled in the Study
AJ Stephans
Americana
Dr. Brown's
Hank's
Henry Weinhard's
Hotlips
Manhattan Special
Red Ribbon
Route 66
Stewart's
Thomas Kemper
Virgil's
*- List Not Exhaustive
Chapter 1. TABLE OF CONTENTS
Chapter 2. Introduction to Cherry Soda Market
2.1. Market Overview
2.2. Key Statistics and Report Highlights
2.3. Scope of the Comprehensive Study
2.3.1. Market Definition
2.3.2 Countries and Regions Covered
2.3.3 Research Objective
2.3.4 Units, Currency, and Conversions
2.3.5 Industry Value Chain
2.4. Key Market Segments
2.5. Key Companies
2.6. Study Period
Chapter 3. Strategic Analysis Review
3.1. Cherry Soda Pricing Analysis and Forecast
3.2. Porter’s Five Forces
3.3. Market Ecosystem
3.4. SWOT Analysis
3.5. Regulatory Scenario
3.3. Effects of Inflation, Russia-Ukraine War, moderating economic growth, and other macroeconomic factors
Chapter 4. Competitive Landscape
4.1. Market Share Analysis
4.1.1. Global Cherry Soda Market Share by Company, 2023
4.1.2. Product Offerings of Leading Cherry Soda Companies
4.2. Market Entropy
4.2.1. New Product Launches in the Industry
4.2.2. Mergers, Acquisitions, Joint ventures, and Partnerships
4.3. Key Strategies and Best Practices
Chapter 5. Global Market Projections: Best, Reference, and Low Case Scenarios
5.1. Growth Analysis- Case Scenario Definitions
5.2. Low Growth Case Scenario Forecasts
5.3. Reference Growth Case Scenario Forecasts
5.4. High Growth Case Scenario Forecasts
Chapter 6. Market Dynamics
6.1. Cherry Soda Market Drivers
6.2. Cherry Soda Market Challenges
6.6. Cherry Soda Market Opportunities
6.4. Cherry Soda Market Trends
Chapter 7. Global Cherry Soda Market Outlook Trends
7.1. Global Cherry Soda Revenue (USD Million) and CAGR (%) by Type (2021-2032)
7.2. Global Cherry Soda Revenue (USD Million) and CAGR (%) by Application (2021-2032)
7.3. Global Cherry Soda Revenue (USD Million) and CAGR (%) by Product (2021-2032)
By Type
Regular
Diet
By Application
Supermarkets/Hypermarkets
Convenience Stores
Independent Retailers
Online Sales
Others
Chapter 8. Global Cherry Soda Regional Analysis and Outlook
8.1. Global Cherry Soda Revenue (USD Million) By Regions (2021- 2032)
8.2. North America Cherry Soda Revenue (USD Million) by Country (2021-2032)
8.2.1. United States Cherry Soda Regional Analysis and Outlook
8.2.2. Canada Cherry Soda Regional Analysis and Outlook
8.2.3. Mexico Cherry Soda Regional Analysis and Outlook
8.3. Europe Cherry Soda Revenue (USD Million), by Country (2021-2032)
8.3.1. Germany Cherry Soda Regional Analysis and Outlook
8.3.2. France Cherry Soda Regional Analysis and Outlook
8.3.3. United Kingdom Cherry Soda Regional Analysis and Outlook
8.3.4. Spain Cherry Soda Regional Analysis and Outlook
8.3.5. Italy Cherry Soda Regional Analysis and Outlook
8.3.6. Russia Cherry Soda Regional Analysis and Outlook
8.3.7. Rest of Europe Cherry Soda Regional Analysis and Outlook
8.4. Asia Pacific Cherry Soda Revenue (USD Million) by Country (2021-2032)
8.4.1. China Cherry Soda Regional Analysis and Outlook
8.4.2. Japan Cherry Soda Regional Analysis and Outlook
8.4.3. India Cherry Soda Regional Analysis and Outlook
8.4.4. South Korea Cherry Soda Regional Analysis and Outlook
8.4.5. Australia Cherry Soda Regional Analysis and Outlook
8.4.6. South East Asia Cherry Soda Regional Analysis and Outlook
8.4.7. Rest of Asia Pacific Cherry Soda Regional Analysis and Outlook
8.5. South America Cherry Soda Revenue (USD Million), by Country (2021-2032)
8.5.1. Brazil Cherry Soda Regional Analysis and Outlook
8.5.2. Argentina Cherry Soda Regional Analysis and Outlook
8.5.3. Rest of South America Cherry Soda Regional Analysis and Outlook
8.6. Middle East and Africa Cherry Soda Revenue (USD Million) by Country (2021-2032)
8.6.1. Middle East Cherry Soda Regional Analysis and Outlook
8.6.2. Africa Cherry Soda Regional Analysis and Outlook
Chapter 9. North America Cherry Soda Analysis and Outlook
9.1. North America Cherry Soda Revenue (USD Million) by Segments (2021-2032)
9.1.1. North America Cherry Soda Revenue (USD Million) by Type (2021-2032)
9.1.2. North America Cherry Soda Revenue (USD Million) by Application (2021-2032)
9.1.3. North America Cherry Soda Revenue (USD Million) by Product (2021-2032)
By Type
Regular
Diet
By Application
Supermarkets/Hypermarkets
Convenience Stores
Independent Retailers
Online Sales
Others
Chapter 10. Europe Cherry Soda Analysis and Outlook
10.1. Europe Cherry Soda Revenue (USD Million), by Segments (USD Million) (2021-2032)
10.1.1. Europe Cherry Soda Revenue (USD Million) by Type (2021-2032)
10.1.2. Europe Cherry Soda Revenue (USD Million) by Application (2021-2032)
10.1.3. Europe Cherry Soda Revenue (USD Million) by Product (2021-2032)
By Type
Regular
Diet
By Application
Supermarkets/Hypermarkets
Convenience Stores
Independent Retailers
Online Sales
Others
Chapter 11. Asia Pacific Cherry Soda Analysis and Outlook
11.1. Asia Pacific Cherry Soda Revenue (USD Million), and Revenue (USD Million) by Segments (2021-2032)
11.1.1. Asia Pacific Cherry Soda Revenue (USD Million) by Type (2021-2032)
11.1.2. Asia Pacific Cherry Soda Revenue (USD Million) by Application (2021-2032)
11.1.3. Asia Pacific Cherry Soda Revenue (USD Million) by Product (2021-2032)
By Type
Regular
Diet
By Application
Supermarkets/Hypermarkets
Convenience Stores
Independent Retailers
Online Sales
Others
Chapter 12. South America Cherry Soda Analysis and Outlook
12.1. South America Cherry Soda Revenue (USD Million), by Segments (2021-2032)
12.1.1. South America Cherry Soda Revenue (USD Million) by Type (2021-2032)
12.1.2. South America Cherry Soda Revenue (USD Million) by Application (2021-2032)
12.1.3. South America Cherry Soda Revenue (USD Million) by Product (2021-2032)
By Type
Regular
Diet
By Application
Supermarkets/Hypermarkets
Convenience Stores
Independent Retailers
Online Sales
Others
Chapter 13. Middle East and Africa Cherry Soda Analysis and Outlook
13.1. Middle East and Africa Cherry Soda Revenue (USD Million), by Segments (2021-2032)
13.1.1. Middle East and Africa Cherry Soda Revenue (USD Million) by Type (2021-2032)
13.1.2. Middle East and Africa Cherry Soda Revenue (USD Million) by Application (2021-2032)
13.1.3. Middle East and Africa Cherry Soda Revenue (USD Million) by Product (2021-2032)
By Type
Regular
Diet
By Application
Supermarkets/Hypermarkets
Convenience Stores
Independent Retailers
Online Sales
Others
Chapter 14. Cherry Soda Company Profiles
14.1 Business Overview
14.2 Product Profiles
14.3 SWOT Profiles
14.5 Recent Developments
14.6 Financial Profile
List of Companies
AJ Stephans
Americana
Dr. Brown's
Hank's
Henry Weinhard's
Hotlips
Manhattan Special
Red Ribbon
Route 66
Stewart's
Thomas Kemper
Virgil's
15. Methodology and Data Sources
15.1 Customization Offerings
15.2 Subscription Services
15.3 Related Reports
15.4 Publisher Expertise
LIST OF TABLES
Table 1 Market Segmentation Analysis
Table 2 Global Cherry Soda Market Share of Leading Companies, 2023
Table 3 Product Offerings of Leading Companies
Table 4 Low Growth Scenario Forecasts
Table 5 Reference Case Growth Scenario
Table 6 High Growth Case Scenario
Table 7 Global Cherry Soda Revenue (USD Million) And CAGR (%) By Type (2021-2032)
Table 8 Global Cherry Soda Revenue (USD Million) And CAGR (%) By Application (2021-2032)
Table 9 Global Cherry Soda Revenue (USD Million) And CAGR (%) By Product (2021-2032)
Table 10 Global Cherry Soda Market Revenue (USD Million) By Regions (2021-2032)
Table 11 Global Cherry Soda Market Share (%) By Regions (2021-2032)
Table 12 North America Cherry Soda Revenue (USD Million) By Country (2021-2032)
Table 13 Europe Cherry Soda Revenue (USD Million) By Country (2021-2032)
Table 14 Asia Pacific Cherry Soda Revenue (USD Million) By Country (2021-2032)
Table 15 South America Cherry Soda Revenue (USD Million) By Country (2021-2032)
Table 16 Middle East and Africa Cherry Soda Revenue (USD Million) By Region (2021-2032)
Table 17 North America Cherry Soda Revenue (USD Million) By Type (2021-2032)
Table 18 North America Cherry Soda Revenue (USD Million) By Application (2021-2032)
Table 19 North America Cherry Soda Revenue (USD Million) By Product (2021-2032)
Table 20 Europe Cherry Soda Revenue (USD Million) By Type (2021-2032)
Table 21 Europe Cherry Soda Revenue (USD Million) By Application (2021-2032)
Table 22 Europe Cherry Soda Revenue (USD Million) By Product (2021-2032)
Table 23 Asia Pacific Cherry Soda Revenue (USD Million) By Type (2021-2032)
Table 24 Asia Pacific Cherry Soda Revenue (USD Million) By Application (2021-2032)
Table 25 Asia Pacific Cherry Soda Revenue (USD Million) By Product (2021-2032)
Table 26 South America Cherry Soda Revenue (USD Million) By Type (2021-2032)
Table 27 South America Cherry Soda Revenue (USD Million) By Application (2021-2032)
Table 28 South America Cherry Soda Revenue (USD Million) By Product (2021-2032)
Table 29 Middle East and Africa Cherry Soda Revenue (USD Million) By Type (2021-2032)
Table 30 Middle East and Africa Cherry Soda Revenue (USD Million) By Application (2021-2032)
Table 31 Middle East and Africa Cherry Soda Revenue (USD Million) By Product (2021-2032)
LIST OF FIGURES
Figure 1. Market Scope
Figure 2. Pricing Forecasts Per Unit, 2023- 2032
Figure 3. Porter’s Five Forces
Figure 4. Global Cherry Soda Market Revenue (USD Million) By Regions (2021-2032)
Figure 5. Global Cherry Soda Market Share (%) By Regions (2023)
Figure 6. North America Cherry Soda Revenue (USD Million) By Country (2021-2032)
Figure 7. United States Cherry Soda Revenue (USD Million) By Country (2021-2032)
Figure 8. Canada Cherry Soda Revenue (USD Million) By Country (2021-2032)
Figure 9. Mexico Cherry Soda Revenue (USD Million) By Country (2021-2032)
Figure 10. Europe Cherry Soda Revenue (USD Million) By Country (2021-2032)
Figure 11. Germany Cherry Soda Revenue (USD Million) By Country (2021-2032)
Figure 12. France Cherry Soda Revenue (USD Million) By Country (2021-2032)
Figure 13. United Kingdom Cherry Soda Revenue (USD Million) By Country (2021-2032)
Figure 14. Spain Cherry Soda Revenue (USD Million) By Country (2021-2032)
Figure 15. Italy Cherry Soda Revenue (USD Million) By Country (2021-2032)
Figure 16. Russia Cherry Soda Revenue (USD Million) By Country (2021-2032)
Figure 17. Rest of Europe Cherry Soda Revenue (USD Million) By Country (2021-2032)
Figure 11. Asia Pacific Cherry Soda Revenue (USD Million) By Country (2021-2032)
Figure 12. China Cherry Soda Revenue (USD Million) By Country (2021-2032)
Figure 13. Japan Cherry Soda Revenue (USD Million) By Country (2021-2032)
Figure 14. India Cherry Soda Revenue (USD Million) By Country (2021-2032)
Figure 15. South Korea Cherry Soda Revenue (USD Million) By Country (2021-2032)
Figure 16. Australia Cherry Soda Revenue (USD Million) By Country (2021-2032)
Figure 17. South East Asia Cherry Soda Revenue (USD Million) By Country (2021-2032)
Figure 18. South America Cherry Soda Revenue (USD Million) By Country (2021-2032)
Figure 19. Brazil Cherry Soda Revenue (USD Million) By Country (2021-2032)
Figure 20. Argentina Cherry Soda Revenue (USD Million) By Country (2021-2032)
Figure 21. Rest of Asia Pacific Cherry Soda Revenue (USD Million) By Country (2021-2032)
Figure 22. Middle East and Africa Cherry Soda Revenue (USD Million) By Region (2021-2032)
Figure 23. Saudi Arabia Cherry Soda Revenue (USD Million) By Region (2021-2032)
Figure 24. The UAE Cherry Soda Revenue (USD Million) By Region (2021-2032)
Figure 25. Rest of Middle East Cherry Soda Revenue (USD Million) By Region (2021-2032)
Figure 26. South Africa Cherry Soda Revenue (USD Million) By Region (2021-2032)
Figure 27. Africa Cherry Soda Revenue (USD Million) By Region (2021-2032)
Figure 28. North America Cherry Soda Revenue (USD Million) By Type (2021-2032)
Figure 29. North America Cherry Soda Revenue (USD Million) By Application (2021-2032)
Figure 30. North America Cherry Soda Revenue (USD Million) By Product (2021-2032)
Figure 31. Europe Cherry Soda Revenue (USD Million) By Type (2021-2032)
Figure 32. Europe Cherry Soda Revenue (USD Million) By Application (2021-2032)
Figure 33. Europe Cherry Soda Revenue (USD Million) By Product (2021-2032)
Figure 34. Asia Pacific Cherry Soda Revenue (USD Million) By Type (2021-2032)
Figure 35. Asia Pacific Cherry Soda Revenue (USD Million) By Application (2021-2032)
Figure 36. Asia Pacific Cherry Soda Revenue (USD Million) By Product (2021-2032)
Figure 37. South America Cherry Soda Revenue (USD Million) By Type (2021-2032)
Figure 38. South America Cherry Soda Revenue (USD Million) By Application (2021-2032)
Figure 39. South America Cherry Soda Revenue (USD Million) By Product (2021-2032)
Figure 40. Middle East and Africa Cherry Soda Revenue (USD Million) By Type (2021-2032)
Figure 41. Middle East and Africa Cherry Soda Revenue (USD Million) By Application (2021-2032)
Figure 42. Middle East and Africa Cherry Soda Revenue (USD Million) By Product (2021-2032)
By Type
Regular
Diet
By Application
Supermarkets/Hypermarkets
Convenience Stores
Independent Retailers
Online Sales
Others
Countries Analyzed
North America (US, Canada, Mexico)
Europe (Germany, UK, France, Spain, Italy, Russia, Rest of Europe)
Asia Pacific (China, India, Japan, South Korea, Australia, South East Asia, Rest of Asia)
South America (Brazil, Argentina, Rest of South America)
Middle East and Africa (Saudi Arabia, UAE, Rest of Middle East, South Africa, Egypt, Rest of Africa)
