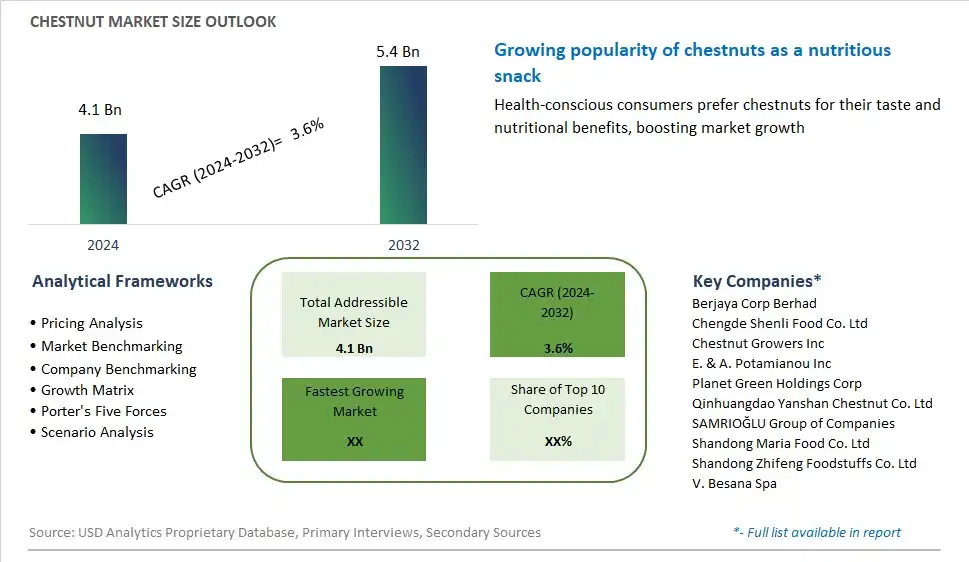
Global Chestnut Market Size is valued at $4.1 Billion in 2024 and is forecast to register a growth rate (CAGR) of 3.6% to reach $5.4 Billion by 2032.
The global Chestnut Market Comprehensive Study analyzes and forecasts the market size across 6 regions and 24 countries for diverse segments -By Type (American Chestnut, Chinese Chestnut, European Chestnut, Japanese Chestnut), By Application (Food and Beverage, Cosmetics and Personal Care, Others)
An Introduction to Chestnut Market
Chestnuts, revered for their rich flavor and versatility, are a beloved ingredient in culinary traditions around the world in 2024. With their sweet, nutty taste and creamy texture, chestnuts lend themselves to a variety of sweet and savory dishes, from hearty soups and stews to decadent desserts and holiday treats. Roasted chestnuts, a cherished winter snack, evoke feelings of warmth and nostalgia, while chestnut flour and puree offer gluten-free alternatives for baking and cooking. Beyond their culinary uses, chestnuts are also valued for their nutritional content, providing a good source of fiber, vitamins, and minerals. With an increasing focus on plant-based diets and sustainable food sources, chestnuts continue to captivate chefs, home cooks, and food enthusiasts alike, offering endless possibilities for delicious and wholesome meals.
Chestnut Competitive Landscape
The market report analyses the leading companies in the industry including Berjaya Corp Berhad, Chengde Shenli Food Co. Ltd, Chestnut Growers Inc, E. & A. Potamianou Inc, Planet Green Holdings Corp, Qinhuangdao Yanshan Chestnut Co. Ltd, SAMRIOÄžLU Group of Companies, Shandong Maria Food Co. Ltd, Shandong Zhifeng Foodstuffs Co. Ltd, V. Besana Spa, and Others.
Chestnut Market Dynamics
Chestnuts Market Trend: Increasing Demand for Healthy and Sustainable Snack Options
The market trend for Chestnuts reflects an increasing demand for healthy and sustainable snack options. As consumers prioritize health-conscious food choices and sustainable agriculture practices, there's a growing interest in nutritious snacks that offer both taste and nutritional benefits. Chestnuts, known for their rich flavor, creamy texture, and nutrient profile, are gaining popularity as a wholesome snack option that is naturally gluten-free, low in fat, and rich in vitamins, minerals, and antioxidants. This trend is driven by the rising awareness of the health benefits associated with consuming nuts and seeds, as well as the growing interest in plant-based and minimally processed foods that support overall well-being and environmental sustainability.
Market Driver: Expansion of the Plant-Based Protein Market
A significant driver of the Chestnuts market is the expansion of the plant-based protein market. With increasing concerns about sustainability, animal welfare, and health, consumers are seeking plant-based alternatives to traditional protein sources such as meat and dairy. Chestnuts, considered a valuable source of plant-based protein, are gaining traction as a meat alternative in vegetarian and vegan diets, as well as in flexitarian meal plans. The driver is fueled by the growing awareness of the environmental impact of animal agriculture, as well as the recognition of the health benefits associated with plant-based diets, including reduced risk of chronic diseases and improved overall health. As demand for plant-based protein options continues to rise, chestnuts present a promising opportunity for companies to meet the needs of health-conscious consumers seeking sustainable and nutritious food choices.
Market Opportunity: Innovation in Chestnut-Based Food Products
An opportunity in the Chestnuts market lies in innovation in chestnut-based food products to diversify offerings and attract new consumer segments. While chestnuts are commonly consumed as roasted snacks or used in traditional holiday dishes, there's potential to explore innovative product formulations and applications to expand market reach. Companies can develop a variety of chestnut-based food products such as chestnut flour for gluten-free baking, chestnut spreads and butters for toast and sandwiches, chestnut milk for dairy alternatives, and savory chestnut snacks seasoned with herbs and spices. Additionally, promoting the versatility and nutritional benefits of chestnuts through marketing campaigns and educational initiatives can raise consumer awareness and drive adoption of chestnut-based food products across different culinary traditions and dietary preferences. By capitalizing on the versatility and nutritional benefits of chestnuts, companies can unlock new market opportunities and cater to evolving consumer tastes and preferences in the plant-based food market.
Chestnuts Market Share Analysis: European Chestnut held the dominant market share in 2024
In the diverse spectrum of chestnuts, the European Chestnut segment is the largest, commanding prominence due to its widespread cultivation, rich flavor profile, and versatile culinary applications. European chestnuts are renowned for their sweet and nutty taste, making them a favored choice for both savory and sweet dishes in cuisines around the world. These chestnuts are prized for their large size, smooth texture, and ease of peeling, enhancing their appeal to consumers and chefs alike. Further, European chestnuts are commonly used in traditional holiday recipes such as stuffing, desserts, and roasted chestnuts, further driving their demand. Additionally, the established infrastructure and centuries-old cultivation practices associated with European chestnuts ensure consistent quality and availability, solidifying their dominance in the market. While American, Chinese, and Japanese chestnuts offer unique flavors and textures, the European Chestnut segment maintains its stronghold as the largest in the chestnuts market, shaping consumer preferences and culinary traditions globally.
Chestnuts Market Share Analysis: Cosmetics and Personal Care market is poised to register the fastest growth rae over the forecast period to 2032
Among the segments of the chestnuts market, the Cosmetics and Personal Care segment is the fastest-growing, driven by the increasing demand for natural and sustainable ingredients in skincare and beauty products. Chestnut extracts and oils are prized for their antioxidant-rich properties, including vitamins B and C, flavonoids, and tannins, which offer numerous benefits for skin health and rejuvenation. As consumers become more conscious of the ingredients in their skincare regimen, they are turning to chestnut-based formulations for their moisturizing, anti-inflammatory, and anti-aging effects. Further, the versatility of chestnut extracts allows their incorporation into various cosmetic and personal care products, including moisturizers, serums, hair care products, and bath and body items, catering to diverse consumer needs and preferences. Additionally, the growing trend towards clean beauty and eco-friendly products further drives the demand for chestnut-based cosmetics and personal care items. As consumers prioritize natural and effective solutions for their skincare and grooming routines, the Cosmetics and Personal Care segment of the chestnuts market stands poised for continued expansion, reshaping the landscape of the beauty and personal care industry.
Chestnut Market Segmentation
By Type
American Chestnut
Chinese Chestnut
European Chestnut
Japanese Chestnut
By Application
Food and Beverage
Cosmetics and Personal Care
Others
Countries Analyzed
North America (US, Canada, Mexico)
Europe (Germany, UK, France, Spain, Italy, Russia, Rest of Europe)
Asia Pacific (China, India, Japan, South Korea, Australia, South East Asia, Rest of Asia)
South America (Brazil, Argentina, Rest of South America)
Middle East and Africa (Saudi Arabia, UAE, Rest of Middle East, South Africa, Egypt, Rest of Africa)
Chestnut Companies Profiled in the Study
Berjaya Corp Berhad
Chengde Shenli Food Co. Ltd
Chestnut Growers Inc
E. & A. Potamianou Inc
Planet Green Holdings Corp
Qinhuangdao Yanshan Chestnut Co. Ltd
SAMRIOÄžLU Group of Companies
Shandong Maria Food Co. Ltd
Shandong Zhifeng Foodstuffs Co. Ltd
V. Besana Spa
*- List Not Exhaustive
Chapter 1. TABLE OF CONTENTS
Chapter 2. Introduction to Chestnut Market
2.1. Market Overview
2.2. Key Statistics and Report Highlights
2.3. Scope of the Comprehensive Study
2.3.1. Market Definition
2.3.2 Countries and Regions Covered
2.3.3 Research Objective
2.3.4 Units, Currency, and Conversions
2.3.5 Industry Value Chain
2.4. Key Market Segments
2.5. Key Companies
2.6. Study Period
Chapter 3. Strategic Analysis Review
3.1. Chestnut Pricing Analysis and Forecast
3.2. Porter’s Five Forces
3.3. Market Ecosystem
3.4. SWOT Analysis
3.5. Regulatory Scenario
3.3. Effects of Inflation, Russia-Ukraine War, moderating economic growth, and other macroeconomic factors
Chapter 4. Competitive Landscape
4.1. Market Share Analysis
4.1.1. Global Chestnut Market Share by Company, 2023
4.1.2. Product Offerings of Leading Chestnut Companies
4.2. Market Entropy
4.2.1. New Product Launches in the Industry
4.2.2. Mergers, Acquisitions, Joint ventures, and Partnerships
4.3. Key Strategies and Best Practices
Chapter 5. Global Market Projections: Best, Reference, and Low Case Scenarios
5.1. Growth Analysis- Case Scenario Definitions
5.2. Low Growth Case Scenario Forecasts
5.3. Reference Growth Case Scenario Forecasts
5.4. High Growth Case Scenario Forecasts
Chapter 6. Market Dynamics
6.1. Chestnut Market Drivers
6.2. Chestnut Market Challenges
6.6. Chestnut Market Opportunities
6.4. Chestnut Market Trends
Chapter 7. Global Chestnut Market Outlook Trends
7.1. Global Chestnut Revenue (USD Million) and CAGR (%) by Type (2021-2032)
7.2. Global Chestnut Revenue (USD Million) and CAGR (%) by Application (2021-2032)
7.3. Global Chestnut Revenue (USD Million) and CAGR (%) by Product (2021-2032)
By Type
American Chestnut
Chinese Chestnut
European Chestnut
Japanese Chestnut
By Application
Food and Beverage
Cosmetics and Personal Care
Others
Chapter 8. Global Chestnut Regional Analysis and Outlook
8.1. Global Chestnut Revenue (USD Million) By Regions (2021- 2032)
8.2. North America Chestnut Revenue (USD Million) by Country (2021-2032)
8.2.1. United States Chestnut Regional Analysis and Outlook
8.2.2. Canada Chestnut Regional Analysis and Outlook
8.2.3. Mexico Chestnut Regional Analysis and Outlook
8.3. Europe Chestnut Revenue (USD Million), by Country (2021-2032)
8.3.1. Germany Chestnut Regional Analysis and Outlook
8.3.2. France Chestnut Regional Analysis and Outlook
8.3.3. United Kingdom Chestnut Regional Analysis and Outlook
8.3.4. Spain Chestnut Regional Analysis and Outlook
8.3.5. Italy Chestnut Regional Analysis and Outlook
8.3.6. Russia Chestnut Regional Analysis and Outlook
8.3.7. Rest of Europe Chestnut Regional Analysis and Outlook
8.4. Asia Pacific Chestnut Revenue (USD Million) by Country (2021-2032)
8.4.1. China Chestnut Regional Analysis and Outlook
8.4.2. Japan Chestnut Regional Analysis and Outlook
8.4.3. India Chestnut Regional Analysis and Outlook
8.4.4. South Korea Chestnut Regional Analysis and Outlook
8.4.5. Australia Chestnut Regional Analysis and Outlook
8.4.6. South East Asia Chestnut Regional Analysis and Outlook
8.4.7. Rest of Asia Pacific Chestnut Regional Analysis and Outlook
8.5. South America Chestnut Revenue (USD Million), by Country (2021-2032)
8.5.1. Brazil Chestnut Regional Analysis and Outlook
8.5.2. Argentina Chestnut Regional Analysis and Outlook
8.5.3. Rest of South America Chestnut Regional Analysis and Outlook
8.6. Middle East and Africa Chestnut Revenue (USD Million) by Country (2021-2032)
8.6.1. Middle East Chestnut Regional Analysis and Outlook
8.6.2. Africa Chestnut Regional Analysis and Outlook
Chapter 9. North America Chestnut Analysis and Outlook
9.1. North America Chestnut Revenue (USD Million) by Segments (2021-2032)
9.1.1. North America Chestnut Revenue (USD Million) by Type (2021-2032)
9.1.2. North America Chestnut Revenue (USD Million) by Application (2021-2032)
9.1.3. North America Chestnut Revenue (USD Million) by Product (2021-2032)
By Type
American Chestnut
Chinese Chestnut
European Chestnut
Japanese Chestnut
By Application
Food and Beverage
Cosmetics and Personal Care
Others
Chapter 10. Europe Chestnut Analysis and Outlook
10.1. Europe Chestnut Revenue (USD Million), by Segments (USD Million) (2021-2032)
10.1.1. Europe Chestnut Revenue (USD Million) by Type (2021-2032)
10.1.2. Europe Chestnut Revenue (USD Million) by Application (2021-2032)
10.1.3. Europe Chestnut Revenue (USD Million) by Product (2021-2032)
By Type
American Chestnut
Chinese Chestnut
European Chestnut
Japanese Chestnut
By Application
Food and Beverage
Cosmetics and Personal Care
Others
Chapter 11. Asia Pacific Chestnut Analysis and Outlook
11.1. Asia Pacific Chestnut Revenue (USD Million), and Revenue (USD Million) by Segments (2021-2032)
11.1.1. Asia Pacific Chestnut Revenue (USD Million) by Type (2021-2032)
11.1.2. Asia Pacific Chestnut Revenue (USD Million) by Application (2021-2032)
11.1.3. Asia Pacific Chestnut Revenue (USD Million) by Product (2021-2032)
By Type
American Chestnut
Chinese Chestnut
European Chestnut
Japanese Chestnut
By Application
Food and Beverage
Cosmetics and Personal Care
Others
Chapter 12. South America Chestnut Analysis and Outlook
12.1. South America Chestnut Revenue (USD Million), by Segments (2021-2032)
12.1.1. South America Chestnut Revenue (USD Million) by Type (2021-2032)
12.1.2. South America Chestnut Revenue (USD Million) by Application (2021-2032)
12.1.3. South America Chestnut Revenue (USD Million) by Product (2021-2032)
By Type
American Chestnut
Chinese Chestnut
European Chestnut
Japanese Chestnut
By Application
Food and Beverage
Cosmetics and Personal Care
Others
Chapter 13. Middle East and Africa Chestnut Analysis and Outlook
13.1. Middle East and Africa Chestnut Revenue (USD Million), by Segments (2021-2032)
13.1.1. Middle East and Africa Chestnut Revenue (USD Million) by Type (2021-2032)
13.1.2. Middle East and Africa Chestnut Revenue (USD Million) by Application (2021-2032)
13.1.3. Middle East and Africa Chestnut Revenue (USD Million) by Product (2021-2032)
By Type
American Chestnut
Chinese Chestnut
European Chestnut
Japanese Chestnut
By Application
Food and Beverage
Cosmetics and Personal Care
Others
Chapter 14. Chestnut Company Profiles
14.1 Business Overview
14.2 Product Profiles
14.3 SWOT Profiles
14.5 Recent Developments
14.6 Financial Profile
List of Companies
Berjaya Corp Berhad
Chengde Shenli Food Co. Ltd
Chestnut Growers Inc
E. & A. Potamianou Inc
Planet Green Holdings Corp
Qinhuangdao Yanshan Chestnut Co. Ltd
SAMRIOÄžLU Group of Companies
Shandong Maria Food Co. Ltd
Shandong Zhifeng Foodstuffs Co. Ltd
V. Besana Spa
15. Methodology and Data Sources
15.1 Customization Offerings
15.2 Subscription Services
15.3 Related Reports
15.4 Publisher Expertise
LIST OF TABLES
Table 1 Market Segmentation Analysis
Table 2 Global Chestnut Market Share of Leading Companies, 2023
Table 3 Product Offerings of Leading Companies
Table 4 Low Growth Scenario Forecasts
Table 5 Reference Case Growth Scenario
Table 6 High Growth Case Scenario
Table 7 Global Chestnut Revenue (USD Million) And CAGR (%) By Type (2021-2032)
Table 8 Global Chestnut Revenue (USD Million) And CAGR (%) By Application (2021-2032)
Table 9 Global Chestnut Revenue (USD Million) And CAGR (%) By Product (2021-2032)
Table 10 Global Chestnut Market Revenue (USD Million) By Regions (2021-2032)
Table 11 Global Chestnut Market Share (%) By Regions (2021-2032)
Table 12 North America Chestnut Revenue (USD Million) By Country (2021-2032)
Table 13 Europe Chestnut Revenue (USD Million) By Country (2021-2032)
Table 14 Asia Pacific Chestnut Revenue (USD Million) By Country (2021-2032)
Table 15 South America Chestnut Revenue (USD Million) By Country (2021-2032)
Table 16 Middle East and Africa Chestnut Revenue (USD Million) By Region (2021-2032)
Table 17 North America Chestnut Revenue (USD Million) By Type (2021-2032)
Table 18 North America Chestnut Revenue (USD Million) By Application (2021-2032)
Table 19 North America Chestnut Revenue (USD Million) By Product (2021-2032)
Table 20 Europe Chestnut Revenue (USD Million) By Type (2021-2032)
Table 21 Europe Chestnut Revenue (USD Million) By Application (2021-2032)
Table 22 Europe Chestnut Revenue (USD Million) By Product (2021-2032)
Table 23 Asia Pacific Chestnut Revenue (USD Million) By Type (2021-2032)
Table 24 Asia Pacific Chestnut Revenue (USD Million) By Application (2021-2032)
Table 25 Asia Pacific Chestnut Revenue (USD Million) By Product (2021-2032)
Table 26 South America Chestnut Revenue (USD Million) By Type (2021-2032)
Table 27 South America Chestnut Revenue (USD Million) By Application (2021-2032)
Table 28 South America Chestnut Revenue (USD Million) By Product (2021-2032)
Table 29 Middle East and Africa Chestnut Revenue (USD Million) By Type (2021-2032)
Table 30 Middle East and Africa Chestnut Revenue (USD Million) By Application (2021-2032)
Table 31 Middle East and Africa Chestnut Revenue (USD Million) By Product (2021-2032)
LIST OF FIGURES
Figure 1. Market Scope
Figure 2. Pricing Forecasts Per Unit, 2023- 2032
Figure 3. Porter’s Five Forces
Figure 4. Global Chestnut Market Revenue (USD Million) By Regions (2021-2032)
Figure 5. Global Chestnut Market Share (%) By Regions (2023)
Figure 6. North America Chestnut Revenue (USD Million) By Country (2021-2032)
Figure 7. United States Chestnut Revenue (USD Million) By Country (2021-2032)
Figure 8. Canada Chestnut Revenue (USD Million) By Country (2021-2032)
Figure 9. Mexico Chestnut Revenue (USD Million) By Country (2021-2032)
Figure 10. Europe Chestnut Revenue (USD Million) By Country (2021-2032)
Figure 11. Germany Chestnut Revenue (USD Million) By Country (2021-2032)
Figure 12. France Chestnut Revenue (USD Million) By Country (2021-2032)
Figure 13. United Kingdom Chestnut Revenue (USD Million) By Country (2021-2032)
Figure 14. Spain Chestnut Revenue (USD Million) By Country (2021-2032)
Figure 15. Italy Chestnut Revenue (USD Million) By Country (2021-2032)
Figure 16. Russia Chestnut Revenue (USD Million) By Country (2021-2032)
Figure 17. Rest of Europe Chestnut Revenue (USD Million) By Country (2021-2032)
Figure 11. Asia Pacific Chestnut Revenue (USD Million) By Country (2021-2032)
Figure 12. China Chestnut Revenue (USD Million) By Country (2021-2032)
Figure 13. Japan Chestnut Revenue (USD Million) By Country (2021-2032)
Figure 14. India Chestnut Revenue (USD Million) By Country (2021-2032)
Figure 15. South Korea Chestnut Revenue (USD Million) By Country (2021-2032)
Figure 16. Australia Chestnut Revenue (USD Million) By Country (2021-2032)
Figure 17. South East Asia Chestnut Revenue (USD Million) By Country (2021-2032)
Figure 18. South America Chestnut Revenue (USD Million) By Country (2021-2032)
Figure 19. Brazil Chestnut Revenue (USD Million) By Country (2021-2032)
Figure 20. Argentina Chestnut Revenue (USD Million) By Country (2021-2032)
Figure 21. Rest of Asia Pacific Chestnut Revenue (USD Million) By Country (2021-2032)
Figure 22. Middle East and Africa Chestnut Revenue (USD Million) By Region (2021-2032)
Figure 23. Saudi Arabia Chestnut Revenue (USD Million) By Region (2021-2032)
Figure 24. The UAE Chestnut Revenue (USD Million) By Region (2021-2032)
Figure 25. Rest of Middle East Chestnut Revenue (USD Million) By Region (2021-2032)
Figure 26. South Africa Chestnut Revenue (USD Million) By Region (2021-2032)
Figure 27. Africa Chestnut Revenue (USD Million) By Region (2021-2032)
Figure 28. North America Chestnut Revenue (USD Million) By Type (2021-2032)
Figure 29. North America Chestnut Revenue (USD Million) By Application (2021-2032)
Figure 30. North America Chestnut Revenue (USD Million) By Product (2021-2032)
Figure 31. Europe Chestnut Revenue (USD Million) By Type (2021-2032)
Figure 32. Europe Chestnut Revenue (USD Million) By Application (2021-2032)
Figure 33. Europe Chestnut Revenue (USD Million) By Product (2021-2032)
Figure 34. Asia Pacific Chestnut Revenue (USD Million) By Type (2021-2032)
Figure 35. Asia Pacific Chestnut Revenue (USD Million) By Application (2021-2032)
Figure 36. Asia Pacific Chestnut Revenue (USD Million) By Product (2021-2032)
Figure 37. South America Chestnut Revenue (USD Million) By Type (2021-2032)
Figure 38. South America Chestnut Revenue (USD Million) By Application (2021-2032)
Figure 39. South America Chestnut Revenue (USD Million) By Product (2021-2032)
Figure 40. Middle East and Africa Chestnut Revenue (USD Million) By Type (2021-2032)
Figure 41. Middle East and Africa Chestnut Revenue (USD Million) By Application (2021-2032)
Figure 42. Middle East and Africa Chestnut Revenue (USD Million) By Product (2021-2032)
By Type
American Chestnut
Chinese Chestnut
European Chestnut
Japanese Chestnut
By Application
Food and Beverage
Cosmetics and Personal Care
Others
Countries Analyzed
North America (US, Canada, Mexico)
Europe (Germany, UK, France, Spain, Italy, Russia, Rest of Europe)
Asia Pacific (China, India, Japan, South Korea, Australia, South East Asia, Rest of Asia)
South America (Brazil, Argentina, Rest of South America)
Middle East and Africa (Saudi Arabia, UAE, Rest of Middle East, South Africa, Egypt, Rest of Africa)
