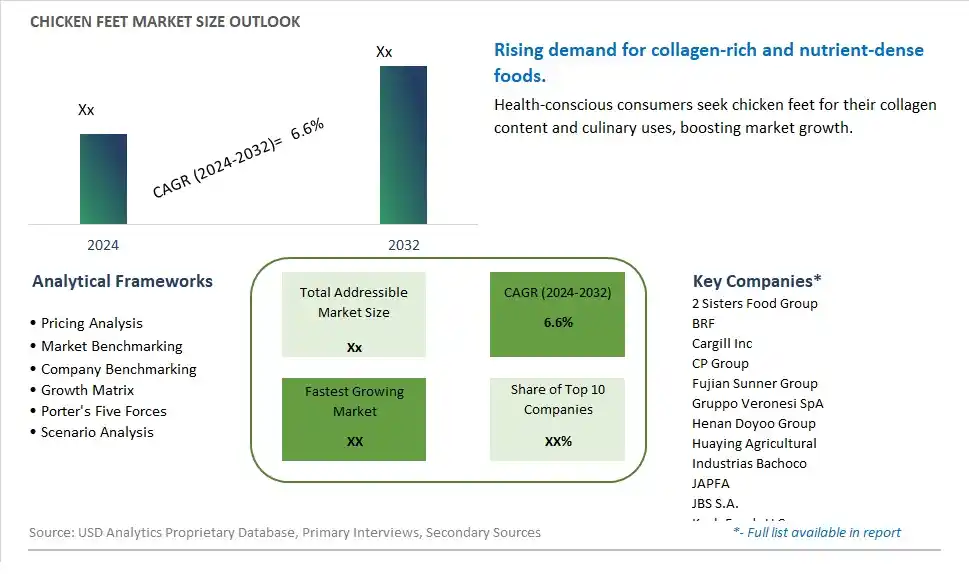
Global Chicken Feet Market Size is valued at $XX Million in 2024 and is forecast to register a growth rate (CAGR) of 6.6% to reach $XX Million by 2032.
The global Chicken Feet Market Comprehensive Study analyzes and forecasts the market size across 6 regions and 24 countries for diverse segments -By Type (Raw, Processed), By Application (Retails, Foodservices, Food Processing)
An Introduction to Chicken Feet Market
In 2024, the Chicken Feet market is witnessing significant growth, driven by the increasing demand for nutrient-dense and versatile poultry products. Chicken feet, rich in collagen and other essential nutrients, are popular in various culinary traditions, especially in Asian cuisine. The market is supported by the growing awareness of the health benefits of collagen and the trend towards utilizing whole animal products. Advances in processing and packaging technologies are enhancing the quality, safety, and shelf life of chicken feet. The market is also benefiting from the trend towards clean-label and natural poultry products, appealing to health-conscious consumers seeking nutritious and authentic food options.
Chicken Feet Competitive Landscape
The market report analyses the leading companies in the industry including 2 Sisters Food Group, BRF, Cargill Inc, CP Group, Fujian Sunner Group, Gruppo Veronesi SpA, Henan Doyoo Group, Huaying Agricultural, Industrias Bachoco, JAPFA, JBS S.A., Koch Foods LLC, LDC, Mountaire Farms Inc, New Hope Liuhe, OSI Group LLC, Perdue Farms Inc, PHW Group, Plukon Food Group, PRIOSKOLYE, San Miguel Pure Foods, Sanderson Farms Inc, Suguna Foods, The Arab Company for Livestock Development, Tyson Foods, Wayne Farms LLC, Wen's Food Group, and Others.
Chicken Feet Market Dynamics
Chicken Feet Market Trend: Rising Demand for Sustainable and Nose-to-Tail Eating
A prominent market trend for chicken feet is the rising demand for sustainable and nose-to-tail eating practices among consumers. With increased awareness of food waste and environmental concerns, there's a growing interest in utilizing all parts of the animal, including chicken feet, in culinary preparations. This trend reflects a broader movement towards sustainability, resourcefulness, and appreciation for traditional and cultural food practices.
Chicken Feet Market Driver: Demand for Collagen-Rich and Nutrient-Dense Foods
A key driver fueling the market for chicken feet is the demand for collagen-rich and nutrient-dense foods. Chicken feet are prized for their collagen content, which offers potential health benefits such as improved skin elasticity, joint health, and digestive support. As consumers prioritize functional foods and seek natural sources of nutrients, chicken feet gain appeal as a culinary ingredient that contributes to overall health and well-being.
Chicken Feet Market Opportunity: Expansion into Ethnic Cuisines and Culinary Innovation
An opportunity within the chicken feet market lies in expanding its presence into ethnic cuisines and driving culinary innovation. Manufacturers and restaurants can explore incorporating chicken feet into traditional dishes from cultures where they are considered a delicacy, such as Chinese, Korean, Mexican, and Caribbean cuisines. Additionally, innovating new recipes and preparations for chicken feet, such as marinated, grilled, fried, or stewed variations, can attract adventurous eaters and introduce chicken feet to new consumer segments. By leveraging its nutritional benefits and versatility in cooking, chicken feet can carve out a niche in the culinary landscape and appeal to diverse tastes and preferences.
Chicken Feet Market Share Analysis: Processed segment generated the highest revenue share in the industry
The Processed segment emerges as the largest in the Chicken Feet market by type. This segment's prominence is attributed to several factors including consumer preferences, convenience, and culinary applications. Processed chicken feet undergo various preparation methods such as cleaning, blanching, and sometimes seasoning or marination before being sold to consumers or foodservice establishments. Processed chicken feet are favored in many cuisines worldwide, particularly in Asian and Latin American cultures, where they are used in soups, stews, and as a popular snack item. The processing of chicken feet enhances their appeal by improving hygiene, reducing preparation time for cooking, and enhancing flavor through seasoning or cooking techniques. Further, processed chicken feet are often packaged for retail distribution or sold directly to food processors and restaurants, catering to both domestic and international markets. Despite the availability of raw chicken feet for specialized culinary uses, the processed segment's convenience and wider acceptance in global culinary practices contribute significantly to its dominant position in the Chicken Feet market. As consumer awareness of exotic meats and global culinary trends continues to grow, the processed segment is expected to maintain its leadership, driven by expanding foodservice demand and innovative product offerings that cater to diverse culinary preferences and dietary traditions.
Chicken Feet Market Share Analysis: Food Processing is the fastest growing segment over the forecast period to 2032
The Food Processing segment is anticipated to be the fastest growing in the Chicken Feet market by application through 2032. This growth is driven by increasing demand from food processors and manufacturers who use chicken feet as a key ingredient in various processed food products. Chicken feet are valued for their collagen content, which contributes to gelatinous textures and enhances mouthfeel in soups, broths, and sauces. The Food Processing segment benefits from technological advancements in food production, enabling efficient processing and packaging of chicken feet for global distribution. Further, rising consumer awareness of collagen-rich foods and their health benefits, such as joint health and skin elasticity, further drives the demand for processed chicken feet in the food processing industry. Food processors incorporate chicken feet into diverse product categories, including ready-to-eat meals, snacks, and pet foods, leveraging their nutritional benefits and culinary versatility. As food processing technologies evolve and consumer preferences for natural, protein-rich ingredients continue to expand, the Food Processing segment in the Chicken Feet market is poised for significant growth, supported by innovation in product formulations and strategic partnerships that enhance market penetration and product differentiation.
Chicken Feet Market Segmentation
By Type
Raw
Processed
By Application
Retails
Foodservices
Food Processing
Countries Analyzed
North America (US, Canada, Mexico)
Europe (Germany, UK, France, Spain, Italy, Russia, Rest of Europe)
Asia Pacific (China, India, Japan, South Korea, Australia, South East Asia, Rest of Asia)
South America (Brazil, Argentina, Rest of South America)
Middle East and Africa (Saudi Arabia, UAE, Rest of Middle East, South Africa, Egypt, Rest of Africa)
Chicken Feet Companies Profiled in the Study
2 Sisters Food Group
BRF
Cargill Inc
CP Group
Fujian Sunner Group
Gruppo Veronesi SpA
Henan Doyoo Group
Huaying Agricultural
Industrias Bachoco
JAPFA
JBS S.A.
Koch Foods LLC
LDC
Mountaire Farms Inc
New Hope Liuhe
OSI Group LLC
Perdue Farms Inc
PHW Group
Plukon Food Group
PRIOSKOLYE
San Miguel Pure Foods
Sanderson Farms Inc
Suguna Foods
The Arab Company for Livestock Development
Tyson Foods
Wayne Farms LLC
Wen's Food Group
*- List Not Exhaustive
Chapter 1. TABLE OF CONTENTS
Chapter 2. Introduction to Chicken Feet Market
2.1. Market Overview
2.2. Key Statistics and Report Highlights
2.3. Scope of the Comprehensive Study
2.3.1. Market Definition
2.3.2 Countries and Regions Covered
2.3.3 Research Objective
2.3.4 Units, Currency, and Conversions
2.3.5 Industry Value Chain
2.4. Key Market Segments
2.5. Key Companies
2.6. Study Period
Chapter 3. Strategic Analysis Review
3.1. Chicken Feet Pricing Analysis and Forecast
3.2. Porter’s Five Forces
3.3. Market Ecosystem
3.4. SWOT Analysis
3.5. Regulatory Scenario
3.3. Effects of Inflation, Russia-Ukraine War, moderating economic growth, and other macroeconomic factors
Chapter 4. Competitive Landscape
4.1. Market Share Analysis
4.1.1. Global Chicken Feet Market Share by Company, 2023
4.1.2. Product Offerings of Leading Chicken Feet Companies
4.2. Market Entropy
4.2.1. New Product Launches in the Industry
4.2.2. Mergers, Acquisitions, Joint ventures, and Partnerships
4.3. Key Strategies and Best Practices
Chapter 5. Global Market Projections: Best, Reference, and Low Case Scenarios
5.1. Growth Analysis- Case Scenario Definitions
5.2. Low Growth Case Scenario Forecasts
5.3. Reference Growth Case Scenario Forecasts
5.4. High Growth Case Scenario Forecasts
Chapter 6. Market Dynamics
6.1. Chicken Feet Market Drivers
6.2. Chicken Feet Market Challenges
6.6. Chicken Feet Market Opportunities
6.4. Chicken Feet Market Trends
Chapter 7. Global Chicken Feet Market Outlook Trends
7.1. Global Chicken Feet Revenue (USD Million) and CAGR (%) by Type (2021-2032)
7.2. Global Chicken Feet Revenue (USD Million) and CAGR (%) by Application (2021-2032)
7.3. Global Chicken Feet Revenue (USD Million) and CAGR (%) by Product (2021-2032)
By Type
Raw
Processed
By Application
Retails
Foodservices
Food Processing
Chapter 8. Global Chicken Feet Regional Analysis and Outlook
8.1. Global Chicken Feet Revenue (USD Million) By Regions (2021- 2032)
8.2. North America Chicken Feet Revenue (USD Million) by Country (2021-2032)
8.2.1. United States Chicken Feet Regional Analysis and Outlook
8.2.2. Canada Chicken Feet Regional Analysis and Outlook
8.2.3. Mexico Chicken Feet Regional Analysis and Outlook
8.3. Europe Chicken Feet Revenue (USD Million), by Country (2021-2032)
8.3.1. Germany Chicken Feet Regional Analysis and Outlook
8.3.2. France Chicken Feet Regional Analysis and Outlook
8.3.3. United Kingdom Chicken Feet Regional Analysis and Outlook
8.3.4. Spain Chicken Feet Regional Analysis and Outlook
8.3.5. Italy Chicken Feet Regional Analysis and Outlook
8.3.6. Russia Chicken Feet Regional Analysis and Outlook
8.3.7. Rest of Europe Chicken Feet Regional Analysis and Outlook
8.4. Asia Pacific Chicken Feet Revenue (USD Million) by Country (2021-2032)
8.4.1. China Chicken Feet Regional Analysis and Outlook
8.4.2. Japan Chicken Feet Regional Analysis and Outlook
8.4.3. India Chicken Feet Regional Analysis and Outlook
8.4.4. South Korea Chicken Feet Regional Analysis and Outlook
8.4.5. Australia Chicken Feet Regional Analysis and Outlook
8.4.6. South East Asia Chicken Feet Regional Analysis and Outlook
8.4.7. Rest of Asia Pacific Chicken Feet Regional Analysis and Outlook
8.5. South America Chicken Feet Revenue (USD Million), by Country (2021-2032)
8.5.1. Brazil Chicken Feet Regional Analysis and Outlook
8.5.2. Argentina Chicken Feet Regional Analysis and Outlook
8.5.3. Rest of South America Chicken Feet Regional Analysis and Outlook
8.6. Middle East and Africa Chicken Feet Revenue (USD Million) by Country (2021-2032)
8.6.1. Middle East Chicken Feet Regional Analysis and Outlook
8.6.2. Africa Chicken Feet Regional Analysis and Outlook
Chapter 9. North America Chicken Feet Analysis and Outlook
9.1. North America Chicken Feet Revenue (USD Million) by Segments (2021-2032)
9.1.1. North America Chicken Feet Revenue (USD Million) by Type (2021-2032)
9.1.2. North America Chicken Feet Revenue (USD Million) by Application (2021-2032)
9.1.3. North America Chicken Feet Revenue (USD Million) by Product (2021-2032)
By Type
Raw
Processed
By Application
Retails
Foodservices
Food Processing
Chapter 10. Europe Chicken Feet Analysis and Outlook
10.1. Europe Chicken Feet Revenue (USD Million), by Segments (USD Million) (2021-2032)
10.1.1. Europe Chicken Feet Revenue (USD Million) by Type (2021-2032)
10.1.2. Europe Chicken Feet Revenue (USD Million) by Application (2021-2032)
10.1.3. Europe Chicken Feet Revenue (USD Million) by Product (2021-2032)
By Type
Raw
Processed
By Application
Retails
Foodservices
Food Processing
Chapter 11. Asia Pacific Chicken Feet Analysis and Outlook
11.1. Asia Pacific Chicken Feet Revenue (USD Million), and Revenue (USD Million) by Segments (2021-2032)
11.1.1. Asia Pacific Chicken Feet Revenue (USD Million) by Type (2021-2032)
11.1.2. Asia Pacific Chicken Feet Revenue (USD Million) by Application (2021-2032)
11.1.3. Asia Pacific Chicken Feet Revenue (USD Million) by Product (2021-2032)
By Type
Raw
Processed
By Application
Retails
Foodservices
Food Processing
Chapter 12. South America Chicken Feet Analysis and Outlook
12.1. South America Chicken Feet Revenue (USD Million), by Segments (2021-2032)
12.1.1. South America Chicken Feet Revenue (USD Million) by Type (2021-2032)
12.1.2. South America Chicken Feet Revenue (USD Million) by Application (2021-2032)
12.1.3. South America Chicken Feet Revenue (USD Million) by Product (2021-2032)
By Type
Raw
Processed
By Application
Retails
Foodservices
Food Processing
Chapter 13. Middle East and Africa Chicken Feet Analysis and Outlook
13.1. Middle East and Africa Chicken Feet Revenue (USD Million), by Segments (2021-2032)
13.1.1. Middle East and Africa Chicken Feet Revenue (USD Million) by Type (2021-2032)
13.1.2. Middle East and Africa Chicken Feet Revenue (USD Million) by Application (2021-2032)
13.1.3. Middle East and Africa Chicken Feet Revenue (USD Million) by Product (2021-2032)
By Type
Raw
Processed
By Application
Retails
Foodservices
Food Processing
Chapter 14. Chicken Feet Company Profiles
14.1 Business Overview
14.2 Product Profiles
14.3 SWOT Profiles
14.5 Recent Developments
14.6 Financial Profile
List of Companies
2 Sisters Food Group
BRF
Cargill Inc
CP Group
Fujian Sunner Group
Gruppo Veronesi SpA
Henan Doyoo Group
Huaying Agricultural
Industrias Bachoco
JAPFA
JBS S.A.
Koch Foods LLC
LDC
Mountaire Farms Inc
New Hope Liuhe
OSI Group LLC
Perdue Farms Inc
PHW Group
Plukon Food Group
PRIOSKOLYE
San Miguel Pure Foods
Sanderson Farms Inc
Suguna Foods
The Arab Company for Livestock Development
Tyson Foods
Wayne Farms LLC
Wen's Food Group
15. Methodology and Data Sources
15.1 Customization Offerings
15.2 Subscription Services
15.3 Related Reports
15.4 Publisher Expertise
LIST OF TABLES
Table 1 Market Segmentation Analysis
Table 2 Global Chicken Feet Market Share of Leading Companies, 2023
Table 3 Product Offerings of Leading Companies
Table 4 Low Growth Scenario Forecasts
Table 5 Reference Case Growth Scenario
Table 6 High Growth Case Scenario
Table 7 Global Chicken Feet Revenue (USD Million) And CAGR (%) By Type (2021-2032)
Table 8 Global Chicken Feet Revenue (USD Million) And CAGR (%) By Application (2021-2032)
Table 9 Global Chicken Feet Revenue (USD Million) And CAGR (%) By Product (2021-2032)
Table 10 Global Chicken Feet Market Revenue (USD Million) By Regions (2021-2032)
Table 11 Global Chicken Feet Market Share (%) By Regions (2021-2032)
Table 12 North America Chicken Feet Revenue (USD Million) By Country (2021-2032)
Table 13 Europe Chicken Feet Revenue (USD Million) By Country (2021-2032)
Table 14 Asia Pacific Chicken Feet Revenue (USD Million) By Country (2021-2032)
Table 15 South America Chicken Feet Revenue (USD Million) By Country (2021-2032)
Table 16 Middle East and Africa Chicken Feet Revenue (USD Million) By Region (2021-2032)
Table 17 North America Chicken Feet Revenue (USD Million) By Type (2021-2032)
Table 18 North America Chicken Feet Revenue (USD Million) By Application (2021-2032)
Table 19 North America Chicken Feet Revenue (USD Million) By Product (2021-2032)
Table 20 Europe Chicken Feet Revenue (USD Million) By Type (2021-2032)
Table 21 Europe Chicken Feet Revenue (USD Million) By Application (2021-2032)
Table 22 Europe Chicken Feet Revenue (USD Million) By Product (2021-2032)
Table 23 Asia Pacific Chicken Feet Revenue (USD Million) By Type (2021-2032)
Table 24 Asia Pacific Chicken Feet Revenue (USD Million) By Application (2021-2032)
Table 25 Asia Pacific Chicken Feet Revenue (USD Million) By Product (2021-2032)
Table 26 South America Chicken Feet Revenue (USD Million) By Type (2021-2032)
Table 27 South America Chicken Feet Revenue (USD Million) By Application (2021-2032)
Table 28 South America Chicken Feet Revenue (USD Million) By Product (2021-2032)
Table 29 Middle East and Africa Chicken Feet Revenue (USD Million) By Type (2021-2032)
Table 30 Middle East and Africa Chicken Feet Revenue (USD Million) By Application (2021-2032)
Table 31 Middle East and Africa Chicken Feet Revenue (USD Million) By Product (2021-2032)
LIST OF FIGURES
Figure 1. Market Scope
Figure 2. Pricing Forecasts Per Unit, 2023- 2032
Figure 3. Porter’s Five Forces
Figure 4. Global Chicken Feet Market Revenue (USD Million) By Regions (2021-2032)
Figure 5. Global Chicken Feet Market Share (%) By Regions (2023)
Figure 6. North America Chicken Feet Revenue (USD Million) By Country (2021-2032)
Figure 7. United States Chicken Feet Revenue (USD Million) By Country (2021-2032)
Figure 8. Canada Chicken Feet Revenue (USD Million) By Country (2021-2032)
Figure 9. Mexico Chicken Feet Revenue (USD Million) By Country (2021-2032)
Figure 10. Europe Chicken Feet Revenue (USD Million) By Country (2021-2032)
Figure 11. Germany Chicken Feet Revenue (USD Million) By Country (2021-2032)
Figure 12. France Chicken Feet Revenue (USD Million) By Country (2021-2032)
Figure 13. United Kingdom Chicken Feet Revenue (USD Million) By Country (2021-2032)
Figure 14. Spain Chicken Feet Revenue (USD Million) By Country (2021-2032)
Figure 15. Italy Chicken Feet Revenue (USD Million) By Country (2021-2032)
Figure 16. Russia Chicken Feet Revenue (USD Million) By Country (2021-2032)
Figure 17. Rest of Europe Chicken Feet Revenue (USD Million) By Country (2021-2032)
Figure 11. Asia Pacific Chicken Feet Revenue (USD Million) By Country (2021-2032)
Figure 12. China Chicken Feet Revenue (USD Million) By Country (2021-2032)
Figure 13. Japan Chicken Feet Revenue (USD Million) By Country (2021-2032)
Figure 14. India Chicken Feet Revenue (USD Million) By Country (2021-2032)
Figure 15. South Korea Chicken Feet Revenue (USD Million) By Country (2021-2032)
Figure 16. Australia Chicken Feet Revenue (USD Million) By Country (2021-2032)
Figure 17. South East Asia Chicken Feet Revenue (USD Million) By Country (2021-2032)
Figure 18. South America Chicken Feet Revenue (USD Million) By Country (2021-2032)
Figure 19. Brazil Chicken Feet Revenue (USD Million) By Country (2021-2032)
Figure 20. Argentina Chicken Feet Revenue (USD Million) By Country (2021-2032)
Figure 21. Rest of Asia Pacific Chicken Feet Revenue (USD Million) By Country (2021-2032)
Figure 22. Middle East and Africa Chicken Feet Revenue (USD Million) By Region (2021-2032)
Figure 23. Saudi Arabia Chicken Feet Revenue (USD Million) By Region (2021-2032)
Figure 24. The UAE Chicken Feet Revenue (USD Million) By Region (2021-2032)
Figure 25. Rest of Middle East Chicken Feet Revenue (USD Million) By Region (2021-2032)
Figure 26. South Africa Chicken Feet Revenue (USD Million) By Region (2021-2032)
Figure 27. Africa Chicken Feet Revenue (USD Million) By Region (2021-2032)
Figure 28. North America Chicken Feet Revenue (USD Million) By Type (2021-2032)
Figure 29. North America Chicken Feet Revenue (USD Million) By Application (2021-2032)
Figure 30. North America Chicken Feet Revenue (USD Million) By Product (2021-2032)
Figure 31. Europe Chicken Feet Revenue (USD Million) By Type (2021-2032)
Figure 32. Europe Chicken Feet Revenue (USD Million) By Application (2021-2032)
Figure 33. Europe Chicken Feet Revenue (USD Million) By Product (2021-2032)
Figure 34. Asia Pacific Chicken Feet Revenue (USD Million) By Type (2021-2032)
Figure 35. Asia Pacific Chicken Feet Revenue (USD Million) By Application (2021-2032)
Figure 36. Asia Pacific Chicken Feet Revenue (USD Million) By Product (2021-2032)
Figure 37. South America Chicken Feet Revenue (USD Million) By Type (2021-2032)
Figure 38. South America Chicken Feet Revenue (USD Million) By Application (2021-2032)
Figure 39. South America Chicken Feet Revenue (USD Million) By Product (2021-2032)
Figure 40. Middle East and Africa Chicken Feet Revenue (USD Million) By Type (2021-2032)
Figure 41. Middle East and Africa Chicken Feet Revenue (USD Million) By Application (2021-2032)
Figure 42. Middle East and Africa Chicken Feet Revenue (USD Million) By Product (2021-2032)
By Type
Raw
Processed
By Application
Retails
Foodservices
Food Processing
Countries Analyzed
North America (US, Canada, Mexico)
Europe (Germany, UK, France, Spain, Italy, Russia, Rest of Europe)
Asia Pacific (China, India, Japan, South Korea, Australia, South East Asia, Rest of Asia)
South America (Brazil, Argentina, Rest of South America)
Middle East and Africa (Saudi Arabia, UAE, Rest of Middle East, South Africa, Egypt, Rest of Africa)
