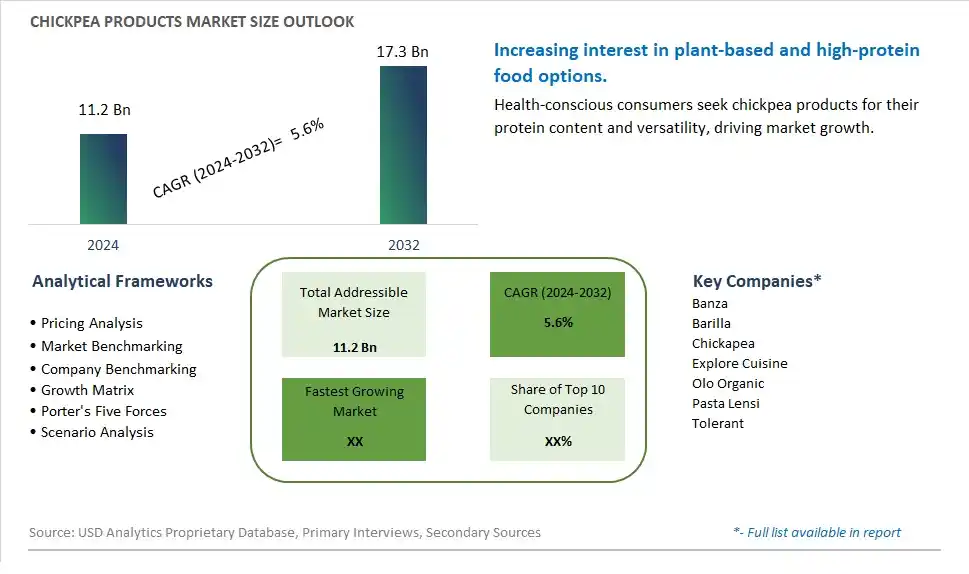
Global Chickpea Products Market Size is valued at $11.2 Billion in 2024 and is forecast to register a growth rate (CAGR) of 5.6% to reach $17.3 Billion by 2032.
The global Chickpea Products Market Comprehensive Study analyzes and forecasts the market size across 6 regions and 24 countries for diverse segments -By Type (Spicy, Non-spicy), By Application (Supermarkets/Hypermarkets, Convenience Stores, Online Retail, Others)
An Introduction to Chickpea Products Market
The Chickpea Products market in 2024 is expanding rapidly, driven by the increasing demand for plant-based and high-protein food options. Chickpea products, including hummus, snacks, pastas, and canned chickpeas, are valued for their versatility, nutritional benefits, and appealing taste. The market is supported by the growing trend towards vegetarian and vegan diets. Advances in food processing and packaging technologies are enhancing the quality, convenience, and shelf life of chickpea products. The market is also benefiting from the trend towards clean-label and organic products, appealing to health-conscious consumers seeking high-quality and sustainable food options.
Chickpea Products Competitive Landscape
The market report analyses the leading companies in the industry including Banza, Barilla, Chickapea, Explore Cuisine, Olo Organic, Pasta Lensi, Tolerant, and Others.
Chickpea Products Market Dynamics
Chickpea Products Market Trend: Growth in Plant-Based and Vegan Food Consumption
A prominent market trend for chickpea products is the significant growth in plant-based and vegan food consumption among consumers. With rising awareness of health, sustainability, and ethical considerations, there's a substantial demand for plant-based protein sources like chickpeas. Chickpea products, including chickpea flour, hummus, snacks, and plant-based meat alternatives, are gaining popularity as nutritious, versatile, and eco-friendly options for individuals adopting plant-centric diets.
Chickpea Products Market Driver: Increase in Health-Conscious and Flexitarian Lifestyles
A key driver fueling the market for chickpea products is the increase in health-conscious and flexitarian lifestyles among consumers. Individuals are seeking foods that offer nutritional benefits, such as protein, fiber, vitamins, and minerals, while also aligning with dietary preferences, including vegetarian, vegan, and Mediterranean diets. Chickpea products provide a plant-based protein source that supports overall health and wellness, catering to the evolving dietary habits and preferences of modern consumers.
Chickpea Products Market Opportunity: Innovation in Product Varieties and Culinary Applications
An opportunity within the chickpea products market lies in innovation, particularly in product varieties and culinary applications. Manufacturers can explore developing new chickpea-based products, such as chickpea-based snacks, ready-to-eat meals, desserts, and beverages, to diversify their offerings and appeal to different consumer segments. Additionally, promoting chickpea products as versatile ingredients for creating plant-based burgers, falafel, salads, wraps, and dips presents opportunities to tap into the growing market for plant-forward dining experiences. By embracing culinary creativity and meeting consumer demand for plant-based options, companies can capitalize on the market opportunity presented by the rise in plant-based eating and the popularity of chickpea products.
Chickpea Products Market Share Analysis: Non-spicy Chickpea Products segment generated the highest revenue share in the industry
The non-spicy chickpea products emerge as the largest segment in the Chickpea Products market. This segment includes a wide array of chickpea-based food products that cater to diverse culinary preferences and dietary needs globally. Non-spicy chickpea products are favored for their versatility and nutritional benefits, appealing to health-conscious consumers seeking plant-based protein sources. They are commonly used in various cuisines, including salads, soups, stews, snacks, and as ingredients in bakery items and breakfast cereals. The popularity of non-spicy chickpea products is driven by their high fiber content, protein richness, and potential health benefits, such as aiding digestion and promoting heart health. Additionally, the growing trend towards vegetarian and vegan diets, coupled with increasing awareness of sustainable food choices, contributes to the robust demand for non-spicy chickpea products. As manufacturers innovate with new product formulations and expand distribution channels, the non-spicy chickpea products segment is expected to maintain its dominance and continue growing steadily in the Chickpea Products market.
Chickpea Products Market Share Analysis: Online Retail is the fastest growing segment over the forecast period to 2032
Among the segments in the Chickpea Products market, Online Retail stands out as the fastest growing segment projected to expand significantly by 2032. The rise of e-commerce platforms and digital transformation in retail have revolutionized consumer shopping behaviors, particularly for food products like chickpea-based items. Online retail offers convenience, accessibility, and a wide range of product choices to consumers globally, driving the growth of the Chickpea Products market through this channel. Further, the Past few yearsaccelerated the shift towards online shopping for groceries and food items, further boosting the demand for chickpea products through digital platforms. Consumers increasingly prefer the ease of browsing and purchasing chickpea products online, aided by home delivery services that ensure convenience and safety. As online retail continues to evolve with enhanced logistics and marketing strategies, it is poised to dominate the distribution landscape for chickpea products, contributing significantly to the market's overall growth trajectory up to 2032.
Chickpea Products Market Segmentation
By Type
Spicy
Non-spicy
By Application
Supermarkets/Hypermarkets
Convenience Stores
Online Retail
Others
Countries Analyzed
North America (US, Canada, Mexico)
Europe (Germany, UK, France, Spain, Italy, Russia, Rest of Europe)
Asia Pacific (China, India, Japan, South Korea, Australia, South East Asia, Rest of Asia)
South America (Brazil, Argentina, Rest of South America)
Middle East and Africa (Saudi Arabia, UAE, Rest of Middle East, South Africa, Egypt, Rest of Africa)
Chickpea Products Companies Profiled in the Study
Banza
Barilla
Chickapea
Explore Cuisine
Olo Organic
Pasta Lensi
Tolerant
*- List Not Exhaustive
Chapter 1. TABLE OF CONTENTS
Chapter 2. Introduction to Chickpea Products Market
2.1. Market Overview
2.2. Key Statistics and Report Highlights
2.3. Scope of the Comprehensive Study
2.3.1. Market Definition
2.3.2 Countries and Regions Covered
2.3.3 Research Objective
2.3.4 Units, Currency, and Conversions
2.3.5 Industry Value Chain
2.4. Key Market Segments
2.5. Key Companies
2.6. Study Period
Chapter 3. Strategic Analysis Review
3.1. Chickpea Products Pricing Analysis and Forecast
3.2. Porter’s Five Forces
3.3. Market Ecosystem
3.4. SWOT Analysis
3.5. Regulatory Scenario
3.3. Effects of Inflation, Russia-Ukraine War, moderating economic growth, and other macroeconomic factors
Chapter 4. Competitive Landscape
4.1. Market Share Analysis
4.1.1. Global Chickpea Products Market Share by Company, 2023
4.1.2. Product Offerings of Leading Chickpea Products Companies
4.2. Market Entropy
4.2.1. New Product Launches in the Industry
4.2.2. Mergers, Acquisitions, Joint ventures, and Partnerships
4.3. Key Strategies and Best Practices
Chapter 5. Global Market Projections: Best, Reference, and Low Case Scenarios
5.1. Growth Analysis- Case Scenario Definitions
5.2. Low Growth Case Scenario Forecasts
5.3. Reference Growth Case Scenario Forecasts
5.4. High Growth Case Scenario Forecasts
Chapter 6. Market Dynamics
6.1. Chickpea Products Market Drivers
6.2. Chickpea Products Market Challenges
6.6. Chickpea Products Market Opportunities
6.4. Chickpea Products Market Trends
Chapter 7. Global Chickpea Products Market Outlook Trends
7.1. Global Chickpea Products Revenue (USD Million) and CAGR (%) by Type (2021-2032)
7.2. Global Chickpea Products Revenue (USD Million) and CAGR (%) by Application (2021-2032)
7.3. Global Chickpea Products Revenue (USD Million) and CAGR (%) by Product (2021-2032)
By Type
Spicy
Non-spicy
By Application
Supermarkets/Hypermarkets
Convenience Stores
Online Retail
Others
Chapter 8. Global Chickpea Products Regional Analysis and Outlook
8.1. Global Chickpea Products Revenue (USD Million) By Regions (2021- 2032)
8.2. North America Chickpea Products Revenue (USD Million) by Country (2021-2032)
8.2.1. United States Chickpea Products Regional Analysis and Outlook
8.2.2. Canada Chickpea Products Regional Analysis and Outlook
8.2.3. Mexico Chickpea Products Regional Analysis and Outlook
8.3. Europe Chickpea Products Revenue (USD Million), by Country (2021-2032)
8.3.1. Germany Chickpea Products Regional Analysis and Outlook
8.3.2. France Chickpea Products Regional Analysis and Outlook
8.3.3. United Kingdom Chickpea Products Regional Analysis and Outlook
8.3.4. Spain Chickpea Products Regional Analysis and Outlook
8.3.5. Italy Chickpea Products Regional Analysis and Outlook
8.3.6. Russia Chickpea Products Regional Analysis and Outlook
8.3.7. Rest of Europe Chickpea Products Regional Analysis and Outlook
8.4. Asia Pacific Chickpea Products Revenue (USD Million) by Country (2021-2032)
8.4.1. China Chickpea Products Regional Analysis and Outlook
8.4.2. Japan Chickpea Products Regional Analysis and Outlook
8.4.3. India Chickpea Products Regional Analysis and Outlook
8.4.4. South Korea Chickpea Products Regional Analysis and Outlook
8.4.5. Australia Chickpea Products Regional Analysis and Outlook
8.4.6. South East Asia Chickpea Products Regional Analysis and Outlook
8.4.7. Rest of Asia Pacific Chickpea Products Regional Analysis and Outlook
8.5. South America Chickpea Products Revenue (USD Million), by Country (2021-2032)
8.5.1. Brazil Chickpea Products Regional Analysis and Outlook
8.5.2. Argentina Chickpea Products Regional Analysis and Outlook
8.5.3. Rest of South America Chickpea Products Regional Analysis and Outlook
8.6. Middle East and Africa Chickpea Products Revenue (USD Million) by Country (2021-2032)
8.6.1. Middle East Chickpea Products Regional Analysis and Outlook
8.6.2. Africa Chickpea Products Regional Analysis and Outlook
Chapter 9. North America Chickpea Products Analysis and Outlook
9.1. North America Chickpea Products Revenue (USD Million) by Segments (2021-2032)
9.1.1. North America Chickpea Products Revenue (USD Million) by Type (2021-2032)
9.1.2. North America Chickpea Products Revenue (USD Million) by Application (2021-2032)
9.1.3. North America Chickpea Products Revenue (USD Million) by Product (2021-2032)
By Type
Spicy
Non-spicy
By Application
Supermarkets/Hypermarkets
Convenience Stores
Online Retail
Others
Chapter 10. Europe Chickpea Products Analysis and Outlook
10.1. Europe Chickpea Products Revenue (USD Million), by Segments (USD Million) (2021-2032)
10.1.1. Europe Chickpea Products Revenue (USD Million) by Type (2021-2032)
10.1.2. Europe Chickpea Products Revenue (USD Million) by Application (2021-2032)
10.1.3. Europe Chickpea Products Revenue (USD Million) by Product (2021-2032)
By Type
Spicy
Non-spicy
By Application
Supermarkets/Hypermarkets
Convenience Stores
Online Retail
Others
Chapter 11. Asia Pacific Chickpea Products Analysis and Outlook
11.1. Asia Pacific Chickpea Products Revenue (USD Million), and Revenue (USD Million) by Segments (2021-2032)
11.1.1. Asia Pacific Chickpea Products Revenue (USD Million) by Type (2021-2032)
11.1.2. Asia Pacific Chickpea Products Revenue (USD Million) by Application (2021-2032)
11.1.3. Asia Pacific Chickpea Products Revenue (USD Million) by Product (2021-2032)
By Type
Spicy
Non-spicy
By Application
Supermarkets/Hypermarkets
Convenience Stores
Online Retail
Others
Chapter 12. South America Chickpea Products Analysis and Outlook
12.1. South America Chickpea Products Revenue (USD Million), by Segments (2021-2032)
12.1.1. South America Chickpea Products Revenue (USD Million) by Type (2021-2032)
12.1.2. South America Chickpea Products Revenue (USD Million) by Application (2021-2032)
12.1.3. South America Chickpea Products Revenue (USD Million) by Product (2021-2032)
By Type
Spicy
Non-spicy
By Application
Supermarkets/Hypermarkets
Convenience Stores
Online Retail
Others
Chapter 13. Middle East and Africa Chickpea Products Analysis and Outlook
13.1. Middle East and Africa Chickpea Products Revenue (USD Million), by Segments (2021-2032)
13.1.1. Middle East and Africa Chickpea Products Revenue (USD Million) by Type (2021-2032)
13.1.2. Middle East and Africa Chickpea Products Revenue (USD Million) by Application (2021-2032)
13.1.3. Middle East and Africa Chickpea Products Revenue (USD Million) by Product (2021-2032)
By Type
Spicy
Non-spicy
By Application
Supermarkets/Hypermarkets
Convenience Stores
Online Retail
Others
Chapter 14. Chickpea Products Company Profiles
14.1 Business Overview
14.2 Product Profiles
14.3 SWOT Profiles
14.5 Recent Developments
14.6 Financial Profile
List of Companies
Banza
Barilla
Chickapea
Explore Cuisine
Olo Organic
Pasta Lensi
Tolerant
15. Methodology and Data Sources
15.1 Customization Offerings
15.2 Subscription Services
15.3 Related Reports
15.4 Publisher Expertise
LIST OF TABLES
Table 1 Market Segmentation Analysis
Table 2 Global Chickpea Products Market Share of Leading Companies, 2023
Table 3 Product Offerings of Leading Companies
Table 4 Low Growth Scenario Forecasts
Table 5 Reference Case Growth Scenario
Table 6 High Growth Case Scenario
Table 7 Global Chickpea Products Revenue (USD Million) And CAGR (%) By Type (2021-2032)
Table 8 Global Chickpea Products Revenue (USD Million) And CAGR (%) By Application (2021-2032)
Table 9 Global Chickpea Products Revenue (USD Million) And CAGR (%) By Product (2021-2032)
Table 10 Global Chickpea Products Market Revenue (USD Million) By Regions (2021-2032)
Table 11 Global Chickpea Products Market Share (%) By Regions (2021-2032)
Table 12 North America Chickpea Products Revenue (USD Million) By Country (2021-2032)
Table 13 Europe Chickpea Products Revenue (USD Million) By Country (2021-2032)
Table 14 Asia Pacific Chickpea Products Revenue (USD Million) By Country (2021-2032)
Table 15 South America Chickpea Products Revenue (USD Million) By Country (2021-2032)
Table 16 Middle East and Africa Chickpea Products Revenue (USD Million) By Region (2021-2032)
Table 17 North America Chickpea Products Revenue (USD Million) By Type (2021-2032)
Table 18 North America Chickpea Products Revenue (USD Million) By Application (2021-2032)
Table 19 North America Chickpea Products Revenue (USD Million) By Product (2021-2032)
Table 20 Europe Chickpea Products Revenue (USD Million) By Type (2021-2032)
Table 21 Europe Chickpea Products Revenue (USD Million) By Application (2021-2032)
Table 22 Europe Chickpea Products Revenue (USD Million) By Product (2021-2032)
Table 23 Asia Pacific Chickpea Products Revenue (USD Million) By Type (2021-2032)
Table 24 Asia Pacific Chickpea Products Revenue (USD Million) By Application (2021-2032)
Table 25 Asia Pacific Chickpea Products Revenue (USD Million) By Product (2021-2032)
Table 26 South America Chickpea Products Revenue (USD Million) By Type (2021-2032)
Table 27 South America Chickpea Products Revenue (USD Million) By Application (2021-2032)
Table 28 South America Chickpea Products Revenue (USD Million) By Product (2021-2032)
Table 29 Middle East and Africa Chickpea Products Revenue (USD Million) By Type (2021-2032)
Table 30 Middle East and Africa Chickpea Products Revenue (USD Million) By Application (2021-2032)
Table 31 Middle East and Africa Chickpea Products Revenue (USD Million) By Product (2021-2032)
LIST OF FIGURES
Figure 1. Market Scope
Figure 2. Pricing Forecasts Per Unit, 2023- 2032
Figure 3. Porter’s Five Forces
Figure 4. Global Chickpea Products Market Revenue (USD Million) By Regions (2021-2032)
Figure 5. Global Chickpea Products Market Share (%) By Regions (2023)
Figure 6. North America Chickpea Products Revenue (USD Million) By Country (2021-2032)
Figure 7. United States Chickpea Products Revenue (USD Million) By Country (2021-2032)
Figure 8. Canada Chickpea Products Revenue (USD Million) By Country (2021-2032)
Figure 9. Mexico Chickpea Products Revenue (USD Million) By Country (2021-2032)
Figure 10. Europe Chickpea Products Revenue (USD Million) By Country (2021-2032)
Figure 11. Germany Chickpea Products Revenue (USD Million) By Country (2021-2032)
Figure 12. France Chickpea Products Revenue (USD Million) By Country (2021-2032)
Figure 13. United Kingdom Chickpea Products Revenue (USD Million) By Country (2021-2032)
Figure 14. Spain Chickpea Products Revenue (USD Million) By Country (2021-2032)
Figure 15. Italy Chickpea Products Revenue (USD Million) By Country (2021-2032)
Figure 16. Russia Chickpea Products Revenue (USD Million) By Country (2021-2032)
Figure 17. Rest of Europe Chickpea Products Revenue (USD Million) By Country (2021-2032)
Figure 11. Asia Pacific Chickpea Products Revenue (USD Million) By Country (2021-2032)
Figure 12. China Chickpea Products Revenue (USD Million) By Country (2021-2032)
Figure 13. Japan Chickpea Products Revenue (USD Million) By Country (2021-2032)
Figure 14. India Chickpea Products Revenue (USD Million) By Country (2021-2032)
Figure 15. South Korea Chickpea Products Revenue (USD Million) By Country (2021-2032)
Figure 16. Australia Chickpea Products Revenue (USD Million) By Country (2021-2032)
Figure 17. South East Asia Chickpea Products Revenue (USD Million) By Country (2021-2032)
Figure 18. South America Chickpea Products Revenue (USD Million) By Country (2021-2032)
Figure 19. Brazil Chickpea Products Revenue (USD Million) By Country (2021-2032)
Figure 20. Argentina Chickpea Products Revenue (USD Million) By Country (2021-2032)
Figure 21. Rest of Asia Pacific Chickpea Products Revenue (USD Million) By Country (2021-2032)
Figure 22. Middle East and Africa Chickpea Products Revenue (USD Million) By Region (2021-2032)
Figure 23. Saudi Arabia Chickpea Products Revenue (USD Million) By Region (2021-2032)
Figure 24. The UAE Chickpea Products Revenue (USD Million) By Region (2021-2032)
Figure 25. Rest of Middle East Chickpea Products Revenue (USD Million) By Region (2021-2032)
Figure 26. South Africa Chickpea Products Revenue (USD Million) By Region (2021-2032)
Figure 27. Africa Chickpea Products Revenue (USD Million) By Region (2021-2032)
Figure 28. North America Chickpea Products Revenue (USD Million) By Type (2021-2032)
Figure 29. North America Chickpea Products Revenue (USD Million) By Application (2021-2032)
Figure 30. North America Chickpea Products Revenue (USD Million) By Product (2021-2032)
Figure 31. Europe Chickpea Products Revenue (USD Million) By Type (2021-2032)
Figure 32. Europe Chickpea Products Revenue (USD Million) By Application (2021-2032)
Figure 33. Europe Chickpea Products Revenue (USD Million) By Product (2021-2032)
Figure 34. Asia Pacific Chickpea Products Revenue (USD Million) By Type (2021-2032)
Figure 35. Asia Pacific Chickpea Products Revenue (USD Million) By Application (2021-2032)
Figure 36. Asia Pacific Chickpea Products Revenue (USD Million) By Product (2021-2032)
Figure 37. South America Chickpea Products Revenue (USD Million) By Type (2021-2032)
Figure 38. South America Chickpea Products Revenue (USD Million) By Application (2021-2032)
Figure 39. South America Chickpea Products Revenue (USD Million) By Product (2021-2032)
Figure 40. Middle East and Africa Chickpea Products Revenue (USD Million) By Type (2021-2032)
Figure 41. Middle East and Africa Chickpea Products Revenue (USD Million) By Application (2021-2032)
Figure 42. Middle East and Africa Chickpea Products Revenue (USD Million) By Product (2021-2032)
By Type
Spicy
Non-spicy
By Application
Supermarkets/Hypermarkets
Convenience Stores
Online Retail
Others
Countries Analyzed
North America (US, Canada, Mexico)
Europe (Germany, UK, France, Spain, Italy, Russia, Rest of Europe)
Asia Pacific (China, India, Japan, South Korea, Australia, South East Asia, Rest of Asia)
South America (Brazil, Argentina, Rest of South America)
Middle East and Africa (Saudi Arabia, UAE, Rest of Middle East, South Africa, Egypt, Rest of Africa)
