
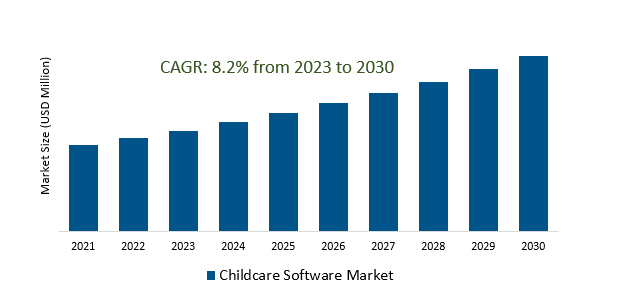
Childcare Software Market Overview
The need for efficient management of childcare facilities is driving the adoption of software solutions to streamline administrative tasks, including enrolment, attendance tracking, billing, and communication. Childcare software providing features for real-time updates, messaging, and access to reports are fostering stronger parent-provider engagement. Integration of remote learning tools and virtual activities within childcare software, allowing for continued education and engagement are fuelling the demand. Further, implementation of software solutions with features ensuring child safety, such as check-in/check-out systems, video monitoring, and emergency notifications are driving the market growth. Software offering analytics and reporting functionalities for tracking attendance, behaviour patterns, and milestones are leading to the market growth.
Mobile applications are becoming instrumental in facilitating real-time communication, providing parents with immediate access to their child's activities, progress reports, and communication channels with caregivers.
Features to receive updates, communicate with teachers or staff, manage schedules, and access essential information about their child's well-being and development are fuelling the demand.
Further, seamless communication between parents and childcare providers, fostering a collaborative environment conducive to the child's holistic development are driving the market.
The paramount concern for child safety is spurring the integration of software solutions equipped with advanced safety features.
The growing demand among parents and childcare providers for robust safety measures, including secure check-in/check-out systems, video monitoring capabilities, and emergency notifications, aimed at safeguarding children in childcare facilities are propelling the market growth.
Further, the market's response to evolving parental expectations for transparency and reassurance regarding their child's well-being is fuelling the market growth.
The recognition that each child has unique learning needs and developmental requirements are the key factors driving the market.
Personalized learning modules, adaptable curriculum structures, and individualized progress tracking are gaining traction due to their ability to cater to diverse learning styles and pace.
Additionally, the heightened emphasis on optimizing child development and preparing them for future academic pursuits are further accelerating the adoption of personalized learning solutions in the Childcare Software Market.
The Childcare Software Market is analysed across Nursery, Educational Institute, Day-Care Centres & Others. Educational Institute is poised to register the fastest growth. Educational institutes, including preschools, kindergartens, and early learning centers, are integrating software solutions tailored to their specific needs to enhance administrative efficiency, communication, and overall educational quality. Childcare software designed for educational institutes typically offers features that cater to curriculum planning, student enrollment, attendance tracking, and academic progress monitoring. These solutions help educators create and organize lesson plans, track individual student development, and communicate effectively with parents regarding their child's activities and progress. Additionally, these platforms often include modules for scheduling, billing, and invoicing, easing administrative burdens for staff and allowing more focus on student-centered activities.
The Childcare Software Market is analysed across various deployment modes including Cloud-Based & On-Premise. Of these, SMEs held a significant market share in 2023. Offering unparalleled flexibility, accessibility, and scalability, cloud-based childcare software has rapidly gained traction due to its numerous advantages over traditional on-premise systems. Cloud-based childcare software allows for seamless remote access from various devices, enabling childcare providers to efficiently manage tasks, access information, and communicate with parents from anywhere, at any time. This accessibility fosters real-time collaboration between caregivers and parents, ensuring transparent and instant updates about a child's activities, meals, nap times, and developmental milestones. Scalability is another key benefit of cloud-based solutions. Childcare facilities can easily adjust their software resources to accommodate growth, whether it's expanding their services, adding more children to their programs, or adapting to changing regulatory requirements.
By Application
By Deployment
By Region
*List not exhaustive
Childcare Software Market Outlook 2024
1 Market Overview
1.1 Introduction to the Childcare Software Market
1.2 Scope of the Study
1.3 Research Objective
1.3.1 Key Market Scope and Segments
1.3.2 Players Covered
1.3.3 Years Considered
2 Executive Summary
2.1 2024 Childcare Software Industry- Market Statistics
3 Market Dynamics
3.1 Market Drivers
3.2 Market Challenges
3.3 Market Opportunities
3.4 Market Trends
4 Market Factor Analysis
4.1 Porter’s Five Forces
4.2 Market Entropy
4.2.1 Global Childcare Software Market Companies with Area Served
4.2.2 Products Offerings Global Childcare Software Market
5 COVID-19 Impact Analysis and Outlook Scenarios
5.1.1 Covid-19 Impact Analysis
5.1.2 post-COVID-19 Scenario- Low Growth Case
5.1.3 post-COVID-19 Scenario- Reference Growth Case
5.1.4 post-COVID-19 Scenario- Low Growth Case
6 Global Childcare Software Market Trends
6.1 Global Childcare Software Revenue (USD Million) and CAGR (%) by Type (2019-2034)
6.2 Global Childcare Software Revenue (USD Million) and CAGR (%) by Applications (2019-2034)
6.3 Global Childcare Software Revenue (USD Million) and CAGR (%) by regions (2019-2034)
7 Global Childcare Software Market Revenue (USD Million) by Type, and Applications (2019-2024)
7.1 Global Childcare Software Revenue (USD Million) by Type (2019-2024)
7.1.1 Global Childcare Software Revenue (USD Million), Market Share (%) by Type (2019-2024)
7.2 Global Childcare Software Revenue (USD Million) by Applications (2019-2024)
7.2.1 Global Childcare Software Revenue (USD Million), Market Share (%) by Applications (2019-2024)
8 Global Childcare Software Development Regional Status and Outlook
8.1 Global Childcare Software Revenue (USD Million) By Regions (2019-2024)
8.2 North America Childcare Software Revenue (USD Million) by Type, and Application (2019-2024)
8.2.1 North America Childcare Software Revenue (USD Million) by Country (2019-2024)
8.2.2 North America Childcare Software Revenue (USD Million) by Type (2019-2024)
8.2.3 North America Childcare Software Revenue (USD Million) by Applications (2019-2024)
8.3 Europe Childcare Software Revenue (USD Million), by Type, and Applications (USD Million) (2019-2024)
8.3.1 Europe Childcare Software Revenue (USD Million), by Country (2019-2024)
8.3.2 Europe Childcare Software Revenue (USD Million) by Type (2019-2024)
8.3.3 Europe Childcare Software Revenue (USD Million) by Applications (2019-2024)
8.4 Asia Pacific Childcare Software Revenue (USD Million), and Revenue (USD Million) by Type, and Applications (2019-2024)
8.4.1 Asia Pacific Childcare Software Revenue (USD Million) by Country (2019-2024)
8.4.2 Asia Pacific Childcare Software Revenue (USD Million) by Type (2019-2024)
8.4.3 Asia Pacific Childcare Software Revenue (USD Million) by Applications (2019-2024)
8.5 South America Childcare Software Revenue (USD Million), by Type, and Applications (2019-2024)
8.5.1 South America Childcare Software Revenue (USD Million), by Country (2019-2024)
8.5.2 South America Childcare Software Revenue (USD Million) by Type (2019-2024)
8.5.3 South America Childcare Software Revenue (USD Million) by Applications (2019-2024)
8.6 Middle East and Africa Childcare Software Revenue (USD Million), by Type, Technology, Application, Thickness (2019-2024)
8.6.1 Middle East and Africa Childcare Software Revenue (USD Million) by Country (2019-2024)
8.6.2 Middle East and Africa Childcare Software Revenue (USD Million) by Type (2019-2024)
8.6.3 Middle East and Africa Childcare Software Revenue (USD Million) by Applications (2019-2024)
9 Company Profiles
10 Global Childcare Software Market Revenue (USD Million), by Type, and Applications (2024-2034)
10.1 Global Childcare Software Revenue (USD Million) and Market Share (%) by Type (2024-2034)
10.1.1 Global Childcare Software Revenue (USD Million), and Market Share (%) by Type (2024-2034)
10.2 Global Childcare Software Revenue (USD Million) and Market Share (%) by Applications (2024-2034)
10.2.1 Global Childcare Software Revenue (USD Million), and Market Share (%) by Applications (2024-2034)
11 Global Childcare Software Development Regional Status and Outlook Forecast
11.1 Global Childcare Software Revenue (USD Million) By Regions (2024-2034)
11.2 North America Childcare Software Revenue (USD Million) by Type, and Applications (2024-2034)
11.2.1 North America Childcare Software Revenue (USD) Million by Country (2024-2034)
11.2.2 North America Childcare Software Revenue (USD Million), by Type (2024-2034)
11.2.3 North America Childcare Software Revenue (USD Million), Market Share (%) by Applications (2024-2034)
11.3 Europe Childcare Software Revenue (USD Million), by Type, and Applications (2024-2034)
11.3.1 Europe Childcare Software Revenue (USD Million), by Country (2024-2034)
11.3.2 Europe Childcare Software Revenue (USD Million), by Type (2024-2034)
11.3.3 Europe Childcare Software Revenue (USD Million), by Applications (2024-2034)
11.4 Asia Pacific Childcare Software Revenue (USD Million) by Type, and Applications (2024-2034)
11.4.1 Asia Pacific Childcare Software Revenue (USD Million), by Country (2024-2034)
11.4.2 Asia Pacific Childcare Software Revenue (USD Million), by Type (2024-2034)
11.4.3 Asia Pacific Childcare Software Revenue (USD Million), by Applications (2024-2034)
11.5 South America Childcare Software Revenue (USD Million), by Type, and Applications (2024-2034)
11.5.1 South America Childcare Software Revenue (USD Million), by Country (2024-2034)
11.5.2 South America Childcare Software Revenue (USD Million), by Type (2024-2034)
11.5.3 South America Childcare Software Revenue (USD Million), by Applications (2024-2034)
11.6 Middle East and Africa Childcare Software Revenue (USD Million), by Type, and Applications (2024-2034)
11.6.1 Middle East and Africa Childcare Software Revenue (USD Million), by region (2024-2034)
11.6.2 Middle East and Africa Childcare Software Revenue (USD Million), by Type (2024-2034)
11.6.3 Middle East and Africa Childcare Software Revenue (USD Million), by Applications (2024-2034)
12 Methodology and Data Sources
12.1 Methodology/Research Approach
12.1.1 Research Programs/Design
12.1.2 Market Size Estimation
12.1.3 Market Breakdown and Data Triangulation
12.2 Data Sources
12.2.1 Secondary Sources
12.2.2 Primary Sources
12.3 Disclaimer
List of Tables
Table 1 Market Segmentation Analysis
Table 2 Global Childcare Software Market Companies with Areas Served
Table 3 Products Offerings Global Childcare Software Market
Table 4 Low Growth Scenario Forecasts
Table 5 Reference Case Growth Scenario
Table 6 High Growth Case Scenario
Table 7 Global Childcare Software Revenue (USD Million) And CAGR (%) By Type (2019-2034)
Table 8 Global Childcare Software Revenue (USD Million) And CAGR (%) By Applications (2019-2034)
Table 9 Global Childcare Software Revenue (USD Million) And CAGR (%) By Regions (2019-2034)
Table 10 Global Childcare Software Revenue (USD Million) By Type (2019-2024)
Table 11 Global Childcare Software Revenue Market Share (%) By Type (2019-2024)
Table 12 Global Childcare Software Revenue (USD Million) By Applications (2019-2024)
Table 13 Global Childcare Software Revenue Market Share (%) By Applications (2019-2024)
Table 14 Global Childcare Software Market Revenue (USD Million) By Regions (2019-2024)
Table 15 Global Childcare Software Market Share (%) By Regions (2019-2024)
Table 16 North America Childcare Software Revenue (USD Million) By Country (2019-2024)
Table 17 North America Childcare Software Revenue (USD Million) By Type (2019-2024)
Table 18 North America Childcare Software Revenue (USD Million) By Applications (2019-2024)
Table 19 Europe Childcare Software Revenue (USD Million) By Country (2019-2024)
Table 20 Europe Childcare Software Revenue (USD Million) By Type (2019-2024)
Table 21 Europe Childcare Software Revenue (USD Million) By Applications (2019-2024)
Table 22 Asia Pacific Childcare Software Revenue (USD Million) By Country (2019-2024)
Table 23 Asia Pacific Childcare Software Revenue (USD Million) By Type (2019-2024)
Table 24 Asia Pacific Childcare Software Revenue (USD Million) By Applications (2019-2024)
Table 25 South America Childcare Software Revenue (USD Million) By Country (2019-2024)
Table 26 South America Childcare Software Revenue (USD Million) By Type (2019-2024)
Table 27 South America Childcare Software Revenue (USD Million) By Applications (2019-2024)
Table 28 Middle East and Africa Childcare Software Revenue (USD Million) By Region (2019-2024)
Table 29 Middle East and Africa Childcare Software Revenue (USD Million) By Type (2019-2024)
Table 30 Middle East and Africa Childcare Software Revenue (USD Million) By Applications (2019-2024)
Table 31 Financial Analysis
Table 32 Global Childcare Software Revenue (USD Million) By Type (2024-2034)
Table 33 Global Childcare Software Revenue Market Share (%) By Type (2024-2034)
Table 34 Global Childcare Software Revenue (USD Million) By Applications (2024-2034)
Table 35 Global Childcare Software Revenue Market Share (%) By Applications (2024-2034)
Table 36 Global Childcare Software Market Revenue (USD Million), And Revenue (USD Million) By Regions (2024-2034)
Table 37 North America Childcare Software Revenue (USD)By Country (2024-2034)
Table 38 North America Childcare Software Revenue (USD Million) By Type (2024-2034)
Table 39 North America Childcare Software Revenue (USD Million) By Applications (2024-2034)
Table 40 Europe Childcare Software Revenue (USD Million) By Country (2024-2034)
Table 41 Europe Childcare Software Revenue (USD Million) By Type (2024-2034)
Table 42 Europe Childcare Software Revenue (USD Million) By Applications (2024-2034)
Table 43 Asia Pacific Childcare Software Revenue (USD Million) By Country (2024-2034)
Table 44 Asia Pacific Childcare Software Revenue (USD Million) By Type (2024-2034)
Table 45 Asia Pacific Childcare Software Revenue (USD Million) By Applications (2024-2034)
Table 46 South America Childcare Software Revenue (USD Million) By Country (2024-2034)
Table 47 South America Childcare Software Revenue (USD Million) By Type (2024-2034)
Table 48 South America Childcare Software Revenue (USD Million) By Applications (2024-2034)
Table 49 Middle East and Africa Childcare Software Revenue (USD Million) By Region (2024-2034)
Table 50 Middle East and Africa Childcare Software Revenue (USD Million) By Region (2024-2034)
Table 51 Middle East and Africa Childcare Software Revenue (USD Million) By Type (2024-2034)
Table 52 Middle East and Africa Childcare Software Revenue (USD Million) By Applications (2024-2034)
Table 53 Research Programs/Design for This Report
Table 54 Key Data Information from Secondary Sources
Table 55 Key Data Information from Primary Sources
List of Figures
Figure 1 Market Scope
Figure 2 Porter’s Five Forces
Figure 3 Global Childcare Software Revenue (USD Million) By Type (2019-2024)
Figure 4 Global Childcare Software Revenue Market Share (%) By Type (2022)
Figure 5 Global Childcare Software Revenue (USD Million) By Applications (2019-2024)
Figure 6 Global Childcare Software Revenue Market Share (%) By Applications (2022)
Figure 7 Global Childcare Software Market Revenue (USD Million) By Regions (2019-2024)
Figure 8 Global Childcare Software Market Share (%) By Regions (2022)
Figure 9 North America Childcare Software Revenue (USD Million) By Country (2019-2024)
Figure 10 North America Childcare Software Revenue (USD Million) By Type (2019-2024)
Figure 11 North America Childcare Software Revenue (USD Million) By Applications (2019-2024)
Figure 12 Europe Childcare Software Revenue (USD Million) By Country (2019-2024)
Figure 13 Europe Childcare Software Revenue (USD Million) By Type (2019-2024)
Figure 14 Europe Childcare Software Revenue (USD Million) By Applications (2019-2024)
Figure 15 Asia Pacific Childcare Software Revenue (USD Million) By Country (2019-2024)
Figure 16 Asia Pacific Childcare Software Revenue (USD Million) By Type (2019-2024)
Figure 17 Asia Pacific Childcare Software Revenue (USD Million) By Applications (2019-2024)
Figure 18 South America Childcare Software Revenue (USD Million) By Country (2019-2024)
Figure 19 South America Childcare Software Revenue (USD Million) By Type (2019-2024)
Figure 20 South America Childcare Software Revenue (USD Million) By Applications (2019-2024)
Figure 21 Middle East and Africa Childcare Software Revenue (USD Million) By Region (2019-2024)
Figure 22 Middle East and Africa Childcare Software Revenue (USD Million) By Type (2019-2024)
Figure 23 Middle East and Africa Childcare Software Revenue (USD Million) By Applications (2019-2024)
Figure 24 Global Childcare Software Revenue (USD Million) By Type (2024-2034)
Figure 25 Global Childcare Software Revenue Market Share (%) By Type (2030)
Figure 26 Global Childcare Software Revenue (USD Million) By Applications (2024-2034)
Figure 27 Global Childcare Software Revenue Market Share (%) By Applications (2030)
Figure 28 Global Childcare Software Market Revenue (USD Million) By Regions (2024-2034)
Figure 29 North America Childcare Software Revenue (USD Million) By Country (2024-2034)
Figure 30 North America Childcare Software Revenue (USD Million) By Type (2024-2034)
Figure 31 North America Childcare Software Revenue (USD Million) By Applications (2024-2034)
Figure 32 Europe Childcare Software Revenue (USD Million) By Country (2024-2034)
Figure 33 Europe Childcare Software Revenue (USD Million) By Type (2024-2034)
Figure 34 Europe Childcare Software Revenue (USD Million) By Applications (2024-2034)
Figure 35 Asia Pacific Childcare Software Revenue (USD Million) By Country (2024-2034)
Figure 36 Asia Pacific Childcare Software Revenue (USD Million) By Type (2024-2034)
Figure 37 Asia Pacific Childcare Software Revenue (USD Million) By Applications (2024-2034)
Figure 38 South America Childcare Software Revenue (USD Million) By Country (2024-2034)
Figure 39 South America Childcare Software Revenue (USD Million) By Type (2024-2034)
Figure 40 South America Childcare Software Revenue (USD Million) By Applications (2024-2034)
Figure 41 Middle East and Africa Childcare Software Revenue (USD Million) By Region (2024-2034)
Figure 42 Middle East and Africa Childcare Software Revenue (USD Million) By Region (2024-2034)
Figure 43 Middle East and Africa Childcare Software Revenue (USD Million) By Type (2024-2034)
Figure 44 Middle East and Africa Childcare Software Revenue (USD Million) By Applications (2024-2034)
Figure 45 Bottom-Up and Top-Down Approaches for This Report
Figure 46 Data Triangulation
By Application
By Deployment
By Region