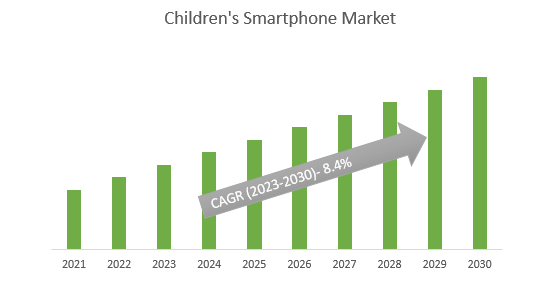
The global Children's Smartphone Market Size is estimated to register 8.40% growth over the forecast period from 2023 to 2030.
The market growth is driven by Digital Literacy and Education, Parental Concerns for Safety, Technological Advancements, Parental Control Features, Augmented Reality (AR) and Virtual Reality (VR), Privacy and Data Protection, Sustainability, and Eco-Friendly Designs, Subscription Services.
Leading key market players are investing in Advanced Educational Technology, Health and Wellness Features, Ethical Tech, Digital Citizenship, Environmental Sustainability, Parent-Teacher Integration, Holistic Development Focus, Data Privacy and Regulation, and others to boost market shares in the industry.
Market Overview
Modern technological addresses the unique needs of young users and their parents. The Children's Smartphone Market creates opportunities for manufacturers to innovate with features tailored to young users, such as durable designs, colorful aesthetics, and easy-to-use interfaces, and provides a platform for early exposure to technology, helping children develop digital literacy skills from an early age. These smartphones offer a range of educational apps, games, and child's online activities, control screen time, and ensure a safe online environment.
Market Dynamics
Market Trends: - Companies are launching Social Interaction Platforms to attract a consumer base
The importance of shaping young individuals to engage with technology and interact with their peers and families. The importance of social interaction platforms is Safe and Monitored Environment, Digital Socialization Skills, Communication with Family, Building Friendships, Educational Opportunities, Responsible Online Citizenship, Preparation for Future Digital Landscape.
Market Driver: Educational Opportunities market drives the outlook
Children's smartphones are essential for providing accessible and engaging educational opportunities that enhance cognitive development, support personalized learning, foster digital literacy, and promote critical thinking. These devices offer a wide range of interactive educational apps and multimedia content, enabling children to explore subjects, develop skills, and reinforce classroom learning outside traditional settings. children's smartphones facilitate continuous learning, language acquisition, and inclusive education, preparing young learners for a technology-driven future while involving parents in their educational journey.
Children's smartphones provide accessible and engaging educational opportunities. They offer interactive apps, multimedia content, and personalized learning experiences that enhance cognitive development, promote critical thinking, and foster digital literacy. These devices children to explore subjects, reinforce classroom learning, and acquire new languages. Further, children's smartphones facilitate continuous learning, inclusive education, and parental involvement, preparing young learners for a technology-driven future.
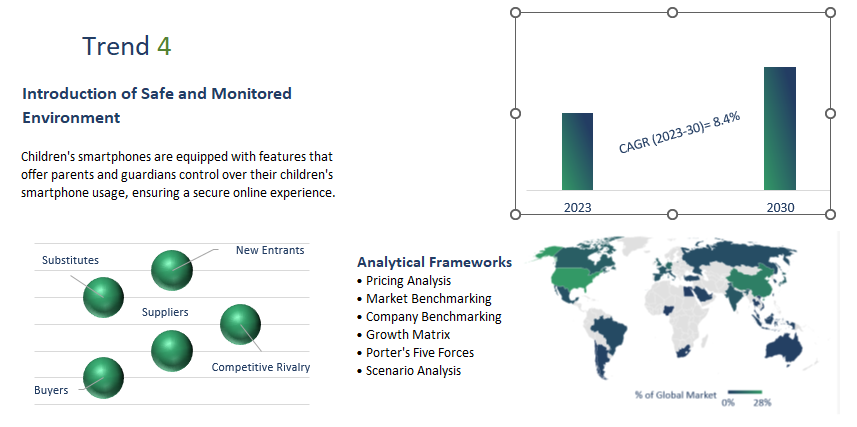
Market Opportunity: Introduction of Safe and Monitored Environment
Children's smartphones are equipped with features that offer parents and guardians control over their child's smartphone usage, ensuring a secure online experience. Parental control tools enable the setting of content filters, screen time limits, and app restrictions, ensuring that children access age-appropriate content and use their smartphones responsibly.
A safe and monitored environment on children's smartphones includes content moderation mechanisms that prevent exposure to inappropriate or harmful material. These smartphones often come with pre-approved app stores that offer a curated selection of apps and games suitable for young users.
Market Segmentation
Education: The Children's Smartphone Market technology early, fostering literacy; offers educational and creative tools; promotes communication, responsibility, and safety; prepares for future tech-centric careers; integrates children into culture; drives market innovation concerns about screen time and privacy highlight the need for balanced and mindful usage.
Online Stores: Online stores are a digital landscape, providing convenient access to a vast array of products and services from anywhere, saving time and effort. They enable comparison shopping, often offering better prices and a wider selection than brick-and-mortar stores. Online stores support global reach for businesses, leveling the playing field for smaller vendors, and allowing customers to explore diverse offerings. The seamless purchasing process, personalized recommendations, and user reviews enhance customer experiences, while the data-driven nature of online commerce aids businesses in understanding consumer preferences and optimizing their strategies.
Market Segmentation
By Application
By Age Group
- Below 12 years
- 12 to 14 years
- 14 to 18 years
By Sales Channel
- Online Stores
- Offline Stores
By Region
- North America (United States, Canada, Mexico)
- Europe (Germany, France, United Kingdom, Spain, Italy, Others)
- Asia Pacific (China, India, Japan, South Korea, Australia, Others)
- Latin America (Brazil, Argentina, Others)
- Middle East and Africa (Saudi Arabia, UAE, Kuwait, Other Middle East, South Africa, Nigeria, Other Africa)
Key Players
Leading companies profiled in the study include-
- LG Electronics Inc
- Kurio Technologies Inc.
- Nokia Corporation
- VTech Holdings Ltd
- Sony Corporation
- Huawei Technologies Co., Ltd.
- Samsung Electronics Co., Ltd.
- Apple Inc.
- Xiaomi Corporation
- Motorola, Inc.
- Lenovo Group Ltd
Children’s Smartphone Market Outlook 2023
1 Market Overview
1.1 Introduction to Children’s Smartphone Market
1.2 Scope of the Study
1.3 Research Objective
1.3.1 Key Market Scope and Segments
1.3.2 Players Covered
1.3.3 Years Considered
2 Executive Summary
2.1 2023 Children’s Smartphone Industry- Market Statistics
3 Market Dynamics
3.1 Market Drivers
3.2 Market Challenges
3.3 Market Opportunities
3.4 Market Trends
4 Market Factor Analysis
4.1 Porter’s Five Forces
4.2 Market Entropy
4.2.1 Global Children’s Smartphone Market Companies with Area Served
4.2.2 Products Offerings Global Children’s Smartphone Market
5 COVID-19 Impact Analysis and Outlook Scenarios
5.1.1 Covid-19 Impact Analysis
5.1.2 Post-COVID-19 Scenario- Low Growth Case
5.1.3 Post-COVID-19 Scenario- Reference Growth Case
5.1.4 Post-COVID-19 Scenario- Low Growth Case
6 Global Children’s Smartphone Market Trends
6.1 Global Children’s Smartphone Revenue (USD Million) and CAGR (%) by Type (2018-2030)
6.2 Global Children’s Smartphone Revenue (USD Million) and CAGR (%) by Applications (2018-2030)
6.3 Global Children’s Smartphone Revenue (USD Million) and CAGR (%) by Regions (2018-2030)
7 Global Children’s Smartphone Market Revenue (USD Million) by Type, and Applications (2018-2022)
7.1 Global Children’s Smartphone Revenue (USD Million) by Type (2018-2022)
7.1.1 Global Children’s Smartphone Revenue (USD Million), Market Share (%) by Type (2018-2022)
7.2 Global Children’s Smartphone Revenue (USD Million) by Applications (2018-2022)
7.2.1 Global Children’s Smartphone Revenue (USD Million), Market Share (%) by Applications (2018-2022)
8 Global Children’s Smartphone Development Regional Status and Outlook
8.1 Global Children’s Smartphone Revenue (USD Million) By Regions (2018-2022)
8.2 North America Children’s Smartphone Revenue (USD Million) by Type, and Application (2018-2022)
8.2.1 North America Children’s Smartphone Revenue (USD Million) by Country (2018-2022)
8.2.2 North America Children’s Smartphone Revenue (USD Million) by Type (2018-2022)
8.2.3 North America Children’s Smartphone Revenue (USD Million) by Applications (2018-2022)
8.3 Europe Children’s Smartphone Revenue (USD Million), by Type, and Applications (USD Million) (2018-2022)
8.3.1 Europe Children’s Smartphone Revenue (USD Million), by Country (2018-2022)
8.3.2 Europe Children’s Smartphone Revenue (USD Million) by Type (2018-2022)
8.3.3 Europe Children’s Smartphone Revenue (USD Million) by Applications (2018-2022)
8.4 Asia Pacific Children’s Smartphone Revenue (USD Million), and Revenue (USD Million) by Type, and Applications (2018-2022)
8.4.1 Asia Pacific Children’s Smartphone Revenue (USD Million) by Country (2018-2022)
8.4.2 Asia Pacific Children’s Smartphone Revenue (USD Million) by Type (2018-2022)
8.4.3 Asia Pacific Children’s Smartphone Revenue (USD Million) by Applications (2018-2022)
8.5 South America Children’s Smartphone Revenue (USD Million), by Type, and Applications (2018-2022)
8.5.1 South America Children’s Smartphone Revenue (USD Million), by Country (2018-2022)
8.5.2 South America Children’s Smartphone Revenue (USD Million) by Type (2018-2022)
8.5.3 South America Children’s Smartphone Revenue (USD Million) by Applications (2018-2022)
8.6 Middle East and Africa Children’s Smartphone Revenue (USD Million), by Type, Technology, Application, Thickness (2018-2022)
8.6.1 Middle East and Africa Children’s Smartphone Revenue (USD Million) by Country (2018-2022)
8.6.2 Middle East and Africa Children’s Smartphone Revenue (USD Million) by Type (2018-2022)
8.6.3 Middle East and Africa Children’s Smartphone Revenue (USD Million) by Applications (2018-2022)
9 Company Profiles
10 Global Children’s Smartphone Market Revenue (USD Million), by Type, and Applications (2023-2030)
10.1 Global Children’s Smartphone Revenue (USD Million) and Market Share (%) by Type (2023-2030)
10.1.1 Global Children’s Smartphone Revenue (USD Million), and Market Share (%) by Type (2023-2030)
10.2 Global Children’s Smartphone Revenue (USD Million) and Market Share (%) by Applications (2023-2030)
10.2.1 Global Children’s Smartphone Revenue (USD Million), and Market Share (%) by Applications (2023-2030)
11 Global Children’s Smartphone Development Regional Status and Outlook Forecast
11.1 Global Children’s Smartphone Revenue (USD Million) By Regions (2023-2030)
11.2 North America Children’s Smartphone Revenue (USD Million) by Type, and Applications (2023-2030)
11.2.1 North America Children’s Smartphone Revenue (USD) Million by Country (2023-2030)
11.2.2 North America Children’s Smartphone Revenue (USD Million), by Type (2023-2030)
11.2.3 North America Children’s Smartphone Revenue (USD Million), Market Share (%) by Applications (2023-2030)
11.3 Europe Children’s Smartphone Revenue (USD Million), by Type, and Applications (2023-2030)
11.3.1 Europe Children’s Smartphone Revenue (USD Million), by Country (2023-2030)
11.3.2 Europe Children’s Smartphone Revenue (USD Million), by Type (2023-2030)
11.3.3 Europe Children’s Smartphone Revenue (USD Million), by Applications (2023-2030)
11.4 Asia Pacific Children’s Smartphone Revenue (USD Million) by Type, and Applications (2023-2030)
11.4.1 Asia Pacific Children’s Smartphone Revenue (USD Million), by Country (2023-2030)
11.4.2 Asia Pacific Children’s Smartphone Revenue (USD Million), by Type (2023-2030)
11.4.3 Asia Pacific Children’s Smartphone Revenue (USD Million), by Applications (2023-2030)
11.5 South America Children’s Smartphone Revenue (USD Million), by Type, and Applications (2023-2030)
11.5.1 South America Children’s Smartphone Revenue (USD Million), by Country (2023-2030)
11.5.2 South America Children’s Smartphone Revenue (USD Million), by Type (2023-2030)
11.5.3 South America Children’s Smartphone Revenue (USD Million), by Applications (2023-2030)
11.6 Middle East and Africa Children’s Smartphone Revenue (USD Million), by Type, and Applications (2023-2030)
11.6.1 Middle East and Africa Children’s Smartphone Revenue (USD Million), by Region (2023-2030)
11.6.2 Middle East and Africa Children’s Smartphone Revenue (USD Million), by Type (2023-2030)
11.6.3 Middle East and Africa Children’s Smartphone Revenue (USD Million), by Applications (2023-2030)
12 Methodology and Data Sources
12.1 Methodology/Research Approach
12.1.1 Research Programs/Design
12.1.2 Market Size Estimation
12.1.3 Market Breakdown and Data Triangulation
12.2 Data Sources
12.2.1 Secondary Sources
12.2.2 Primary Sources
12.3 Disclaimer
List Of Tables
Table 1 Market Segmentation Analysis
Table 2 Global Children’s Smartphone Market Companies with Areas Served
Table 3 Products Offerings Global Children’s Smartphone Market
Table 4 Low Growth Scenario Forecasts
Table 5 Reference Case Growth Scenario
Table 6 High Growth Case Scenario
Table 7 Global Children’s Smartphone Revenue (USD Million) And CAGR (%) By Type (2018-2030)
Table 8 Global Children’s Smartphone Revenue (USD Million) And CAGR (%) By Applications (2018-2030)
Table 9 Global Children’s Smartphone Revenue (USD Million) And CAGR (%) By Regions (2018-2030)
Table 10 Global Children’s Smartphone Revenue (USD Million) By Type (2018-2022)
Table 11 Global Children’s Smartphone Revenue Market Share (%) By Type (2018-2022)
Table 12 Global Children’s Smartphone Revenue (USD Million) By Applications (2018-2022)
Table 13 Global Children’s Smartphone Revenue Market Share (%) By Applications (2018-2022)
Table 14 Global Children’s Smartphone Market Revenue (USD Million) By Regions (2018-2022)
Table 15 Global Children’s Smartphone Market Share (%) By Regions (2018-2022)
Table 16 North America Children’s Smartphone Revenue (USD Million) By Country (2018-2022)
Table 17 North America Children’s Smartphone Revenue (USD Million) By Type (2018-2022)
Table 18 North America Children’s Smartphone Revenue (USD Million) By Applications (2018-2022)
Table 19 Europe Children’s Smartphone Revenue (USD Million) By Country (2018-2022)
Table 20 Europe Children’s Smartphone Revenue (USD Million) By Type (2018-2022)
Table 21 Europe Children’s Smartphone Revenue (USD Million) By Applications (2018-2022)
Table 22 Asia Pacific Children’s Smartphone Revenue (USD Million) By Country (2018-2022)
Table 23 Asia Pacific Children’s Smartphone Revenue (USD Million) By Type (2018-2022)
Table 24 Asia Pacific Children’s Smartphone Revenue (USD Million) By Applications (2018-2022)
Table 25 South America Children’s Smartphone Revenue (USD Million) By Country (2018-2022)
Table 26 South America Children’s Smartphone Revenue (USD Million) By Type (2018-2022)
Table 27 South America Children’s Smartphone Revenue (USD Million) By Applications (2018-2022)
Table 28 Middle East and Africa Children’s Smartphone Revenue (USD Million) By Region (2018-2022)
Table 29 Middle East and Africa Children’s Smartphone Revenue (USD Million) By Type (2018-2022)
Table 30 Middle East and Africa Children’s Smartphone Revenue (USD Million) By Applications (2018-2022)
Table 31 Financial Analysis
Table 32 Global Children’s Smartphone Revenue (USD Million) By Type (2023-2030)
Table 33 Global Children’s Smartphone Revenue Market Share (%) By Type (2023-2030)
Table 34 Global Children’s Smartphone Revenue (USD Million) By Applications (2023-2030)
Table 35 Global Children’s Smartphone Revenue Market Share (%) By Applications (2023-2030)
Table 36 Global Children’s Smartphone Market Revenue (USD Million), And Revenue (USD Million) By Regions (2023-2030)
Table 37 North America Children’s Smartphone Revenue (USD)By Country (2023-2030)
Table 38 North America Children’s Smartphone Revenue (USD Million) By Type (2023-2030)
Table 39 North America Children’s Smartphone Revenue (USD Million) By Applications (2023-2030)
Table 40 Europe Children’s Smartphone Revenue (USD Million) By Country (2023-2030)
Table 41 Europe Children’s Smartphone Revenue (USD Million) By Type (2023-2030)
Table 42 Europe Children’s Smartphone Revenue (USD Million) By Applications (2023-2030)
Table 43 Asia Pacific Children’s Smartphone Revenue (USD Million) By Country (2023-2030)
Table 44 Asia Pacific Children’s Smartphone Revenue (USD Million) By Type (2023-2030)
Table 45 Asia Pacific Children’s Smartphone Revenue (USD Million) By Applications (2023-2030)
Table 46 South America Children’s Smartphone Revenue (USD Million) By Country (2023-2030)
Table 47 South America Children’s Smartphone Revenue (USD Million) By Type (2023-2030)
Table 48 South America Children’s Smartphone Revenue (USD Million) By Applications (2023-2030)
Table 49 Middle East and Africa Children’s Smartphone Revenue (USD Million) By Region (2023-2030)
Table 50 Middle East and Africa Children’s Smartphone Revenue (USD Million) By Region (2023-2030)
Table 51 Middle East and Africa Children’s Smartphone Revenue (USD Million) By Type (2023-2030)
Table 52 Middle East and Africa Children’s Smartphone Revenue (USD Million) By Applications (2023-2030)
Table 53 Research Programs/Design for This Report
Table 54 Key Data Information from Secondary Sources
Table 55 Key Data Information from Primary Sources
List Of Figures
Figure 1 Market Scope
Figure 2 Porter’s Five Forces
Figure 3 Global Children’s Smartphone Revenue (USD Million) By Type (2018-2022)
Figure 4 Global Children’s Smartphone Revenue Market Share (%) By Type (2022)
Figure 5 Global Children’s Smartphone Revenue (USD Million) By Applications (2018-2022)
Figure 6 Global Children’s Smartphone Revenue Market Share (%) By Applications (2022)
Figure 7 Global Children’s Smartphone Market Revenue (USD Million) By Regions (2018-2022)
Figure 8 Global Children’s Smartphone Market Share (%) By Regions (2022)
Figure 9 North America Children’s Smartphone Revenue (USD Million) By Country (2018-2022)
Figure 10 North America Children’s Smartphone Revenue (USD Million) By Type (2018-2022)
Figure 11 North America Children’s Smartphone Revenue (USD Million) By Applications (2018-2022)
Figure 12 Europe Children’s Smartphone Revenue (USD Million) By Country (2018-2022)
Figure 13 Europe Children’s Smartphone Revenue (USD Million) By Type (2018-2022)
Figure 14 Europe Children’s Smartphone Revenue (USD Million) By Applications (2018-2022)
Figure 15 Asia Pacific Children’s Smartphone Revenue (USD Million) By Country (2018-2022)
Figure 16 Asia Pacific Children’s Smartphone Revenue (USD Million) By Type (2018-2022)
Figure 17 Asia Pacific Children’s Smartphone Revenue (USD Million) By Applications (2018-2022)
Figure 18 South America Children’s Smartphone Revenue (USD Million) By Country (2018-2022)
Figure 19 South America Children’s Smartphone Revenue (USD Million) By Type (2018-2022)
Figure 20 South America Children’s Smartphone Revenue (USD Million) By Applications (2018-2022)
Figure 21 Middle East and Africa Children’s Smartphone Revenue (USD Million) By Region (2018-2022)
Figure 22 Middle East and Africa Children’s Smartphone Revenue (USD Million) By Type (2018-2022)
Figure 23 Middle East and Africa Children’s Smartphone Revenue (USD Million) By Applications (2018-2022)
Figure 24 Global Children’s Smartphone Revenue (USD Million) By Type (2023-2030)
Figure 25 Global Children’s Smartphone Revenue Market Share (%) By Type (2030)
Figure 26 Global Children’s Smartphone Revenue (USD Million) By Applications (2023-2030)
Figure 27 Global Children’s Smartphone Revenue Market Share (%) By Applications (2030)
Figure 28 Global Children’s Smartphone Market Revenue (USD Million) By Regions (2023-2030)
Figure 29 North America Children’s Smartphone Revenue (USD Million) By Country (2023-2030)
Figure 30 North America Children’s Smartphone Revenue (USD Million) By Type (2023-2030)
Figure 31 North America Children’s Smartphone Revenue (USD Million) By Applications (2023-2030)
Figure 32 Europe Children’s Smartphone Revenue (USD Million) By Country (2023-2030)
Figure 33 Europe Children’s Smartphone Revenue (USD Million) By Type (2023-2030)
Figure 34 Europe Children’s Smartphone Revenue (USD Million) By Applications (2023-2030)
Figure 35 Asia Pacific Children’s Smartphone Revenue (USD Million) By Country (2023-2030)
Figure 36 Asia Pacific Children’s Smartphone Revenue (USD Million) By Type (2023-2030)
Figure 37 Asia Pacific Children’s Smartphone Revenue (USD Million) By Applications (2023-2030)
Figure 38 South America Children’s Smartphone Revenue (USD Million) By Country (2023-2030)
Figure 39 South America Children’s Smartphone Revenue (USD Million) By Type (2023-2030)
Figure 40 South America Children’s Smartphone Revenue (USD Million) By Applications (2023-2030)
Figure 41 Middle East and Africa Children’s Smartphone Revenue (USD Million) By Region (2023-2030)
Figure 42 Middle East and Africa Children’s Smartphone Revenue (USD Million) By Region (2023-2030)
Figure 43 Middle East and Africa Children’s Smartphone Revenue (USD Million) By Type (2023-2030)
Figure 44 Middle East and Africa Children’s Smartphone Revenue (USD Million) By Applications (2023-2030)
Figure 45 Bottom-Up and Top-Down Approaches For This Report
Figure 46 Data Triangulation
