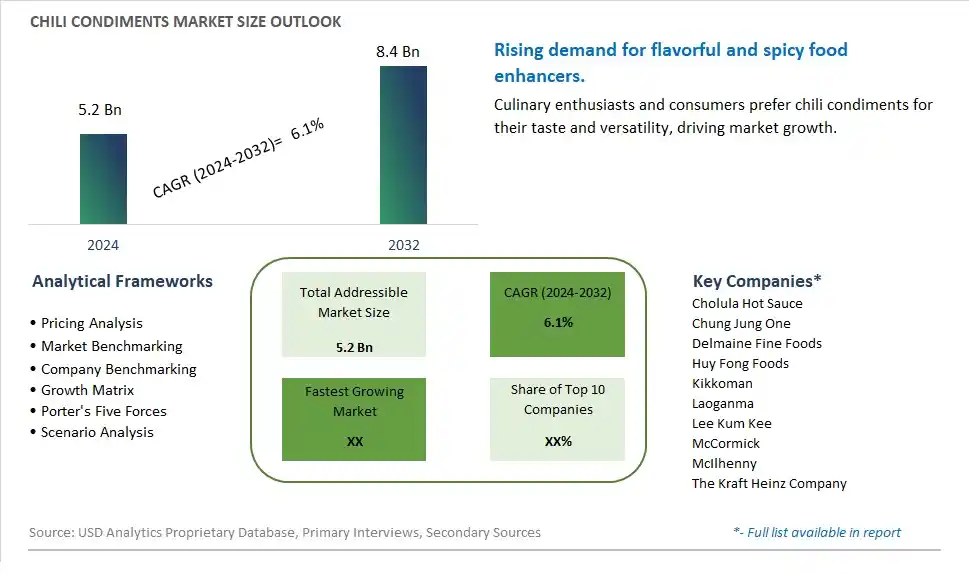
Global Chili Condiments Market Size is valued at $5.2 Billion in 2024 and is forecast to register a growth rate (CAGR) of 6.1% to reach $8.4 Billion by 2032.
The global Chili Condiments Market Comprehensive Study analyzes and forecasts the market size across 6 regions and 24 countries for diverse segments -By Type (Capsicol, Chilli Sauce, Chilli Powder, Others), By Application (Home Use, Commercial Use)
An Introduction to Chili Condiments Market
In 2024, the Chili Condiment market is witnessing significant growth, driven by the increasing demand for spicy and flavorful food enhancers. Chili condiments, including sauces, pastes, and powders, are valued for their ability to add heat and depth to a variety of dishes. The market is supported by the growing popularity of global cuisines and the trend towards bold and adventurous flavors. Advances in processing and packaging technologies are enhancing the quality, flavor, and shelf life of chili condiments. The market is also benefiting from the trend towards clean-label and natural ingredients, appealing to consumers seeking authentic and high-quality spicy condiments.
Chili Condiments Competitive Landscape
The market report analyses the leading companies in the industry including Cholula Hot Sauce, Chung Jung One, Delmaine Fine Foods, Huy Fong Foods, Kikkoman, Laoganma, Lee Kum Kee, McCormick, McIlhenny, The Kraft Heinz Company, and Others.
Chili Condiments Market Dynamics
Chili Condiment Market Trend: Growing Interest in Spicy and Flavorful Condiments
A prominent market trend for chili condiments is the growing interest among consumers in spicy and flavorful condiments. With a global appreciation for diverse cuisines and bold flavors, there's an increasing demand for condiments that add heat, complexity, and depth of flavor to dishes. Chili condiments, ranging from hot sauces to chili pastes and pepper blends, are gaining popularity as versatile flavor enhancers that cater to adventurous palates and culinary experimentation.
Chili Condiment Market Driver: Ethnic Food Exploration and Culinary Diversity
A key driver fueling the market for chili condiments is the trend towards ethnic food exploration and culinary diversity. As consumers embrace multicultural dining experiences and seek authentic flavors from around the world, there's a demand for condiments that capture the essence of regional cuisines. Chili condiments sourced from specific chili pepper varieties, regional spice blends, and traditional recipes appeal to consumers looking to replicate authentic flavors and spice levels in their homemade meals.
Chili Condiment Market Opportunity: Premiumization and Gourmet Varieties
An opportunity within the chili condiment market lies in premiumization and gourmet varieties. Manufacturers can develop artisanal chili condiments using high-quality chili peppers, premium ingredients, and unique flavor profiles to target discerning consumers seeking elevated culinary experiences. Additionally, exploring organic, small-batch, or limited-edition chili condiments, incorporating specialty ingredients like smoked peppers, exotic spices, or aged vinegars, can attract food enthusiasts and gourmet connoisseurs willing to pay a premium for distinctive and artisanal condiment offerings. By focusing on quality, authenticity, and innovation, companies can capitalize on the market opportunity presented by the demand for premium and gourmet chili condiments.
Chili Condiments Market Share Analysis- Largest Segment by Type
The Chilli Sauce segment is the largest in the Chili Condiments Market by type. This prominence is driven by the widespread use of chili sauce as a condiment in various cuisines around the world. Chili sauce is versatile and enhances the flavor of a wide range of dishes, from Asian and Latin American cuisines to everyday meals. The growing popularity of spicy foods and the increasing demand for convenient and ready-to-use sauces contribute to the large market share of the chili sauce segment. Additionally, the continuous innovation in chili sauce formulations, including different heat levels, flavors, and packaging options, attracts a broad consumer base. The trend towards global flavors and the influence of international cuisines further boost the demand for chili sauce, reinforcing its dominant position in the market.
Chili Condiments Market Share Analysis- Fastest Growing Segment by Application
The Home Use segment is poised to grow the fastest in the Chili Condiments Market by application over the next five years. This rapid growth is driven by the increasing consumer interest in cooking and experimenting with different flavors at home. The rising popularity of home-cooked meals, influenced by cooking shows, social media, and food blogs, encourages consumers to use chili condiments to enhance their dishes. Additionally, the growing trend of meal kits and ready-to-cook products that include chili condiments supports the expansion of the home use segment. The convenience and versatility of chili condiments, combined with the desire for personalized and flavorful meals, drive the fast growth of this segment. The impact of the COVID-19 pandemic, which has increased home cooking and dining, further accelerates the demand for chili condiments in home use.
Chili Condiments Market Segmentation
By Type
Capsicol
Chilli Sauce
Chilli Powder
Others
By Application
Home Use
Commercial Use
Countries Analyzed
North America (US, Canada, Mexico)
Europe (Germany, UK, France, Spain, Italy, Russia, Rest of Europe)
Asia Pacific (China, India, Japan, South Korea, Australia, South East Asia, Rest of Asia)
South America (Brazil, Argentina, Rest of South America)
Middle East and Africa (Saudi Arabia, UAE, Rest of Middle East, South Africa, Egypt, Rest of Africa)
Chili Condiments Companies Profiled in the Study
Cholula Hot Sauce
Chung Jung One
Delmaine Fine Foods
Huy Fong Foods
Kikkoman
Laoganma
Lee Kum Kee
McCormick
McIlhenny
The Kraft Heinz Company
*- List Not Exhaustive
Chapter 1. TABLE OF CONTENTS
Chapter 2. Introduction to Chili Condiments Market
2.1. Market Overview
2.2. Key Statistics and Report Highlights
2.3. Scope of the Comprehensive Study
2.3.1. Market Definition
2.3.2 Countries and Regions Covered
2.3.3 Research Objective
2.3.4 Units, Currency, and Conversions
2.3.5 Industry Value Chain
2.4. Key Market Segments
2.5. Key Companies
2.6. Study Period
Chapter 3. Strategic Analysis Review
3.1. Chili Condiments Pricing Analysis and Forecast
3.2. Porter’s Five Forces
3.3. Market Ecosystem
3.4. SWOT Analysis
3.5. Regulatory Scenario
3.3. Effects of Inflation, Russia-Ukraine War, moderating economic growth, and other macroeconomic factors
Chapter 4. Competitive Landscape
4.1. Market Share Analysis
4.1.1. Global Chili Condiments Market Share by Company, 2023
4.1.2. Product Offerings of Leading Chili Condiments Companies
4.2. Market Entropy
4.2.1. New Product Launches in the Industry
4.2.2. Mergers, Acquisitions, Joint ventures, and Partnerships
4.3. Key Strategies and Best Practices
Chapter 5. Global Market Projections: Best, Reference, and Low Case Scenarios
5.1. Growth Analysis- Case Scenario Definitions
5.2. Low Growth Case Scenario Forecasts
5.3. Reference Growth Case Scenario Forecasts
5.4. High Growth Case Scenario Forecasts
Chapter 6. Market Dynamics
6.1. Chili Condiments Market Drivers
6.2. Chili Condiments Market Challenges
6.6. Chili Condiments Market Opportunities
6.4. Chili Condiments Market Trends
Chapter 7. Global Chili Condiments Market Outlook Trends
7.1. Global Chili Condiments Revenue (USD Million) and CAGR (%) by Type (2021-2032)
7.2. Global Chili Condiments Revenue (USD Million) and CAGR (%) by Application (2021-2032)
7.3. Global Chili Condiments Revenue (USD Million) and CAGR (%) by Product (2021-2032)
By Type
Capsicol
Chilli Sauce
Chilli Powder
Others
By Application
Home Use
Commercial Use
Chapter 8. Global Chili Condiments Regional Analysis and Outlook
8.1. Global Chili Condiments Revenue (USD Million) By Regions (2021- 2032)
8.2. North America Chili Condiments Revenue (USD Million) by Country (2021-2032)
8.2.1. United States Chili Condiments Regional Analysis and Outlook
8.2.2. Canada Chili Condiments Regional Analysis and Outlook
8.2.3. Mexico Chili Condiments Regional Analysis and Outlook
8.3. Europe Chili Condiments Revenue (USD Million), by Country (2021-2032)
8.3.1. Germany Chili Condiments Regional Analysis and Outlook
8.3.2. France Chili Condiments Regional Analysis and Outlook
8.3.3. United Kingdom Chili Condiments Regional Analysis and Outlook
8.3.4. Spain Chili Condiments Regional Analysis and Outlook
8.3.5. Italy Chili Condiments Regional Analysis and Outlook
8.3.6. Russia Chili Condiments Regional Analysis and Outlook
8.3.7. Rest of Europe Chili Condiments Regional Analysis and Outlook
8.4. Asia Pacific Chili Condiments Revenue (USD Million) by Country (2021-2032)
8.4.1. China Chili Condiments Regional Analysis and Outlook
8.4.2. Japan Chili Condiments Regional Analysis and Outlook
8.4.3. India Chili Condiments Regional Analysis and Outlook
8.4.4. South Korea Chili Condiments Regional Analysis and Outlook
8.4.5. Australia Chili Condiments Regional Analysis and Outlook
8.4.6. South East Asia Chili Condiments Regional Analysis and Outlook
8.4.7. Rest of Asia Pacific Chili Condiments Regional Analysis and Outlook
8.5. South America Chili Condiments Revenue (USD Million), by Country (2021-2032)
8.5.1. Brazil Chili Condiments Regional Analysis and Outlook
8.5.2. Argentina Chili Condiments Regional Analysis and Outlook
8.5.3. Rest of South America Chili Condiments Regional Analysis and Outlook
8.6. Middle East and Africa Chili Condiments Revenue (USD Million) by Country (2021-2032)
8.6.1. Middle East Chili Condiments Regional Analysis and Outlook
8.6.2. Africa Chili Condiments Regional Analysis and Outlook
Chapter 9. North America Chili Condiments Analysis and Outlook
9.1. North America Chili Condiments Revenue (USD Million) by Segments (2021-2032)
9.1.1. North America Chili Condiments Revenue (USD Million) by Type (2021-2032)
9.1.2. North America Chili Condiments Revenue (USD Million) by Application (2021-2032)
9.1.3. North America Chili Condiments Revenue (USD Million) by Product (2021-2032)
By Type
Capsicol
Chilli Sauce
Chilli Powder
Others
By Application
Home Use
Commercial Use
Chapter 10. Europe Chili Condiments Analysis and Outlook
10.1. Europe Chili Condiments Revenue (USD Million), by Segments (USD Million) (2021-2032)
10.1.1. Europe Chili Condiments Revenue (USD Million) by Type (2021-2032)
10.1.2. Europe Chili Condiments Revenue (USD Million) by Application (2021-2032)
10.1.3. Europe Chili Condiments Revenue (USD Million) by Product (2021-2032)
By Type
Capsicol
Chilli Sauce
Chilli Powder
Others
By Application
Home Use
Commercial Use
Chapter 11. Asia Pacific Chili Condiments Analysis and Outlook
11.1. Asia Pacific Chili Condiments Revenue (USD Million), and Revenue (USD Million) by Segments (2021-2032)
11.1.1. Asia Pacific Chili Condiments Revenue (USD Million) by Type (2021-2032)
11.1.2. Asia Pacific Chili Condiments Revenue (USD Million) by Application (2021-2032)
11.1.3. Asia Pacific Chili Condiments Revenue (USD Million) by Product (2021-2032)
By Type
Capsicol
Chilli Sauce
Chilli Powder
Others
By Application
Home Use
Commercial Use
Chapter 12. South America Chili Condiments Analysis and Outlook
12.1. South America Chili Condiments Revenue (USD Million), by Segments (2021-2032)
12.1.1. South America Chili Condiments Revenue (USD Million) by Type (2021-2032)
12.1.2. South America Chili Condiments Revenue (USD Million) by Application (2021-2032)
12.1.3. South America Chili Condiments Revenue (USD Million) by Product (2021-2032)
By Type
Capsicol
Chilli Sauce
Chilli Powder
Others
By Application
Home Use
Commercial Use
Chapter 13. Middle East and Africa Chili Condiments Analysis and Outlook
13.1. Middle East and Africa Chili Condiments Revenue (USD Million), by Segments (2021-2032)
13.1.1. Middle East and Africa Chili Condiments Revenue (USD Million) by Type (2021-2032)
13.1.2. Middle East and Africa Chili Condiments Revenue (USD Million) by Application (2021-2032)
13.1.3. Middle East and Africa Chili Condiments Revenue (USD Million) by Product (2021-2032)
By Type
Capsicol
Chilli Sauce
Chilli Powder
Others
By Application
Home Use
Commercial Use
Chapter 14. Chili Condiments Company Profiles
14.1 Business Overview
14.2 Product Profiles
14.3 SWOT Profiles
14.5 Recent Developments
14.6 Financial Profile
List of Companies
Cholula Hot Sauce
Chung Jung One
Delmaine Fine Foods
Huy Fong Foods
Kikkoman
Laoganma
Lee Kum Kee
McCormick
McIlhenny
The Kraft Heinz Company
15. Methodology and Data Sources
15.1 Customization Offerings
15.2 Subscription Services
15.3 Related Reports
15.4 Publisher Expertise
LIST OF TABLES
Table 1 Market Segmentation Analysis
Table 2 Global Chili Condiments Market Share of Leading Companies, 2023
Table 3 Product Offerings of Leading Companies
Table 4 Low Growth Scenario Forecasts
Table 5 Reference Case Growth Scenario
Table 6 High Growth Case Scenario
Table 7 Global Chili Condiments Revenue (USD Million) And CAGR (%) By Type (2021-2032)
Table 8 Global Chili Condiments Revenue (USD Million) And CAGR (%) By Application (2021-2032)
Table 9 Global Chili Condiments Revenue (USD Million) And CAGR (%) By Product (2021-2032)
Table 10 Global Chili Condiments Market Revenue (USD Million) By Regions (2021-2032)
Table 11 Global Chili Condiments Market Share (%) By Regions (2021-2032)
Table 12 North America Chili Condiments Revenue (USD Million) By Country (2021-2032)
Table 13 Europe Chili Condiments Revenue (USD Million) By Country (2021-2032)
Table 14 Asia Pacific Chili Condiments Revenue (USD Million) By Country (2021-2032)
Table 15 South America Chili Condiments Revenue (USD Million) By Country (2021-2032)
Table 16 Middle East and Africa Chili Condiments Revenue (USD Million) By Region (2021-2032)
Table 17 North America Chili Condiments Revenue (USD Million) By Type (2021-2032)
Table 18 North America Chili Condiments Revenue (USD Million) By Application (2021-2032)
Table 19 North America Chili Condiments Revenue (USD Million) By Product (2021-2032)
Table 20 Europe Chili Condiments Revenue (USD Million) By Type (2021-2032)
Table 21 Europe Chili Condiments Revenue (USD Million) By Application (2021-2032)
Table 22 Europe Chili Condiments Revenue (USD Million) By Product (2021-2032)
Table 23 Asia Pacific Chili Condiments Revenue (USD Million) By Type (2021-2032)
Table 24 Asia Pacific Chili Condiments Revenue (USD Million) By Application (2021-2032)
Table 25 Asia Pacific Chili Condiments Revenue (USD Million) By Product (2021-2032)
Table 26 South America Chili Condiments Revenue (USD Million) By Type (2021-2032)
Table 27 South America Chili Condiments Revenue (USD Million) By Application (2021-2032)
Table 28 South America Chili Condiments Revenue (USD Million) By Product (2021-2032)
Table 29 Middle East and Africa Chili Condiments Revenue (USD Million) By Type (2021-2032)
Table 30 Middle East and Africa Chili Condiments Revenue (USD Million) By Application (2021-2032)
Table 31 Middle East and Africa Chili Condiments Revenue (USD Million) By Product (2021-2032)
LIST OF FIGURES
Figure 1. Market Scope
Figure 2. Pricing Forecasts Per Unit, 2023- 2032
Figure 3. Porter’s Five Forces
Figure 4. Global Chili Condiments Market Revenue (USD Million) By Regions (2021-2032)
Figure 5. Global Chili Condiments Market Share (%) By Regions (2023)
Figure 6. North America Chili Condiments Revenue (USD Million) By Country (2021-2032)
Figure 7. United States Chili Condiments Revenue (USD Million) By Country (2021-2032)
Figure 8. Canada Chili Condiments Revenue (USD Million) By Country (2021-2032)
Figure 9. Mexico Chili Condiments Revenue (USD Million) By Country (2021-2032)
Figure 10. Europe Chili Condiments Revenue (USD Million) By Country (2021-2032)
Figure 11. Germany Chili Condiments Revenue (USD Million) By Country (2021-2032)
Figure 12. France Chili Condiments Revenue (USD Million) By Country (2021-2032)
Figure 13. United Kingdom Chili Condiments Revenue (USD Million) By Country (2021-2032)
Figure 14. Spain Chili Condiments Revenue (USD Million) By Country (2021-2032)
Figure 15. Italy Chili Condiments Revenue (USD Million) By Country (2021-2032)
Figure 16. Russia Chili Condiments Revenue (USD Million) By Country (2021-2032)
Figure 17. Rest of Europe Chili Condiments Revenue (USD Million) By Country (2021-2032)
Figure 11. Asia Pacific Chili Condiments Revenue (USD Million) By Country (2021-2032)
Figure 12. China Chili Condiments Revenue (USD Million) By Country (2021-2032)
Figure 13. Japan Chili Condiments Revenue (USD Million) By Country (2021-2032)
Figure 14. India Chili Condiments Revenue (USD Million) By Country (2021-2032)
Figure 15. South Korea Chili Condiments Revenue (USD Million) By Country (2021-2032)
Figure 16. Australia Chili Condiments Revenue (USD Million) By Country (2021-2032)
Figure 17. South East Asia Chili Condiments Revenue (USD Million) By Country (2021-2032)
Figure 18. South America Chili Condiments Revenue (USD Million) By Country (2021-2032)
Figure 19. Brazil Chili Condiments Revenue (USD Million) By Country (2021-2032)
Figure 20. Argentina Chili Condiments Revenue (USD Million) By Country (2021-2032)
Figure 21. Rest of Asia Pacific Chili Condiments Revenue (USD Million) By Country (2021-2032)
Figure 22. Middle East and Africa Chili Condiments Revenue (USD Million) By Region (2021-2032)
Figure 23. Saudi Arabia Chili Condiments Revenue (USD Million) By Region (2021-2032)
Figure 24. The UAE Chili Condiments Revenue (USD Million) By Region (2021-2032)
Figure 25. Rest of Middle East Chili Condiments Revenue (USD Million) By Region (2021-2032)
Figure 26. South Africa Chili Condiments Revenue (USD Million) By Region (2021-2032)
Figure 27. Africa Chili Condiments Revenue (USD Million) By Region (2021-2032)
Figure 28. North America Chili Condiments Revenue (USD Million) By Type (2021-2032)
Figure 29. North America Chili Condiments Revenue (USD Million) By Application (2021-2032)
Figure 30. North America Chili Condiments Revenue (USD Million) By Product (2021-2032)
Figure 31. Europe Chili Condiments Revenue (USD Million) By Type (2021-2032)
Figure 32. Europe Chili Condiments Revenue (USD Million) By Application (2021-2032)
Figure 33. Europe Chili Condiments Revenue (USD Million) By Product (2021-2032)
Figure 34. Asia Pacific Chili Condiments Revenue (USD Million) By Type (2021-2032)
Figure 35. Asia Pacific Chili Condiments Revenue (USD Million) By Application (2021-2032)
Figure 36. Asia Pacific Chili Condiments Revenue (USD Million) By Product (2021-2032)
Figure 37. South America Chili Condiments Revenue (USD Million) By Type (2021-2032)
Figure 38. South America Chili Condiments Revenue (USD Million) By Application (2021-2032)
Figure 39. South America Chili Condiments Revenue (USD Million) By Product (2021-2032)
Figure 40. Middle East and Africa Chili Condiments Revenue (USD Million) By Type (2021-2032)
Figure 41. Middle East and Africa Chili Condiments Revenue (USD Million) By Application (2021-2032)
Figure 42. Middle East and Africa Chili Condiments Revenue (USD Million) By Product (2021-2032)
By Type
Capsicol
Chilli Sauce
Chilli Powder
Others
By Application
Home Use
Commercial Use
Countries Analyzed
North America (US, Canada, Mexico)
Europe (Germany, UK, France, Spain, Italy, Russia, Rest of Europe)
Asia Pacific (China, India, Japan, South Korea, Australia, South East Asia, Rest of Asia)
South America (Brazil, Argentina, Rest of South America)
Middle East and Africa (Saudi Arabia, UAE, Rest of Middle East, South Africa, Egypt, Rest of Africa)
