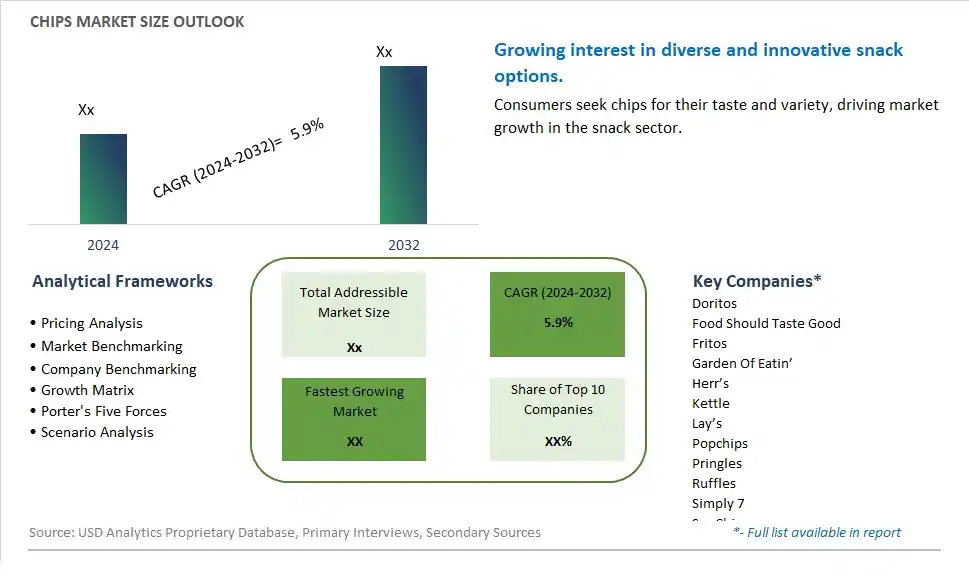
Global Chips Market Size is valued at $XX Million in 2024 and is forecast to register a growth rate (CAGR) of 5.9% to reach $XX Million by 2032.
The global Chips Market Comprehensive Study analyzes and forecasts the market size across 6 regions and 24 countries for diverse segments -By Type (Corn Chips, Potato Chips, Tortilla Chips, Multigrain Chips, Others), By Application (Supermarkets/Hypermarkets, Convenience Stores, Independent Retailers, Online Sales, Others)
An Introduction to Chips Market
The Chips market in 2024 is expanding robustly, driven by the increasing demand for convenient and flavorful snack options. The market includes a wide variety of chips, such as potato chips, tortilla chips, and vegetable chips, catering to diverse taste preferences and dietary needs. The market is supported by the growing trend towards snacking and the demand for innovative and healthier chip options. Advances in chip production and flavoring technologies are enhancing the quality, taste, and nutritional content of chips. The market is also benefiting from the trend towards clean-label and organic products, appealing to health-conscious consumers seeking high-quality and flavorful snacks.
Chips Competitive Landscape
The market report analyses the leading companies in the industry including Doritos, Food Should Taste Good, Fritos, Garden Of Eatin’, Herr’s, Kettle, Lay’s, Popchips, Pringles, Ruffles, Simply 7, SunChips, TERRA, Tostitos, and Others.
Chips Market Dynamics
Chips Market Trend: Growth in Healthier Snacking Options
A prominent market trend for chips is the growth in demand for healthier snacking options among consumers. With an increasing focus on health and wellness, there's a shift towards chips made from natural ingredients, whole grains, vegetables, and alternative sources such as legumes or roots. Consumers are seeking chips that offer nutritional benefits, reduced sodium and fat content, and are free from artificial flavors, colors, and preservatives.
Chips Market Driver: Convenience and On-the-Go Eating Habits
A key driver fueling the market for chips is the convenience factor and on-the-go eating habits of consumers. Chips provide a convenient and portable snack option that can be enjoyed anytime, anywhere, making them popular choices for busy individuals, students, travelers, and office workers. The variety of chip flavors and textures available caters to diverse taste preferences and snacking occasions, driving consistent demand for this convenient snack category.
Chips Market Opportunity: Innovation in Flavor Profiles and Functional Ingredients
An opportunity within the chips market lies in innovation, particularly in flavor profiles and functional ingredients. Manufacturers can develop chips with unique and exciting flavor combinations, inspired by global cuisines, gourmet ingredients, and trending flavor trends. Additionally, incorporating functional ingredients such as superfoods, protein-rich sources, plant-based seasonings, or gluten-free options can attract health-conscious consumers seeking snacks with added nutritional value. By leveraging innovation in flavors and ingredients, companies can differentiate their chip offerings and capture market share in the competitive snacking industry.
Chips Market Share Analysis: Potato Chips is the fastest growing segment over the forecast period to 2032
Potato Chips are experiencing the fastest growth in the Chips Market by type. This growth is largely driven by their widespread popularity and established presence in the snacking industry. Potato chips have long been a favorite snack for consumers of all ages due to their satisfying crunch, variety of flavors, and convenience. The segment's growth is further propelled by continuous innovation in flavor profiles, catering to diverse taste preferences around the world. From classic salted to exotic and gourmet flavors, potato chips offer something for everyone, driving consistent demand. Additionally, the expansion of healthier options, such as baked and low-sodium potato chips, appeals to health-conscious consumers who still want to indulge in their favorite snack. Marketing strategies and promotional activities by leading brands have also played a significant role in maintaining the popularity of potato chips. The ease of availability in various retail formats, including supermarkets, convenience stores, and online platforms, ensures that potato chips remain accessible to a broad consumer base. As manufacturers continue to innovate and introduce new flavors and healthier options, the Potato Chips segment is set to maintain its rapid growth trajectory, reinforcing its position as a dominant player in the chips market.
Chips Market Share Analysis: Online Sales is the fastest growing segment over the forecast period to 2032
The Online Sales segment is projected to be the fastest growing in the Chips Market by application through 2032. This rapid growth is driven by the increasing penetration of e-commerce platforms and the rising trend of online shopping. Consumers are increasingly opting for the convenience of purchasing snacks like chips from the comfort of their homes, benefiting from the wide variety of options available online. Online platforms often offer competitive prices, exclusive discounts, and subscription services that appeal to cost-conscious and regular consumers. Additionally, the ability to read product reviews and compare different brands and flavors enhances the online shopping experience, making it easier for consumers to make informed purchasing decisions. The rise of direct-to-consumer (DTC) models by chip manufacturers also contributes to the growth of online sales, as brands can engage directly with customers, offer personalized promotions, and gather valuable consumer insights. The global pandemic has further accelerated the shift towards online shopping, with many consumers developing new habits that favor digital purchasing channels. As technology continues to advance and logistics networks improve, the Online Sales segment is expected to experience significant growth, becoming a dominant force in the chips market by 2032.
Chips Market Segmentation
By Type
Corn Chips
Potato Chips
Tortilla Chips
Multigrain Chips
Others
By Application
Supermarkets/Hypermarkets
Convenience Stores
Independent Retailers
Online Sales
Others
Countries Analyzed
North America (US, Canada, Mexico)
Europe (Germany, UK, France, Spain, Italy, Russia, Rest of Europe)
Asia Pacific (China, India, Japan, South Korea, Australia, South East Asia, Rest of Asia)
South America (Brazil, Argentina, Rest of South America)
Middle East and Africa (Saudi Arabia, UAE, Rest of Middle East, South Africa, Egypt, Rest of Africa)
Chips Companies Profiled in the Study
Doritos
Food Should Taste Good
Fritos
Garden Of Eatin’
Herr’s
Kettle
Lay’s
Popchips
Pringles
Ruffles
Simply 7
SunChips
TERRA
Tostitos
*- List Not Exhaustive
Chapter 1. TABLE OF CONTENTS
Chapter 2. Introduction to Chips Market
2.1. Market Overview
2.2. Key Statistics and Report Highlights
2.3. Scope of the Comprehensive Study
2.3.1. Market Definition
2.3.2 Countries and Regions Covered
2.3.3 Research Objective
2.3.4 Units, Currency, and Conversions
2.3.5 Industry Value Chain
2.4. Key Market Segments
2.5. Key Companies
2.6. Study Period
Chapter 3. Strategic Analysis Review
3.1. Chips Pricing Analysis and Forecast
3.2. Porter’s Five Forces
3.3. Market Ecosystem
3.4. SWOT Analysis
3.5. Regulatory Scenario
3.3. Effects of Inflation, Russia-Ukraine War, moderating economic growth, and other macroeconomic factors
Chapter 4. Competitive Landscape
4.1. Market Share Analysis
4.1.1. Global Chips Market Share by Company, 2023
4.1.2. Product Offerings of Leading Chips Companies
4.2. Market Entropy
4.2.1. New Product Launches in the Industry
4.2.2. Mergers, Acquisitions, Joint ventures, and Partnerships
4.3. Key Strategies and Best Practices
Chapter 5. Global Market Projections: Best, Reference, and Low Case Scenarios
5.1. Growth Analysis- Case Scenario Definitions
5.2. Low Growth Case Scenario Forecasts
5.3. Reference Growth Case Scenario Forecasts
5.4. High Growth Case Scenario Forecasts
Chapter 6. Market Dynamics
6.1. Chips Market Drivers
6.2. Chips Market Challenges
6.6. Chips Market Opportunities
6.4. Chips Market Trends
Chapter 7. Global Chips Market Outlook Trends
7.1. Global Chips Revenue (USD Million) and CAGR (%) by Type (2021-2032)
7.2. Global Chips Revenue (USD Million) and CAGR (%) by Application (2021-2032)
7.3. Global Chips Revenue (USD Million) and CAGR (%) by Product (2021-2032)
By Type
Corn Chips
Potato Chips
Tortilla Chips
Multigrain Chips
Others
By Application
Supermarkets/Hypermarkets
Convenience Stores
Independent Retailers
Online Sales
Others
Chapter 8. Global Chips Regional Analysis and Outlook
8.1. Global Chips Revenue (USD Million) By Regions (2021- 2032)
8.2. North America Chips Revenue (USD Million) by Country (2021-2032)
8.2.1. United States Chips Regional Analysis and Outlook
8.2.2. Canada Chips Regional Analysis and Outlook
8.2.3. Mexico Chips Regional Analysis and Outlook
8.3. Europe Chips Revenue (USD Million), by Country (2021-2032)
8.3.1. Germany Chips Regional Analysis and Outlook
8.3.2. France Chips Regional Analysis and Outlook
8.3.3. United Kingdom Chips Regional Analysis and Outlook
8.3.4. Spain Chips Regional Analysis and Outlook
8.3.5. Italy Chips Regional Analysis and Outlook
8.3.6. Russia Chips Regional Analysis and Outlook
8.3.7. Rest of Europe Chips Regional Analysis and Outlook
8.4. Asia Pacific Chips Revenue (USD Million) by Country (2021-2032)
8.4.1. China Chips Regional Analysis and Outlook
8.4.2. Japan Chips Regional Analysis and Outlook
8.4.3. India Chips Regional Analysis and Outlook
8.4.4. South Korea Chips Regional Analysis and Outlook
8.4.5. Australia Chips Regional Analysis and Outlook
8.4.6. South East Asia Chips Regional Analysis and Outlook
8.4.7. Rest of Asia Pacific Chips Regional Analysis and Outlook
8.5. South America Chips Revenue (USD Million), by Country (2021-2032)
8.5.1. Brazil Chips Regional Analysis and Outlook
8.5.2. Argentina Chips Regional Analysis and Outlook
8.5.3. Rest of South America Chips Regional Analysis and Outlook
8.6. Middle East and Africa Chips Revenue (USD Million) by Country (2021-2032)
8.6.1. Middle East Chips Regional Analysis and Outlook
8.6.2. Africa Chips Regional Analysis and Outlook
Chapter 9. North America Chips Analysis and Outlook
9.1. North America Chips Revenue (USD Million) by Segments (2021-2032)
9.1.1. North America Chips Revenue (USD Million) by Type (2021-2032)
9.1.2. North America Chips Revenue (USD Million) by Application (2021-2032)
9.1.3. North America Chips Revenue (USD Million) by Product (2021-2032)
By Type
Corn Chips
Potato Chips
Tortilla Chips
Multigrain Chips
Others
By Application
Supermarkets/Hypermarkets
Convenience Stores
Independent Retailers
Online Sales
Others
Chapter 10. Europe Chips Analysis and Outlook
10.1. Europe Chips Revenue (USD Million), by Segments (USD Million) (2021-2032)
10.1.1. Europe Chips Revenue (USD Million) by Type (2021-2032)
10.1.2. Europe Chips Revenue (USD Million) by Application (2021-2032)
10.1.3. Europe Chips Revenue (USD Million) by Product (2021-2032)
By Type
Corn Chips
Potato Chips
Tortilla Chips
Multigrain Chips
Others
By Application
Supermarkets/Hypermarkets
Convenience Stores
Independent Retailers
Online Sales
Others
Chapter 11. Asia Pacific Chips Analysis and Outlook
11.1. Asia Pacific Chips Revenue (USD Million), and Revenue (USD Million) by Segments (2021-2032)
11.1.1. Asia Pacific Chips Revenue (USD Million) by Type (2021-2032)
11.1.2. Asia Pacific Chips Revenue (USD Million) by Application (2021-2032)
11.1.3. Asia Pacific Chips Revenue (USD Million) by Product (2021-2032)
By Type
Corn Chips
Potato Chips
Tortilla Chips
Multigrain Chips
Others
By Application
Supermarkets/Hypermarkets
Convenience Stores
Independent Retailers
Online Sales
Others
Chapter 12. South America Chips Analysis and Outlook
12.1. South America Chips Revenue (USD Million), by Segments (2021-2032)
12.1.1. South America Chips Revenue (USD Million) by Type (2021-2032)
12.1.2. South America Chips Revenue (USD Million) by Application (2021-2032)
12.1.3. South America Chips Revenue (USD Million) by Product (2021-2032)
By Type
Corn Chips
Potato Chips
Tortilla Chips
Multigrain Chips
Others
By Application
Supermarkets/Hypermarkets
Convenience Stores
Independent Retailers
Online Sales
Others
Chapter 13. Middle East and Africa Chips Analysis and Outlook
13.1. Middle East and Africa Chips Revenue (USD Million), by Segments (2021-2032)
13.1.1. Middle East and Africa Chips Revenue (USD Million) by Type (2021-2032)
13.1.2. Middle East and Africa Chips Revenue (USD Million) by Application (2021-2032)
13.1.3. Middle East and Africa Chips Revenue (USD Million) by Product (2021-2032)
By Type
Corn Chips
Potato Chips
Tortilla Chips
Multigrain Chips
Others
By Application
Supermarkets/Hypermarkets
Convenience Stores
Independent Retailers
Online Sales
Others
Chapter 14. Chips Company Profiles
14.1 Business Overview
14.2 Product Profiles
14.3 SWOT Profiles
14.5 Recent Developments
14.6 Financial Profile
List of Companies
Doritos
Food Should Taste Good
Fritos
Garden Of Eatin’
Herr’s
Kettle
Lay’s
Popchips
Pringles
Ruffles
Simply 7
SunChips
TERRA
Tostitos
15. Methodology and Data Sources
15.1 Customization Offerings
15.2 Subscription Services
15.3 Related Reports
15.4 Publisher Expertise
LIST OF TABLES
Table 1 Market Segmentation Analysis
Table 2 Global Chips Market Share of Leading Companies, 2023
Table 3 Product Offerings of Leading Companies
Table 4 Low Growth Scenario Forecasts
Table 5 Reference Case Growth Scenario
Table 6 High Growth Case Scenario
Table 7 Global Chips Revenue (USD Million) And CAGR (%) By Type (2021-2032)
Table 8 Global Chips Revenue (USD Million) And CAGR (%) By Application (2021-2032)
Table 9 Global Chips Revenue (USD Million) And CAGR (%) By Product (2021-2032)
Table 10 Global Chips Market Revenue (USD Million) By Regions (2021-2032)
Table 11 Global Chips Market Share (%) By Regions (2021-2032)
Table 12 North America Chips Revenue (USD Million) By Country (2021-2032)
Table 13 Europe Chips Revenue (USD Million) By Country (2021-2032)
Table 14 Asia Pacific Chips Revenue (USD Million) By Country (2021-2032)
Table 15 South America Chips Revenue (USD Million) By Country (2021-2032)
Table 16 Middle East and Africa Chips Revenue (USD Million) By Region (2021-2032)
Table 17 North America Chips Revenue (USD Million) By Type (2021-2032)
Table 18 North America Chips Revenue (USD Million) By Application (2021-2032)
Table 19 North America Chips Revenue (USD Million) By Product (2021-2032)
Table 20 Europe Chips Revenue (USD Million) By Type (2021-2032)
Table 21 Europe Chips Revenue (USD Million) By Application (2021-2032)
Table 22 Europe Chips Revenue (USD Million) By Product (2021-2032)
Table 23 Asia Pacific Chips Revenue (USD Million) By Type (2021-2032)
Table 24 Asia Pacific Chips Revenue (USD Million) By Application (2021-2032)
Table 25 Asia Pacific Chips Revenue (USD Million) By Product (2021-2032)
Table 26 South America Chips Revenue (USD Million) By Type (2021-2032)
Table 27 South America Chips Revenue (USD Million) By Application (2021-2032)
Table 28 South America Chips Revenue (USD Million) By Product (2021-2032)
Table 29 Middle East and Africa Chips Revenue (USD Million) By Type (2021-2032)
Table 30 Middle East and Africa Chips Revenue (USD Million) By Application (2021-2032)
Table 31 Middle East and Africa Chips Revenue (USD Million) By Product (2021-2032)
LIST OF FIGURES
Figure 1. Market Scope
Figure 2. Pricing Forecasts Per Unit, 2023- 2032
Figure 3. Porter’s Five Forces
Figure 4. Global Chips Market Revenue (USD Million) By Regions (2021-2032)
Figure 5. Global Chips Market Share (%) By Regions (2023)
Figure 6. North America Chips Revenue (USD Million) By Country (2021-2032)
Figure 7. United States Chips Revenue (USD Million) By Country (2021-2032)
Figure 8. Canada Chips Revenue (USD Million) By Country (2021-2032)
Figure 9. Mexico Chips Revenue (USD Million) By Country (2021-2032)
Figure 10. Europe Chips Revenue (USD Million) By Country (2021-2032)
Figure 11. Germany Chips Revenue (USD Million) By Country (2021-2032)
Figure 12. France Chips Revenue (USD Million) By Country (2021-2032)
Figure 13. United Kingdom Chips Revenue (USD Million) By Country (2021-2032)
Figure 14. Spain Chips Revenue (USD Million) By Country (2021-2032)
Figure 15. Italy Chips Revenue (USD Million) By Country (2021-2032)
Figure 16. Russia Chips Revenue (USD Million) By Country (2021-2032)
Figure 17. Rest of Europe Chips Revenue (USD Million) By Country (2021-2032)
Figure 11. Asia Pacific Chips Revenue (USD Million) By Country (2021-2032)
Figure 12. China Chips Revenue (USD Million) By Country (2021-2032)
Figure 13. Japan Chips Revenue (USD Million) By Country (2021-2032)
Figure 14. India Chips Revenue (USD Million) By Country (2021-2032)
Figure 15. South Korea Chips Revenue (USD Million) By Country (2021-2032)
Figure 16. Australia Chips Revenue (USD Million) By Country (2021-2032)
Figure 17. South East Asia Chips Revenue (USD Million) By Country (2021-2032)
Figure 18. South America Chips Revenue (USD Million) By Country (2021-2032)
Figure 19. Brazil Chips Revenue (USD Million) By Country (2021-2032)
Figure 20. Argentina Chips Revenue (USD Million) By Country (2021-2032)
Figure 21. Rest of Asia Pacific Chips Revenue (USD Million) By Country (2021-2032)
Figure 22. Middle East and Africa Chips Revenue (USD Million) By Region (2021-2032)
Figure 23. Saudi Arabia Chips Revenue (USD Million) By Region (2021-2032)
Figure 24. The UAE Chips Revenue (USD Million) By Region (2021-2032)
Figure 25. Rest of Middle East Chips Revenue (USD Million) By Region (2021-2032)
Figure 26. South Africa Chips Revenue (USD Million) By Region (2021-2032)
Figure 27. Africa Chips Revenue (USD Million) By Region (2021-2032)
Figure 28. North America Chips Revenue (USD Million) By Type (2021-2032)
Figure 29. North America Chips Revenue (USD Million) By Application (2021-2032)
Figure 30. North America Chips Revenue (USD Million) By Product (2021-2032)
Figure 31. Europe Chips Revenue (USD Million) By Type (2021-2032)
Figure 32. Europe Chips Revenue (USD Million) By Application (2021-2032)
Figure 33. Europe Chips Revenue (USD Million) By Product (2021-2032)
Figure 34. Asia Pacific Chips Revenue (USD Million) By Type (2021-2032)
Figure 35. Asia Pacific Chips Revenue (USD Million) By Application (2021-2032)
Figure 36. Asia Pacific Chips Revenue (USD Million) By Product (2021-2032)
Figure 37. South America Chips Revenue (USD Million) By Type (2021-2032)
Figure 38. South America Chips Revenue (USD Million) By Application (2021-2032)
Figure 39. South America Chips Revenue (USD Million) By Product (2021-2032)
Figure 40. Middle East and Africa Chips Revenue (USD Million) By Type (2021-2032)
Figure 41. Middle East and Africa Chips Revenue (USD Million) By Application (2021-2032)
Figure 42. Middle East and Africa Chips Revenue (USD Million) By Product (2021-2032)
By Type
Corn Chips
Potato Chips
Tortilla Chips
Multigrain Chips
Others
By Application
Supermarkets/Hypermarkets
Convenience Stores
Independent Retailers
Online Sales
Others
Countries Analyzed
North America (US, Canada, Mexico)
Europe (Germany, UK, France, Spain, Italy, Russia, Rest of Europe)
Asia Pacific (China, India, Japan, South Korea, Australia, South East Asia, Rest of Asia)
South America (Brazil, Argentina, Rest of South America)
Middle East and Africa (Saudi Arabia, UAE, Rest of Middle East, South Africa, Egypt, Rest of Africa)
